

SYNOPSIS
The Nitric Oxide Synthases (NOS; EC 1.14.13.39) contain a C-terminal flavoprotein domain (NOSred) that binds FAD and FMN and an N-terminal oxygenase domain that binds heme. Evidence suggests that the FMN-binding domain undergoes large conformational motions to shuttle electrons between the NADPH/FAD-binding domain (FNR) and the oxygenase domain. previously we showed that three residues on the FMN domain (Glu762, Glu816 and Glu819) that make charge-pairing interactions with the FNR help to slow electron flux through nNOSred. In this study, we show that charge neutralization or reversal at each of these residues alters the setpoint (KeqA) of the NOSred conformational equilibrium to favor of the open (FMN-deshielded) conformational state. Moreover, computer simulations of the kinetic traces of cytochrome c reduction by the mutants suggest that they have relatively larger effects on the conformational transition rates (from 1.5 to 4x faster) and the rate of interflavin electron transfer (from 1.5 to 2x faster) relative to wild type nNOSred. We conclude that the three charge-pairing residues on the FMN domain govern electron flux through nNOSred by stabilizing its closed (FMN-shielded) conformational state and by retarding the rate of conformational switching between its open and closed conformations.
Keywords: nNOS, Conformational equilibrium, Stopped-flow, Electron transfer, Electron flux, Flavoprotein, Domain motion
INTRODUCTION
Nitric oxide (NO) is involved in cardiovascular, neuronal, and immune functions during both normal and disease states [1,2]. NO is produced in mammals by three isoforms of nitric oxide synthase (NOS; EC 1.14.13.39) known as the neuronal (nNOS), endothelial (eNOS), and inducible NOS (iNOS). All three are homodimeric enzymes that catalyze a two-step oxidation of L-arginine (L-Arg) to generate NO and citrulline [3]. They are comprised of an N-terminal oxygenase domain (NOSoxy) that contains binding sites for iron protoporphyrin IX (heme), (6R)-5,6,7,8-tetrahydro-L-biopterin (H4B), and L-Arg, a C-terminal reductase domain (NOSred) that contains binding sites for flavin adenine dinucleotide (FAD), flavin mononucleotide (FMN), and nicotinamide adenine dinucleotide phosphate (NADPH), and an intervening calmodulin (CaM) binding sequence [4]. The NOSoxy, NOSred, and CaM binding domains can be expressed independently and have been subject to detailed structural, kinetic, and regulatory studies [5–9].
NOSred shares structural and catalytic features with a family of dual flavin enzymes, including NADPH cytochrome P-450 reductase (CPR), the flavoprotein of Escherichia coli sulfite reductase, methionine synthase reductase, novel reductase-1, and the reductase domain of bacterial cytochrome P450BM3 [10–14]. These proteins are comprised of separate FMN-binding and FAD/NADPH-binding (FNR) domains that are attached by a flexible hinge [6,15]. During catalysis, the FAD receives a hydride from NADPH and then sequentially passes electrons to the FMN cofactor. Ultimately, the 2-electron reduced FMN hydroquinone transfers an electron to a heme group in a separate acceptor enzyme, or in the case of NOS, to the heme located in the NOSoxy domain of the partner subunit of the dimer [16,17]. The FMN hydroquinone in these enzymes can also reduce external electron acceptors such as cytochrome c [18] and this activity is widely used as a tool to study electron flux through NOSred and related enzymes.
The FMN domain in the dual flavin reductases is thought to undergo relatively large conformational motions in order to transfer electrons during catalysis [6,8,11,13,19–22]. Fig. 1 illustrates a model for FMN domain conformational switching during electron transfer within a NOS homodimer. The FMN domain must first interact with the FNR domain in a “FMN-shielded” conformation to receive electrons, according to equilibrium A. Once the FMN hydroquinone forms (FMNH2), it must swing away to a “FMN-deshielded” conformation, and then must interact with the NOSoxy domain in the partner subunit of a NOS dimer, according to equilibrium B. Its interaction with the NOSoxy domain allows the FMN-to-heme electron transfer [8]. Data suggest that conformational equilibria A & B have their own intrinsic set points (Keq) and individual control [8,20], and that the FMN-to-heme electron transfer step is fast once a productive docking conformation is achieved [23], which implies that the conformational kinetic parameters may be rate-limiting for the entire process.
Figure 1. Model of NOS FMN domain function in electron transfer and heme reduction.
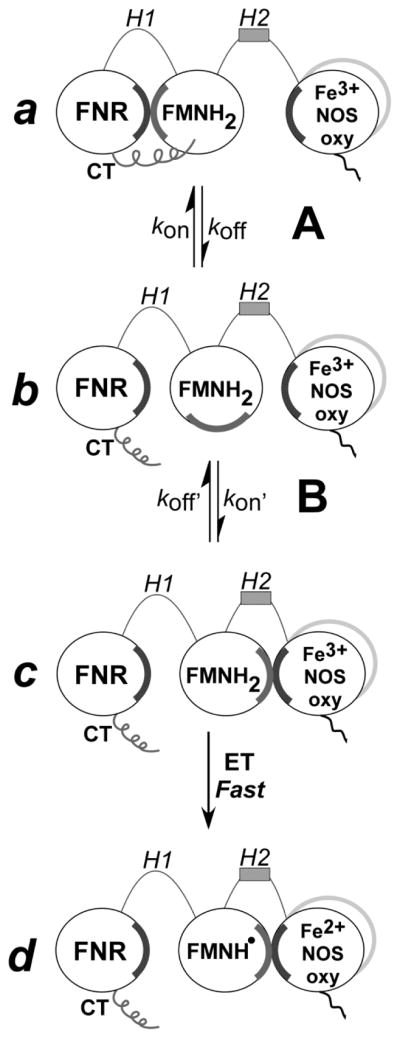
Electron transfer in NOS is mainly regulated by two conformational equilibria, (A and B). Equilibrium A indicates the change between a conformation in which FNR and FMN domains are interacting (a) and a conformation where the FMN domain is deshielded and available for interaction with electron acceptors such as cytochrome c (b). Note that the CT stabilizes the conformation a. Equilibrium B indicates the transition from the FMN deshielded conformation (b) to a FMN–NOSoxy domain interacting state (c). Once the FMN and the oxy domains are close, electron transfer to the heme is fast (d). CT, C-terminal tail.
The reductase activities of nNOSred and eNOSred are, with the exception of novel reductase-1 [11], repressed when compared to the other family members, but CaM binding to the NOS enzymes relieves this repression. The CaM effect is associated with its shifting equilibrium A toward the FMN-deshielded state in nNOSred and eNOSred [8,20] [7,19,24,25]. This forms the basis for the hypothesis that electron flux is regulated by conformational parameters, namely the setpoint and transition rates of conformational equilibrium A [24,26]. In CaM-free NOS, the FMN-shielded conformation is relatively stable and a crystal structure of nNOSred in this putative conformation is available [6]. We know that electron flux through NOSred is regulated by several unique structural elements that include an autoinhibitory insert (AI) sequence within the FMN domain [7,27,28], a C-terminal tail (CT) [9,25,29,30], phosphorylation sites [31–33], a loop within the connecting domain [34], which may act in concert with other structural features that NOS shares with dual-flavin reductases, such as the FMN-FNR domain connecting hinge [35], a conserved aromatic residue (Phe1395 in nNOS) that stacks against the FAD isoalloxazine ring and governs the NADPH nicotinamide interaction [24,36], surface residues that form charge pairing interactions between the FMN and FNR domains [37–39], and NADP(H) binding [19,25]. So far, the CT, AI, Phe1395, and NADPH binding interaction have all been shown to stabilize the FMN-shielded state of CaM-free nNOSred [7,9,19,24]. Here, we investigate the mechanism by which complementary charge-pairing interactions at the FMN-FNR domain interface influence electron flux through nNOS, specifically testing if they do so by impacting the conformational parameters of equilibrium A. In our previous study [38], we surveyed six electronegative surface residues on the FMN domain that form charge-pairing interactions with the FNR domain, and identified three that have the greatest capacity to slow electron flux through nNOSred (Glu762, Glu816 and Glu819) (Fig. 2). Our current study shows that charge neutralization or reversal at each of these sites alters both the setpoint and transition rates of equilibrium A, and that these changes can fully explain the increased electron flux seen in the mutants. Thus, we provide the first experimental evidence that inter-domain charge pairing interactions influence electron flux primarily by tuning the conformational parameters of the FMN domain during catalysis.
Figure 2. Structure of the nNOS FMN and FNR domains.

FMN domain showing location of Glu762, Glu816 and Glu819 residues (upper panel). The interacting surface of the FNR module contains an electropositive patch (lower panel). Negative charged surface (black), positive charged surface (light gray).
EXPERIMENTAL
General Methods and Materials
All reagents and materials were obtained from Sigma, Amersham Biosciences, or other sources as reported previously [7,20,24,37]. Absorption spectra and steady-state kinetic data were obtained using a Shimadzu UV-2401PC spectrophotometer. Single wavelength stopped-flow kinetic experiments were performed using a Hi-Tech Scientific (Salisbury, UK) SF-61 instrument equipped with anaerobic setup and photomultiplier detection. Data from multiple identical stopped-flow experiments were averaged to improve the signal-to-noise ratio. The spectral traces were fit according to single or multiple exponential equations using software provided by the instrument manufacturer. The best fit was determined when adding further exponentials did not improve the fit as judged from the residuals. All plots and additional curve fitting were done using Origin 8.0 (OriginLab, Northampton, MA). All experiments were repeated two or more times with at least two independently prepared batches of proteins to ensure consistent reproducibility of the results. Data were analyzed and are expressed as mean ± S.D. For all experiments and protein purifications, the buffer used contained 40 mM EPPS (pH 7.6), 10% glycerol, and 150 mM NaCl, unless noted otherwise. Anaerobic samples were prepared in an air-tight cuvette using repeated cycles of vacuum followed by a positive pressure of catalyst deoxygenated nitrogen gas. All nNOSred proteins samples were fully oxidized by adding potassium ferricyanide, and the excess potassium ferricyanide was removed by passing through a Sephadex G-25 column (PD-10, GE Healthcare).
Generation of nNOSred mutants
The bacterial expression vector pCWori contained cDNA that coded for rat nNOSred with its adjacent N-terminal CaM binding motif (Met695 - Ser1429) as described previously [24]. Oligonucleotides for site-directed mutagenesis were obtained from Integrated DNA Technologies (Coralville, IA) and are listed in Supplemental Table I. Site directed mutagenesis was performed using the QuikChange XL mutagenesis kit (Agilent Technologies-Stratagene, La Jolla, CA). Mutations were confirmed by DNA sequencing at the Cleveland Clinic Genomics Core Facility. Mutated plasmids were transformed into E. coli BL21(DE3) cells transformed with a pACYC plasmid containing human CaM to co-express CaM with the protein.
Expression and Purification of Wild type and Mutant nNOSred Proteins
Wild type and mutant enzyme expression was induced at room temperature over one or two days in E. coli BL21(DE3) that harbored the pACYC-CaM plasmid as previously described [24]. The nNOSred proteins were purified by sequential chromatography on a 2′,5′-ADP Sepharose affinity column and CaM-Sepharose resin as reported [24]. Purity of each protein was assessed by SDS-PAGE and spectral analysis. For the nNOSred proteins, concentration was determined by using an extinction coefficient of 22,900 M−1 cm−1 at 457 nm for the fully oxidized form [40].
Steady-state Cytochrome c Reduction Assays
The cytochrome c reductase activity was determined at 25 °C and 10 °C by monitoring the absorbance increase at 550 nm and using an extinction coefficient ε550 = 21 mM−1 cm−1 as described previously [7,24,25,41].
Oxidation of reduced nNOSred Proteins
A solution of fully oxidized nNOSred protein (6–8 μM) containing either EDTA (1 mM) or CaCl2 (2 mM) + CaM (30 – 40 μM) in air-saturated buffer was reduced by adding NADPH (120 – 160 μM) and then allowed to auto-oxidize at room temperature in an open cuvette [24,25]. The process was monitored at 457 nm, and visible spectra at indicated time points (vide infra “Results”) were recorded in similar experiments.
Anaerobic Stopped-flow Flavin Reduction Kinetics in nNOSred Proteins
The absorbance changes associated with nNOSred flavin reduction by NADPH were recorded by rapidly mixing a solution of oxidized nNOSred (8 – 10 μM) containing either EDTA (1 mM) or CaCl2 (2 mM) + CaM (80 – 100 μM) with a solution of around 100 μM NADPH at 10 °C in the stopped-flow instrument. The maximum absorbance value for a given protein sample at 457 nm during single wavelength experiments was obtained by replacing the NADPH solution in one of the stopped-flow syringes with buffer only and recording additional mixing events. The individual rate constants associated with absorbance changes at 457 nm were first estimated by analysis of experiments of varying lengths. The final reported values were obtained by fitting an experiment on a time scale capturing all three rate constants to a triple exponential function such that the residuals were minimized and contained little or no systematic deviation between the fit curve and the actual data. Percent absorbance changes were calculated based on the absorbance change in the instrument dead time and the relative proportions of the ΔA values for each kinetic phase obtained from the fitting program [7,24].
Reaction of Fully Reduced nNOSred Proteins with Excess Cytochrome c
The rate of reduction of excess cytochrome c by fully reduced nNOSred proteins was measured in the stopped-flow instrument under anaerobic conditions at 10 °C as described previously [20]. The nNOSred (10–15 μM) protein in 40 mM EPPS buffer (pH 7.6) with 10% glycerol, and 150 mM NaCl containing EDTA (2 mM) was fully reduced by titrating it with anaerobic sodium dithionite solution. A solution of fully reduced nNOSred proteins containing NADPH (200 μM) was mixed with cytochrome c (100 μM) while monitoring the absorbance changes at 550 nm. We have also measured the rate of cytochrome c reduction by photo-reduced nNOSred proteins under various conditions in the stopped-flow apparatus. Briefly, each nNOSred protein (10 – 15 μM), 5-deazariboflavin (~1 μM), and EDTA (1 mM) was completely photo-reduced in an anaerobic cuvette using a commercial slide projector bulb until no changes in the UV-visible spectrum of the sample were observed upon further irradiation of the sample. The fully reduced protein sample was rapidly mixed in the stopped-flow instrument with a solution of cytochrome c (~100 μM) at 10 °C. The absorbance change at 550 nm was recorded. In a second set of experiments, 1 mM of NADPH was added to the photo-reduced protein sample, and the mixture was incubated at 10 °C for 15 min and scanned to confirm the protein remained fully-reduced prior to mixing. Multiple absorbance traces were averaged and fit to a single or double exponential function. Initially, a solution of cytochrome c and NADPH was mixed with anaerobic buffer to obtain the initial absorbance reading at time 0 in both dithionite-reduced and photoreduced enzymes. A linear regression analysis of late points in the traces and/or numeric derivatives of the traces were run to determine the deflection points separating the early burst of fast-reacting and late slow-reacting phases (vide infra “Results”).
Simulation of the Kinetic Traces of Fully Reduced nNOSred Proteins with Excess Cytochrome c
We have used the computer program Gepasi v.3.30 [42] to simulate the experimental electron flux to cytochrome c using the kinetic model as outlined in the Fig. 3. Details of this type of simulation have been reported recently [43]. Briefly, cytochrome c is set to be in 100-fold molar excess relative to the various flavoproteins and each simulation starts with 100% of the enzyme in the fully reduced state. Input rates (k1, k-1, k3 and k-3) that satisfy the observed conformational equilibrium constant are first used, and then refined in an iterative process using the time of first turnover and overall best fit of the kinetic trace as criteria to extract the best rates for FMN conformational motion and interflavin electron transfer.
Figure 3. Kinetic model for electron flux through a dual-flavin enzyme.

The model uses four kinetic rates: association (k1 or k3) and dissociation (k-1 or k-3) of the FMN and FNR domains; the FMNH• reduction rate (k2), and the cytochrome c reduction rate (k4). The fully-reduced enzyme in the open conformation (species a) reduces cytochrome c and generates species b, which then undergoes successive conformational closing, interflavin electron transfer, and conformational opening steps to complete the cycle.
RESULTS
Cytochrome c reductase activity in the absence and presence of bound CaM
The cytochrome c reductase activity nNOSred is repressed in the native state and the repression is relieved upon CaM binding [44]. We examined how the FMN domain surface mutations would impact nNOSred reductase activities in the CaM-free or CaM–bound states (Fig. 4A and Supplemental Table 2). All assays contained superoxide dismutase (SOD) to insure we only detected reductase activity that involved a direct electron transfer from nNOSred to cytochrome c [18,19]. The CaM-free E762N, E762R, E816R, E819R and triple mutants displayed activities at 25 °C that were ~9.9-fold, ~8.7-fold, 5.1-fold, 4-fold and 8.9-fold greater than CaM-free WT-nNOSred, respectively. Similar results were obtained when we ran the assays at 10°C (Fig. 4B). CaM enhanced the nNOSred reductase activity nearly 9-fold, but caused smaller increases in E816R, E819R or had a negligible effect in E762N, E762R, and triple mutant consistent with their higher CaM-free reductase activities. Our data suggest that the charge pairings normally help repress electron flux through the CaM-free protein but have little impact on electron flux once CaM is bound.
Figure 4. Steady-state cytochrome c reductase activities of nNOS and mutants in the absence and presence of CaM.

Activities were measured at 25 °C and at 10 °C in the presence of SOD and either in the absence or presence of CaM. Values are representative of three measurements done under identical conditions, using two different protein preparations for each mutant.
Flavin Auto-oxidation
We next determined if the mutations altered the flavin auto-oxidation rate or the air stability of the FMN semiquinone (FMNsq). We mixed each fully-oxidized protein with a 20-fold molar excess of NADPH in air-saturated buffer and followed changes in the flavin reduction status at 457 nm versus time, and also collected visible spectra prior to NADPH addition, during steady-state NADPH oxidation, and after all the NADPH had been oxidized (Fig. 5, Supplemental Fig. S1). After NADPH addition all proteins achieved a similar level of flavin reduction in the steady state and all showed a prominent flavin semiquinone absorbance at 600 nm. However, the E819R, E762R, triple mutant, E762N, and E816R nNOSred mutants consumed NADPH at rates approximately 1.1, 1.6, 1.7, 1.9 and 2.0 times faster than did WT-nNOSred, respectively. All mutants except E819R also exhibited 2 to 3.5 times faster rates of flavin re-oxidation after the NADPH was depleted (Fig. 5A &B, and Supplemental Fig. S1,). An inspection of the final absorbance traces and the final absorbance values at 457 nm indicate that all the proteins except for the E762R and the triple mutant were left with an air-stable FMNsq as occurs in WT-nNOSred [24,45]. This is consistent with our observation that these mutants purify as fully oxidized proteins (bright-yellow with an absence of FMNsq absorbance). Thus, most of the mutations increased flavin auto-oxidation rates and in some cases diminished the air stability of the FMNsq radical.
Figure 5. Kinetics of flavin auto-oxidation in the NADPH-reduced wild-type and mutant nNOSred enzymes.

Wild-type and mutant nNOSred proteins were diluted to ~6 μM in air-saturated buffer in a cuvette, given a 15-fold molar excess of NADPH, and then allowed to consume NADPH at room temperature as described in experimental section. A, the redox status of enzyme flavins was monitored at 457 nm versus time. B, Flavin auto-oxidation rates (mAbs/min). C and D, the visible spectra shown were recorded for the wild-type and E762R-E816R-E819R nNOSred prior to NADPH addition (1), during NADPH consumption (2), and after all the NADPH had been consumed and flavin reoxidation had occurred (3). Data are representative of two independent experiments.
Kinetics of Flavin Reduction in Fully-oxidized nNOSred Enzymes
We next examined the flavin reduction kinetics in the mutant proteins. The reactions mixed the fully-oxidized nNOSred proteins with excess NADPH at 10 °C under anaerobic conditions in a single wavelength stopped-flow spectrophotometer, and flavin reduction was followed at 457 nm. All traces fit well to a triple exponential equation [7,46]. The results are listed in Table 1, and fits are shown in Supplemental Fig. S2. A significant proportion (15 to 25%) of the total absorbance decrease at 457 nm occurred in the mixing dead time in all cases, consistent with previous reports [7,24,25]. At 457 nm, the initial phase is considered to reflect the hydride transfer from NADPH to FAD, followed by slower phases that reflect interflavin electron transfer, NADP+ dissociation, and further reduction by a second NADPH [22]. All the mutants displayed faster flavin reduction kinetics in their CaM-free state relative to wild-type nNOSred. The magnitudes of their rate increases generally correlated with the degree to which their cytochrome c reductase activities had increased (Fig. 4). The flavin reduction kinetics in CaM-free E762N, E762R, E816R and the triple mutant were increased enough (Table 1) to approach the rates observed for CaM-bound WT-nNOSred, whereas the CaM-free E819R mutant had an intermediate behavior that was closer to wild-type. Thus, most mutants lost most or all of the kinetic repression on flavin reduction that is normally present in CaM-free nNOSred [24,45].
Table 1. Rates of NADPH-dependent flavin reduction of nNOSred proteins.
Reactions were carried out in a stopped-flow instrument at 10 °C by mixing oxidized enzymes with a 10-fold molar excess of NADPH and monitoring the absorbance changes at 457 nm. Data were fit to a triple exponential function as described in experimental section. Values are the mean ± SD for at least two trials and representative of data obtained with two preparations.
| Enzyme nNOSred | Conditions | Dead timea | k1b (%) | k2b (%) | k3b (%) |
|---|---|---|---|---|---|
| % | s−1 | s−1 | s−1 | ||
| Wild type | −CaM | 18 | 59 ± 7 (28) | 4.4 ± 0.3 (31) | 0.86 ± 0.02 (23) |
| +CaM | 23 | 159 ± 4 (37) | 18.5 ± 0.5 (29) | 1.8 ± 0.2 (11) | |
| E762N | −CaM | 25 | 129 ± 6 (32) | 11 ± 1 (18) | 2.3 ± 0.1 (25) |
| +CaM | 26 | 146 ± 3 (48) | 14.5 ± 1.8 (11) | 2.5 ± 0.2 (15) | |
| E762R | −CaM | 17 | 113 ± 7 (35) | 4.4 ± 0.5 (21.5) | 0.8 ± 0.1 (26.5) |
| +CaM | 24 | 130 ± 9 (38.5) | 6.0 ± 0.5 (12) | 1.3 ± 0.1 (25.5) | |
| E816R | −CaM | 16 | 178 ± 12 (27) | 9.0 ± 0.3 (34) | 1.1 ± 0.1 (23) |
| +CaM | 19 | 214 ± 17 (32) | 10.7 ± 1 (33) | 1.0 ± 0.1 (16) | |
| E819R | −CaM | 14 | 82 ± 6 (28) | 7.0 ± 0.8 (27.5) | 1.5 ± 0.1 (30.5) |
| +CaM | 15 | 119 ± 6 (25) | 18.0 ± 1.2 (31) | 2.7 ± 0.1 (29) | |
| Triple mutant | −CaM | 15 | 163 ± 13 (28) | 9.1 ± 0.4 (43.5) | 0.95 ± 0.1 (13.5) |
| +CaM | 15 | 211 ± 19 (32) | 11 ± 1 (46) | 1.43 ± 0.18 (7) |
Percentage of the total absorbance change occurring in the instrument dead time.
Values are the calculated rates with % of the total absorbance change attributed to that phase in parenthesis.
Conformational equilibrium of nNOSred
In nNOSred the FMN domain shifts between shielded and deshielded conformational states [25,26,36,40] and only the deshielded state is capable of transferring electrons to cytochrome c. This makes the cytochrome c reductase activity of nNOSred sensitive to the degree of FMN shielding and to the associated transition rates between the open and closed conformational states [8,9,20,24,26]. One way to study the conformational equilibrium is by a stopped-flow spectroscopic method that monitors the reaction of fully-reduced enzyme with a large molar excess of cytochrome c. Under this circumstance, the kinetics of the absorbance change that occurs during reduction of the first few molar equivalents of cytochrome c can provide the KeqA set point for the conformational equilibrium, and through computer modeling of the absorbance trace according to the kinetic model in Fig. 3, in most cases can provide rate estimates for the conformational transitions between the FMN-shielded and deshielded forms [20,43].
We rapid-mixed the NADPH-bound forms of each fully-reduced (dithionite) nNOSred protein with a 10-fold excess of cytochrome c in the stopped-flow spectrometer at 10 °C, and monitored the first few turnovers of cytochrome c reduction at 550 nm. Representative kinetic traces obtained for WT-nNOSred and each mutant protein are shown in Fig. 6. The starting absorbance values at time = 0 were determined in each case by mixing enzyme-free buffer with cytochrome c under otherwise identical conditions. Upon mixing each reduced enzyme with excess cytochrome c, there was a rapid absorbance increase that took place in the mixing dead time followed by a slower observable absorbance increase. In the case of the WT-nNOSred, about 50% of the total absorbance change that is ascribed to reduction of the first equivalent of cytochrome c (the portion of the trace confined within the dashed boxes in each panel of Fig. 6) occurred within the mixing dead time, and the remaining 50% occurred during the subsequent observable period (Panel A, Fig. 6). This indicates that equivalent amounts of FMN-shielded and deshielded enzyme conformers were present at the time of mixing, giving an estimated KeqA = 1 for the conformational equilibrium of CaM-free, fully-reduced, NADPH-bound WT-nNOSred, consistent with our previous estimate [20]. In comparison, the mutants had either similar or somewhat larger portions of their 1st turnovers completed within the mixing dead time (Fig. 6 panels B–F), indicating that they have somewhat higher KeqA values for their conformational equilibrium compared to wild-type, and thus slightly favor the FMN-deshielded conformer. The calculated KeqA values of the NADPH-bound enzymes are listed in Table 2. The rates of cytochrome c reduction subsequent to transfer of the first electron equivalent (i.e., slope of line after the dashed box) were all considerably faster in the mutants than in WT-nNOSred, consistent with the mutants having higher steady-state reductase activities. Thus, the results indicate that the conformational equilibrium setpoints of the fully-reduced, NADPH-bound mutants are slightly altered to favor the FMN-deshielded state, according to the following rank order of highest to lowest KeqA: Triple mutant > E819R, E762R > E762N, E816R > WT (Table 2).
Figure 6. Reaction of fully reduced wild-type and mutant nNOSred proteins with excess cytochrome c.

Solutions of pre-reduced, CaM-free nNOSred (6–10 μM) containing 200 μM NADPH were rapidly mixed with cytochrome c (100 μM) in a stopped-flow instrument under anaerobic conditions at 10 °C. Kinetic traces were recorded at 550 nm during the first few electron transfers to cytochrome c. The absorbance change representing the first turnover is shown by dotted lines according to the right-hand scale in each figure. Data are representative of at least two experiments.
Table 2. Kinetic Parameters for WT-nNOSred and mutants derived from experimental traces of cytochrome c reduction or from fitting the experimental traces according to the four-state kinetic model.
See text for details. Data are representative of two or three trials with each protein. Values in parentheses are experimental values. ND, Not determined; WT, wild type.
| Enzyme nNOSred | Measured KA | Best fit k1 = k3 (s−1) | Best fit k-1 = k-3 (s−1) | Best fit k2 (s−1) | Fitted Steady state electron flux (s−1) (Experimental value) | Fitted Time elapsed for 1st turnover (ms) (Experimental value) |
|---|---|---|---|---|---|---|
| WT | 1 | 60 | 60 | 20 | 7.6 (7.6) | 34 (31) |
| E762R | 1.53 | 150 | 230 | 38 | 12.9 (11.8) | 9.5 (9.5) |
| E762N | 1.32 | 150 | 198 | 55 | 18.55 (17.9) | 10.8 (10.8) |
| E816R | 1.25 | 200 | 250 | 41 | 15.6 (14.3) | 9.0 (8.8) |
| E819R | 1.63 | 80 | 130 | 42 | 11.65 (11.46) | 15 (16.5) |
| Triple | 2.33 | - | - | - | ND (31.1) | ND (5.3) |
Effect of bound NADPH on conformational behaviors
One can utilize this stopped flow approach to determine how bound NADPH impacts the conformational equilibrium, and whether the mutations alter this aspect. Bound NADPH has been reported to stabilize the FMN shielded or closed conformation of nNOSred [9,19,25]. We investigated here by comparing the behavior of the enzymes after they had been fully photoreduced and then either had NADPH added or not. The kinetic traces in Fig 7A & B show that the fully-photoreduced WT-nNOSred exists in an approximate 50–50 mix of open and closed conformers in both its NADPH-free and -bound states. This indicates that bound NADPH has little or no influence on the KeqA setpoint of the fully-reduced WT-nNOSred, which differs from previous reports. However, these same two traces show that bound NADPH did greatly slow transfer of the remainder of the 1st electron equivalent to cytochrome c (i.e., compare the slopes of the traces within the dashed boxes) and also slowed subsequent transfer of the 2nd electron equivalent out of nNOSred. In comparison, traces recorded for three mutants in their NADPH-free states (Panels C, E, G) show that the first electron equivalent is almost entirely transferred to cytochrome c in the mixing dead time for all three mutants. This suggests that these mutants primarily exist in an open conformation in their NADPH-free forms, and in this way differ from NADPH-free WT-nNOSred in having a higher KeqA setpoint under this circumstance. These traces also show that subsequent electron transfer out of each mutant is faster than for WT-nNOSred under the NADPH-free condition. Despite these differences, bound NADPH still significantly slowed electron flux out of the three fully-reduced nNOSred mutants in a manner similar to that seen for WT nNOSred. In addition, bound NADPH appeared to shift the conformational distributions of the mutants toward a greater population of closed conformers (Fig. 7 Panels D, F, H).
Figure 7. Effect of NADPH on the conformational equlibrium of wild-type nNOSred and variants.

Photoreduced nNOSred proteins in the presence or absence of NADPH was mixed with a 10-fold molar excess cytochrome c in a stopped-flow spectrophotometer under anaerobic conditions at 10 °C as described in experimental section. Kinetic traces were recorded at 550 nm during the first few electron transfers to cytochrome c. The absorbance change representing the transfer of the 1st electron equivalent from nNOSred is shown by dotted lines according to the right-hand scale in each figure. Data are representative of at least two experiments.
Kinetic modeling study
To more fully understand how the charge pairing residues impact the conformational equilibrium parameters, we computer-simulated the experimental kinetic traces for each NADPH-bound enzyme in Fig. 6, according to a four-state kinetic model that links the rates of nNOSred conformational motions and interflavin electron transfer to the electron flux to cytochrome c [43] (Fig. 3). We incorporated our estimated KeqA setpoint measures and then used an iterative method to find allowable rate values for interflavin electron transfer and FMN domain conformational transitions that ultimately give a best fit of the experimental kinetic traces and of the times required to complete transfer of the 1st electron equivalent as indicated in Fig 6. We have used this approach previously to derive estimates of the conformational and interflavin electron transfer rate parameters for WT nNOSred and eNOSred [43]. In our current study, we were able to closely fit the experimental traces for WT-nNOSred and all of the mutants except for the triple mutant (Supplemental Fig. S3). Table 2 reports the best-fit rates that we derived for the interflavin electron transfer and the FMN domain conformational motions. The rates derived for WT-nNOSred are close to those reported in the original study [43]. In comparison, the simulations of the mutant kinetic traces indicate that they all must have faster interflavin electron transfer rates and faster rates of FMN domain conformational transitions relative to wild-type, in order to support their observed rates of electron flux to cytochrome c.
DISCUSSION
Inter-domain charge pairing interactions are among several structural features thought to govern electron flux through NOS [8,47]. In the current study, we investigated three residues that form charge pairing interactions at the NADPH/FAD-FMN domain interface (Glu762, Glu816, and Glu819) that were previously shown to help govern electron flux through the CaM-free nNOS [38], asking here whether they do so by controlling the conformational behavior of nNOSred. We found that reversing or eliminating the negative charge at each of these residues did alter nNOSred conformational behaviors in a manner that was consistent with, and sufficient to explain, the observed changes in electron flux through the enzyme to cytochrome c. Thus, we conclude that the charge pairing interactions of Glu762, Glu816, and Glu819, as observed in the crystal structure [6,38], each help to retard electron flux through CaM-free nNOSred by influencing the conformational KeqA setpoint and its associated conformational kinetic parameters.
Our modeling study indicated that eliminating the inter-domain charge pairings altered both the KeqA setpoint and the associated rates of conformational switching between the open and closed states of nNOSred. In all cases but to varying degrees, there was a shift in the KeqA setpoint to favor the open or FMN-deshielded form of nNOSred, which was accompanied by significantly faster rates of conformational switching (i.e., k1 & k-1). Because the mutant KeqA setpoints all rose above 1, which is predicted to be the optimal setting for electron flux through nNOSred [43], there had to be accompanying rate increases in the conformational opening steps (k-1 & k-3) and the conformational closing steps (k1 & k3) in order to satisfy the observed faster cytochrome c reductase activities of the mutants. Evidence leading to these conclusions is discussed below.
Impact on the KeqA setpoint of nNOSred
Results from the experiments where the fully-reduced, NADPH-bound forms of nNOSred proteins were mixed with a large molar excess of cytochrome c (Traces in Fig. 6, Table 2) indicated that from 55–60% of the singly-mutated proteins exist in the open state, while the triple mutant exists as 70% in the open state. These percentages fall between those observed for CaM-free WT-nNOSred (approximately 50% open) and CaM-bound WT-nNOSred (approximately 90% open) when in their fully-reduced, NADPH-bound forms [20,21]. This relatively mild impact on the conformational equilibrium setpoint is consistent with the single charges at Glu762, Glu816, and Glu819 all cooperating to stabilize the closed form of nNOSred, and with CaM causing a more extensive destabilization of the closed conformation by distinct mechanisms that override the inter-domain charge pairing stabilization. Interestingly, a given mutation’s capacity to increase the KeqA setpoint was not always well-correlated with its capacity to increase electron flux through the CaM-free protein to cytochrome c (i.e., increase the reductase activity, see Fig. 4), suggesting that other effects besides simply shifting the KeqA setpoint are important, as discussed below.
Simulations imply an increase in conformational transition rates
Previous computer simulations of our kinetic model in Fig. 3 indicated that an optimal electron flux through nNOSred to cytochrome c should occur at or near a KeqA setting of 1 [8,43]. Given that the Glu762, Glu816, and Glu819 mutants all have values of KeqA > 1, this stipulates that their conformational transition rates (k1, k3, k-1, k-3) would have to increase in order for the mutants to be capable of supporting greater electron flux to cytochrome c relative to WT-nNOSred. Indeed, our best fits of the experimental traces for cytochrome c reduction by the mutant proteins indicated that the mutants should all have significantly faster conformational transition rates (from 1.5 to 4x faster) and corresponding faster rates of interflavin electron transfer (from 1.5 to 2x faster) relative to wild type to support their observed faster electron flux to cytochrome c. These predicted increases in the conformational transition rates are remarkable, considering that they result from reversing or neutralizing single surface charges that participate in inter-domain charge pairing across a domain interface. Thus, we conclude that the inter-domain charge pairing interactions of Glu762, Glu816, and Glu819 have a combined function: They lower the KeqA setpoint of CaM-free nNOSred, and also retard the associated conformational transition rates between its open and closed forms, thereby restricting electron flux through the enzyme.
NADP(H)-induced Conformational Effects Remain Intact
Our current results indicate that NADPH binding to the fully-reduced WT-nNOSred causes little or no shift in its conformational equilibrium setpoint toward the closed form. This conclusion differs markedly from what we and other groups have previously reported, namely that NADPH has a strong effect in stabilizing the closed conformation [7,19,24,25]. However, these former studies used a different experimental approach in which cytochrome c was rapid-mixed with a 5 to 10 fold molar excess of reduced NOSred enzyme. Because the cytochrome c concentration is rate limiting in this circumstance, the reaction of the open nNOSr conformer does not finish in the mixing dead time as it does for reactions depicted in Figs. 6 & 7, but instead evolves over the first 50 to 100 ms. If the open versus closed nNOSred species could not interconvert, or could only interconvert slowly relative to this timeframe, then this method could report on the KeqA set point and the effect of bound NADPH, because under these circumstances the measured exponential rates would be directly proportional to the concentration of open nNOSred that is present at time of mixing. This has, in fact, been the historical assumption. However, our more recent work [20,43] clearly shows that these kinetic conditions do not exist for nNOSred. Specifically, the 50 to 100 ms timeframes provide ample time for nNOSred to interconvert between its conformers (i.e., an opening of the closed reduced form, and the closing of the reacted open form), and even allow some time for inter-flavin electron transfer to regenerate some FMNhq from FMNsq. This means that kinetic traces collected under this former experimental condition actually represent a blend of rates that reflect the amount of open reactive nNOSred that is present at the time of mixing, plus an evolving and complex combination of rates for other processes that generate more of the open, reactive form of nNOSred during the timeframe of measurement. This complexity means that the formal experimental method cannot determine how bound NADPH may impact the KeqA setpoint of nNOSred, and also means that the previous conclusions regarding a strong NADPH effect on KeqA setpoint need to be reconsidered. In our current study, NADPH had little effect on KeqA in WT-nNOSred, and only appeared to stabilize the closed conformation to a modest extent in the three mutant enzymes that we examined.
On the other hand, we found that bound NADPH exerted a strong repressive kinetic effect on electron flux out of the fully-reduced WT-nNOSred and the mutant enzymes. Bound NADPH greatly repressed the rates of the first and subsequent electron transfer events out of the enzyme in all cases (see Fig. 7). This suggests that bound NADPH predominantly exerts a kinetic effect. Based on our findings, we speculate that bound NADPH must retard the switching rates between the open and closed nNOSred conformers (without altering the KeqA setpoint much), and/or retard the rate of interflavin electron transfer. This shifts the current paradigm regarding how NADPH is thought to influence nNOSred conformational aspects related to electron flux, away from a predominant effect on KeqA setpoint and toward an effect on the conformational switching kinetics. These possibilities should now be explored. For our current study, we can conclude that the inter-domain charge pairing interactions of Glu762, Glu816, and Glu819 do not significantly influence the conformational response of nNOSred to bound NADPH. This makes sense, given their remote location from the nNOSred structural features that sense bound NADPH [24,25] and help transduce its effects [9].
Faster Electron Import and Flavin Reduction
The CaM-free mutants all had faster rates of NADPH-dependent flavin reduction compared to WT-nNOSred (Table 1). This implies that much like CaM, the mutations eased the kinetic repression on electron import that is normally present in CaM-free nNOS [22,45]. Rate increases in the mutants were clearly evident in the first and second phases of flavin reduction, which would encompass the first hydride transfer from NADPH to FAD and the interflavin (FADH2 to FMN) electron transfer steps [7,19,24,40,44], and also include a portion of subsequent steps including NADP+ dissociation, binding of a second molecule of NADPH, a second hydride transfer to FAD, and additional interflavin electron transfers. It is interesting to consider how the charge pairing interactions of these residues, located on the FMN domain, might “remotely” retard electron import from NADPH into nNOSred. Adak et al [41] first showed that the kinetic inhibition on electron import into CaM-free nNOS requires an intact FMN domain, and this was subsequently confirmed in studies with nNOS constructs with deleted FMN domains [44,48,49]. One possible explanation that is most consistent with our current data comes from work by Daff and colleagues [50], who proposed that the hydride transfer from NADPH to FAD requires that nNOSred be in its open conformation. They suggested that the first (fastest) phase of flavin reduction involves the portion of enzyme molecules that are already in the open conformation, while the second phase of flavin reduction involved the remaining enzyme molecules that are in the closed conformation and reflected the rate by which they transition to the open state. Thus, their model has the open state supporting two distinct kinetic steps, namely, facilitating hydride transfer from NADPH to FAD on one hand, and enhancing electron transfer out of the reduced nNOSred to cytochrome c, on the other [8,47]. Accordingly, these concepts suggest that the faster flavin reduction rates we observed in our mutants reflect their higher KeqA setpoints, and perhaps more importantly, reflect their faster rates of conformational switching between the closed and open states. A faster rate of conformational switching would also facilitate the interflavin electron transfer between FAD and FMN, and thus further explain why the mutants have faster second phase rates of flavin reduction. Although consistent with our current data, definitive testing of these concepts will require a more direct measure of the conformational switching rates, which is probably achievable only at the single molecule level. In any case, our current results highlight how interdomain charge pairing interactions can regulate both electron import and export in the nNOSred.
Increased O2 reactivity of the flavins
Some of the single mutants, and particularly the triple mutant, showed increased reactivity with dioxygen that in some cases was associated with a kinetic destabilization of the FMN semiquinone. This may reflect an increased access of dioxygen and/or disruption of protective mechanisms that NOS and other dual-flavin enzymes use to shield their reduced flavins from auto-oxidation. Such changes diminish the fidelity of electron transfer through the mutant reductase domains to cytochrome c or to the NOS heme domain, and result in greater production of reduced oxygen species.
Summary and concluding remarks
Our findings support a model where electron flux through nNOSred is governed primarily by protein conformational aspects. Our data suggest that three electronegative residues on the FMN domain of nNOSred (Glu762, Glu816, and Glu819) that participate in charge-pairing interactions at the NADPH/FAD and FMN domain interface [38] help to stabilize fully-reduced nNOSred in a closed or FMN-shielded conformational state, and also help to retard the switching rates between the open and closed conformations. Their combined influence helps to repress NADPH-dependent electron flux through nNOSred when it is in the CaM-free state. CaM binding largely overrides the influence of the charge pairing interactions and allows faster electron flux through nNOSred.
Given that rates of electron loading and electron flux are improved in the mutant nNOSred proteins, one might question why the interdomain charge-pairing interactions involving Glu762, Glu816, and Glu819 were maintained in nNOS during evolution. One obvious reason is they seem to retard flavin auto-oxidation reactions, and so help to minimize production of reactive oxygen species during catalysis. Moreover, the electronegative residues might play an additional role in the full-length nNOS to help the FMN domain achieve a productive electrostatic interaction with the NOSoxy domain for electron transfer to the heme, as indicated by structural analysis and computer docking studies [39]. In this way, the charge-pairing interactions may allow a sufficient and coupled electron flux while still enabling the FMN domain to interact with both its electron-donating and electron-accepting partner domains during catalysis.
Supplementary Material
Acknowledgments
FUNDING
This work was supported by National Institutes of Health Grants GM51491 and HL58883 to D.J.S.
Authors are thankful to Dr. Jesus Tejero for his help in making crystal structure figure.
ABBREVIATIONS
- NO
Nitric oxide
- NOS
Nitric oxide synthase
- eNOS
endothelial nitric oxide synthase
- iNOS
inducible nitric oxide synthase
- nNOS
neuronal nitric oxide synthase
- nNOSred
reductase domain of nNOS
- nNOSoxy
oxygenase domain of nNOS
- CPR
cytochrome P450 reductase
- MSR
methionine synthase reductase
- NR1
novel reductase 1
- L-Arg
L-arginine
- FMN
flavin mononucleotide
- FAD
flavin adenine dinucleotide
- FNR
ferredoxin NADP-reductase
- CaM
calmodulin
- EPPS
4-(2-hydroxyethyl)-1-piperazinepropanesulfonic acid
- IPTG
Isopropyl β-D-thiogalactopyranoside
- DTT
Dithiothreitol
- SOD
superoxide dismutase
- NADPH
nicotinamide adenine dinucleotide phosphate
- FMNhq or FMNH2
FMN hydroquinone
- FMNsq or FMNH•
FMN semiquinone
- FADH2
FAD hydroquinone
- WT
wild-type
- Triple mutant
E762-E816R-E819R nNOSred
Reference List
- 1.Knott AB, Bossy-Wetzel E. Nitric oxide in health and disease of the nervous system. Antioxid Redox Signal. 2009;11:541–554. doi: 10.1089/ars.2008.2234. [DOI] [PMC free article] [PubMed] [Google Scholar]
- 2.Furchgott RF. Endothelium-derived relaxing factor: discovery, early studies, and identification as nitric oxide. Biosci Rep. 1999;19:235–251. doi: 10.1023/a:1020537506008. [DOI] [PubMed] [Google Scholar]
- 3.Stuehr DJ. Mammalian nitric oxide synthases. Biochim Biophys Acta. 1999;1411:217–230. doi: 10.1016/s0005-2728(99)00016-x. [DOI] [PubMed] [Google Scholar]
- 4.Li H, Poulos TL. Structure-function studies on nitric oxide synthases. J Inorg Biochem. 2005;99:293–305. doi: 10.1016/j.jinorgbio.2004.10.016. [DOI] [PubMed] [Google Scholar]
- 5.Crane BR, Arvai AS, Ghosh DK, Wu C, Getzoff ED, Stuehr DJ, Tainer JA. Structure of nitric oxide synthase oxygenase dimer with pterin and substrate. Science. 1998;279:2121–2126. doi: 10.1126/science.279.5359.2121. [DOI] [PubMed] [Google Scholar]
- 6.Garcin ED, Bruns CM, Lloyd SJ, Hosfield DJ, Tiso M, Gachhui R, Stuehr DJ, Tainer JA, Getzoff ED. Structural basis for isozyme-specific regulation of electron transfer in nitric-oxide synthase. J Biol Chem. 2004;279:37918–37927. doi: 10.1074/jbc.M406204200. [DOI] [PubMed] [Google Scholar]
- 7.Guan ZW, Haque MM, Wei CC, Garcin ED, Getzoff ED, Stuehr DJ. Lys842 in neuronal nitric-oxide synthase enables the autoinhibitory insert to antagonize calmodulin binding, increase FMN shielding, and suppress interflavin electron transfer. J Biol Chem. 2010;285:3064–3075. doi: 10.1074/jbc.M109.000810. [DOI] [PMC free article] [PubMed] [Google Scholar]
- 8.Stuehr DJ, Tejero J, Haque MM. Structural and mechanistic aspects of flavoproteins: electron transfer through the nitric oxide synthase flavoprotein domain. FEBS J. 2009;276:3959–3974. doi: 10.1111/j.1742-4658.2009.07120.x. [DOI] [PMC free article] [PubMed] [Google Scholar]
- 9.Tiso M, Tejero J, Panda K, Aulak KS, Stuehr DJ. Versatile regulation of neuronal nitric oxide synthase by specific regions of its C-terminal tail. Biochemistry. 2007;46:14418–14428. doi: 10.1021/bi701646k. [DOI] [PubMed] [Google Scholar]
- 10.Eschenbrenner M, Coves J, Fontecave M. The flavin reductase activity of the flavoprotein component of sulfite reductase from Escherichia coli. A new model for the protein structure. J Biol Chem. 1995;270:20550–20555. doi: 10.1074/jbc.270.35.20550. [DOI] [PubMed] [Google Scholar]
- 11.Finn RD, Basran J, Roitel O, Wolf CR, Munro AW, Paine MJ, Scrutton NS. Determination of the redox potentials and electron transfer properties of the FAD- and FMN-binding domains of the human oxidoreductase NR1. Eur J Biochem. 2003;270:1164–1175. doi: 10.1046/j.1432-1033.2003.03474.x. [DOI] [PubMed] [Google Scholar]
- 12.Munro AW, Leys DG, McLean KJ, Marshall KR, Ost TW, Daff S, Miles CS, Chapman SK, Lysek DA, Moser CC, Page CC, Dutton PL. P450 BM3: the very model of a modern flavocytochrome. Trends Biochem Sci. 2002;27:250–257. doi: 10.1016/s0968-0004(02)02086-8. [DOI] [PubMed] [Google Scholar]
- 13.Wolthers KR, Scrutton NS. Protein interactions in the human methionine synthase-methionine synthase reductase complex and implications for the mechanism of enzyme reactivation. Biochemistry. 2007;46:6696–6709. doi: 10.1021/bi700339v. [DOI] [PubMed] [Google Scholar]
- 14.Zeghouf M, Fontecave M, Coves J. A simplifed functional version of the Escherichia coli sulfite reductase. J Biol Chem. 2000;275:37651–37656. doi: 10.1074/jbc.M005619200. [DOI] [PubMed] [Google Scholar]
- 15.Zhang J, Martasek P, Paschke R, Shea T, Masters BSS, Kim JJ. Crystal structure of the FAD/NADPH-binding domain of rat neuronal nitric-oxide synthase. Comparisons with NADPH-cytochrome P450 oxidoreductase. J Biol Chem. 2001;276:37506–37513. doi: 10.1074/jbc.M105503200. [DOI] [PubMed] [Google Scholar]
- 16.Siddhanta U, Presta A, Fan B, Wolan D, Rousseau DL, Stuehr DJ. Domain swapping in inducible nitric-oxide synthase. Electron transfer occurs between flavin and heme groups located on adjacent subunits in the dimer. J Biol Chem. 1998;273:18950–18958. doi: 10.1074/jbc.273.30.18950. [DOI] [PubMed] [Google Scholar]
- 17.Wei CC, Crane BR, Stuehr DJ. Tetrahydrobiopterin radical enzymology. Chem Rev. 2003;103:2365–2383. doi: 10.1021/cr0204350. [DOI] [PubMed] [Google Scholar]
- 18.Klatt P, Heinzel B, John M, Kastner M, Bohme E, Mayer B. Ca2+/calmodulin-dependent cytochrome c reductase activity of brain nitric oxide synthase. J Biol Chem. 1992;267:11374–11378. [PubMed] [Google Scholar]
- 19.Craig DH, Chapman SK, Daff S. Calmodulin activates electron transfer through neuronal nitric-oxide synthase reductase domain by releasing an NADPH-dependent conformational lock. J Biol Chem. 2002;277:33987–33994. doi: 10.1074/jbc.M203118200. [DOI] [PubMed] [Google Scholar]
- 20.Ilagan RP, Tiso M, Konas DW, Hemann C, Durra D, Hille R, Stuehr DJ. Differences in a conformational equilibrium distinguish catalysis by the endothelial and neuronal nitric-oxide synthase flavoproteins. J Biol Chem. 2008;283:19603–19615. doi: 10.1074/jbc.M802914200. [DOI] [PMC free article] [PubMed] [Google Scholar]
- 21.Ilagan RP, Tejero J, Aulak KS, Ray SS, Hemann C, Wang ZQ, Gangoda M, Zweier JL, Stuehr DJ. Regulation of FMN subdomain interactions and function in neuronal nitric oxide synthase. Biochemistry. 2009;48:3864–3876. doi: 10.1021/bi8021087. [DOI] [PMC free article] [PubMed] [Google Scholar]
- 22.Welland A, Garnaud PE, Kitamura M, Miles CS, Daff S. Importance of the domain-domain interface to the catalytic action of the NO synthase reductase domain. Biochemistry. 2008;47:9771–9780. doi: 10.1021/bi800787m. [DOI] [PubMed] [Google Scholar]
- 23.Feng C. Mechanism of Nitric Oxide Synthase Regulation: Electron Transfer and Interdomain Interactions. Coord Chem Rev. 2012;256:393–411. doi: 10.1016/j.ccr.2011.10.011. [DOI] [PMC free article] [PubMed] [Google Scholar]
- 24.Konas DW, Zhu K, Sharma M, Aulak KS, Brudvig GW, Stuehr DJ. The FAD-shielding residue Phe1395 regulates neuronal nitric-oxide synthase catalysis by controlling NADP+ affinity and a conformational equilibrium within the flavoprotein domain. J Biol Chem. 2004;279:35412–35425. doi: 10.1074/jbc.M400872200. [DOI] [PubMed] [Google Scholar]
- 25.Tiso M, Konas DW, Panda K, Garcin ED, Sharma M, Getzoff ED, Stuehr DJ. C-terminal tail residue Arg1400 enables NADPH to regulate electron transfer in neuronal nitric-oxide synthase. J Biol Chem. 2005;280:39208–39219. doi: 10.1074/jbc.M507775200. [DOI] [PubMed] [Google Scholar]
- 26.Ghosh DK, Ray K, Rogers AJ, Nahm NJ, Salerno JC. FMN fluorescence in inducible NOS constructs reveals a series of conformational states involved in the reductase catalytic cycle. FEBS J. 2012;279:1306–1317. doi: 10.1111/j.1742-4658.2012.08525.x. [DOI] [PubMed] [Google Scholar]
- 27.Daff S, Sagami I, Shimizu T. The 42-amino acid insert in the FMN domain of neuronal nitric-oxide synthase exerts control over Ca(2+)/calmodulin-dependent electron transfer. J Biol Chem. 1999;274:30589–30595. doi: 10.1074/jbc.274.43.30589. [DOI] [PubMed] [Google Scholar]
- 28.Roman LJ, Masters BS. Electron transfer by neuronal nitric oxide synthase is regulated by concerted interaction of calmodulin and two intrinsic regulatory elements. J Biol Chem. 2006;281:23111–23118. doi: 10.1074/jbc.M603671200. [DOI] [PubMed] [Google Scholar]
- 29.Lane P, Gross SS. Disabling a C-terminal autoinhibitory control element in endothelial nitric-oxide synthase by phosphorylation provides a molecular explanation for activation of vascular NO synthesis by diverse physiological stimuli. J Biol Chem. 2002;277:19087–19094. doi: 10.1074/jbc.M200258200. [DOI] [PubMed] [Google Scholar]
- 30.Roman LJ, Miller RT, de La Garza MA, Kim JJ, Masters BSS. The C terminus of mouse macrophage inducible nitric-oxide synthase attenuates electron flow through the flavin domain. J Biol Chem. 2000;275:21914–21919. doi: 10.1074/jbc.M002449200. [DOI] [PubMed] [Google Scholar]
- 31.Adak S, Santolini J, Tikunova S, Wang Q, Johnson JD, Stuehr DJ. Neuronal nitric-oxide synthase mutant (Ser-1412 --> Asp) demonstrates surprising connections between heme reduction, NO complex formation, and catalysis. J Biol Chem. 2001;276:1244–1252. doi: 10.1074/jbc.M006857200. [DOI] [PubMed] [Google Scholar]
- 32.Butt E, Bernhardt M, Smolenski A, Kotsonis P, Frohlich LG, Sickmann A, Meyer HE, Lohmann SM, Schmidt HH. Endothelial nitric-oxide synthase (type III) is activated and becomes calcium independent upon phosphorylation by cyclic nucleotide-dependent protein kinases. J Biol Chem. 2000;275:5179–5187. doi: 10.1074/jbc.275.7.5179. [DOI] [PubMed] [Google Scholar]
- 33.Dimmeler S, Fleming I, Fisslthaler B, Hermann C, Busse R, Zeiher AM. Activation of nitric oxide synthase in endothelial cells by Akt-dependent phosphorylation. Nature. 1999;399:601–605. doi: 10.1038/21224. [DOI] [PubMed] [Google Scholar]
- 34.Knudsen GM, Nishida CR, Mooney SD, Ortiz de Montellano PR. Nitric-oxide synthase (NOS) reductase domain models suggest a new control element in endothelial NOS that attenuates calmodulin-dependent activity. J Biol Chem. 2003;278:31814–31824. doi: 10.1074/jbc.M303267200. [DOI] [PubMed] [Google Scholar]
- 35.Haque MM, Panda K, Tejero J, Aulak KS, Fadlalla MA, Mustovich AT, Stuehr DJ. A connecting hinge represses the activity of endothelial nitric oxide synthase. Proc Natl Acad Sci USA. 2007;104:9254–9259. doi: 10.1073/pnas.0700332104. [DOI] [PMC free article] [PubMed] [Google Scholar]
- 36.Adak S, Sharma M, Meade AL, Stuehr DJ. A conserved flavinshielding residue regulates NO synthase electron transfer and nicotinamide coenzyme specificity. Proc Natl Acad Sci USA. 2002;99:13516–13521. doi: 10.1073/pnas.192283399. [DOI] [PMC free article] [PubMed] [Google Scholar]
- 37.Haque MM, Fadlalla M, Wang ZQ, Ray SS, Panda K, Stuehr DJ. Neutralizing a surface charge on the FMN subdomain increases the activity of neuronal nitric-oxide synthase by enhancing the oxygen reactivity of the enzyme heme-nitric oxide complex. J Biol Chem. 2009;284:19237–19247. doi: 10.1074/jbc.M109.013144. [DOI] [PMC free article] [PubMed] [Google Scholar]
- 38.Panda K, Haque MM, Garcin-Hosfield ED, Durra D, Getzoff ED, Stuehr DJ. Surface charge interactions of the FMN module govern catalysis by nitric-oxide synthase. J Biol Chem. 2006;281:36819–36827. doi: 10.1074/jbc.M606129200. [DOI] [PubMed] [Google Scholar]
- 39.Tejero J, Hannibal L, Mustovich A, Stuehr DJ. Surface charges and regulation of FMN to heme electron transfer in nitric-oxide synthase. J Biol Chem. 2010;285:27232–27240. doi: 10.1074/jbc.M110.138842. [DOI] [PMC free article] [PubMed] [Google Scholar]
- 40.Matsuda H, Iyanagi T. Calmodulin activates intramolecular electron transfer between the two flavins of neuronal nitric oxide synthase flavin domain. Biochim Biophys Acta. 1999;1473:345–355. doi: 10.1016/s0304-4165(99)00193-2. [DOI] [PubMed] [Google Scholar]
- 41.Adak S, Ghosh S, Abu-Soud HM, Stuehr DJ. Role of reductase domain cluster 1 acidic residues in neuronal nitric-oxide synthase. Characterization of the FMN-FREE enzyme. J Biol Chem. 1999;274:22313–22320. doi: 10.1074/jbc.274.32.22313. [DOI] [PubMed] [Google Scholar]
- 42.Mendes P. GEPASI: a software package for modelling the dynamics, steady states and control of biochemical and other systems. Comput Appl Biosci. 1993;9:563–571. doi: 10.1093/bioinformatics/9.5.563. [DOI] [PubMed] [Google Scholar]
- 43.Haque MM, Kenney C, Tejero J, Stuehr DJ. A kinetic model linking protein conformational motions, interflavin electron transfer and electron flux through a dual-flavin enzyme-simulating the reductase activity of the endothelial and neuronal nitric oxide synthase flavoprotein domains. FEBS J. 2011;278:4055–4069. doi: 10.1111/j.1742-4658.2011.08310.x. [DOI] [PMC free article] [PubMed] [Google Scholar]
- 44.Guan ZW, Iyanagi T. Electron transfer is activated by calmodulin in the flavin domain of human neuronal nitric oxide synthase. Arch Biochem Biophys. 2003;412:65–76. doi: 10.1016/s0003-9861(03)00009-2. [DOI] [PubMed] [Google Scholar]
- 45.Gachhui R, Presta A, Bentley DF, Abu-Soud HM, McArthur R, Brudvig G, Ghosh DK, Stuehr DJ. Characterization of the reductase domain of rat neuronal nitric oxide synthase generated in the methylotrophic yeast Pichia pastoris. Calmodulin response is complete within the reductase domain itself. J Biol Chem. 1996;271:20594–20602. doi: 10.1074/jbc.271.34.20594. [DOI] [PubMed] [Google Scholar]
- 46.Knight K, Scrutton NS. Stopped-flow kinetic studies of electron transfer in the reductase domain of neuronal nitric oxide synthase: re-evaluation of the kinetic mechanism reveals new enzyme intermediates and variation with cytochrome P450 reductase. Biochem J. 2002;367:19–30. doi: 10.1042/BJ20020667. [DOI] [PMC free article] [PubMed] [Google Scholar]
- 47.Daff S. NO synthase: structures and mechanisms. Nitric Oxide. 2010;23:1–11. doi: 10.1016/j.niox.2010.03.001. [DOI] [PubMed] [Google Scholar]
- 48.Dunford AJ, Marshall KR, Munro AW, Scrutton NS. Thermodynamic and kinetic analysis of the isolated FAD domain of rat neuronal nitric oxide synthase altered in the region of the FAD shielding residue Phe1395. Eur J Biochem. 2004;271:2548–2560. doi: 10.1111/j.1432-1033.2004.04185.x. [DOI] [PubMed] [Google Scholar]
- 49.Konas DW, Takaya N, Sharma M, Stuehr DJ. Role of Asp(1393) in catalysis, flavin reduction, NADP(H) binding, FAD thermodynamics, and regulation of the nNOS flavoprotein. Biochemistry. 2006;45:12596–12609. doi: 10.1021/bi061011t. [DOI] [PubMed] [Google Scholar]
- 50.Welland A, Daff S. Conformation-dependent hydride transfer in neuronal nitric oxide synthase reductase domain. FEBS J. 2010;277:3833–3843. doi: 10.1111/j.1742-4658.2010.07787.x. [DOI] [PubMed] [Google Scholar]
Associated Data
This section collects any data citations, data availability statements, or supplementary materials included in this article.