

Abstract
In an effort to relate RNA folding to function under cellular-like conditions, we monitored the self-cleavage reaction of the human hepatitis delta virus (HDV)-like CPEB3 ribozyme in the background of physiological ionic concentrations and various crowding and cosolute agents. We found that under physiological free Mg2+ concentrations (~0.1 to 0.5 mM Mg2+), both crowders and cosolutes stimulate the rate of self-cleavage, up to ~6-fold, but that in 10 mM Mg2+—conditions widely used for in vitro ribozyme studies—these same additives have virtually no effect on self-cleavage rate. We further observe a dependence of self-cleavage rate on crowder size, wherein rate stimulation is diminished for crowders larger than the size of the unfolded RNA. Monitoring effects of crowding and cosolute agents on rates in biological amounts of urea revealed additive-promoted increases in both low and high Mg2+ concentrations, with a maximal stimulation of more than 10-fold and a rescue of the rate to its urea-free values. Small-angle X-ray scattering (SAXS) experiments reveal a structural basis for this stimulation in that higher molecular weight crowding agents favor a more compact form of the ribozyme in 0.5 mM Mg2+ that is essentially equivalent to the form under standard ribozyme conditions of 10 mM Mg2+ and no crowder. This finding suggests that at least a portion of the rate enhancement arises from favoring the native RNA tertiary structure. We conclude that cellular-like crowding supports ribozyme reactivity by favoring a compact form of the ribozyme, but only under physiological ionic and cosolute conditions.
Introduction
An overarching question in biological catalysis is whether and how cellular conditions act to facilitate function. Two key features of cells that differ from dilute solution are compartmentalization of biomolecules and the presence of molecular crowding and cosolute agents. We recently demonstrated that compartmentalization of RNA in aqueous phase compartments can improve ribozyme catalysis by nearly 100-fold.1 However, the extent to which molecular crowding and cosolutes affect catalysis remains unclear.
Up to 20–30% of the cellular volume in eukaryotic and prokaryotic cells is occupied by biopolymers, which provide crowded conditions that can affect RNA structure and function.2–6 These high molecular weight crowding agents exclude volume, alter solvent properties, and in some cases, have weak interactions with nucleic acids. In addition, low molecular weight cosolutes such as NTPs7, amino acids8, and metabolites9 are present in tens of millimolar concentrations in the cell. These species can have strong interactions with nucleic acids as well as alter solvent properties.10–13 Molecular crowders profoundly alter the thermodynamic and kinetic properties of biological macromolecules.2 For example, physiological reaction rates and equilibria can differ from those in dilute buffers by orders of magnitude.3
Studies analyzing proteins revealed that protein stability, association rates, secondary structure folding, compaction and function can be substantially impacted in the presence of macromolecular crowders10,14,15 For instance, kinetic studies on the monomeric protein enzyme EntC revealed that macromolecular crowders increase enzymatic activity through potential conformational and structural changes.16 Futhermore, protein folding studies on ribonuclease A uncovered that macromolecular crowding agents PEG20000 and Ficoll70 restore compaction of the native state in the presence of chemical denaturant.17 We note that effects in these cases are moderate, with only 1.2- to 2.5-fold effects on kcat. The above studies provide significant insight into protein behavior in cellular conditions, however parallel studies on RNA are much more limited.
Recently, several studies of ribozyme folding and catalysis in the presence of crowder and cosolute additives have been conducted.4,6,18,19 Such additives include higher molecular weight polymers such as PEG1000, PEG8000, Dextran10 and Dextran70, which have average MW of 1 kDa, 8 kDa, 10 kDa and 70 kDa, respectively, which serve as crowders, as well as lower molecular weight species such as urea, proline, betaine, sugars, glycerol, and PEG200, which serve as cosolutes or osmolytes.20,21 While the above studies have provided insight into RNA function, thermodynamics, and compaction in the presence of such cellular additives, no study to date has linked ribozyme catalysis to molecular structure under cellular-like conditions, nor have they examined a human ribozyme.
An attractive RNA for studying the effects of crowding on catalysis is the self-cleaving human HDV-like CPEB3 ribozyme. This ribozyme is structurally similar to the HDV ribozyme, with a double-pseudoknotted structure having five pairings. However, a few differences are found between these two RNAs.22 One distinction is that the CPEB3 ribozyme contains a weakened P1.1 pairing that is comprised of just a single GC Watson-Crick base pair (Figure 1), as opposed to the two GC base pairs found in the HDV ribozyme.22 We previously demonstrated that this weakened P1.1 pairing leads the CPEB3 ribozyme to switch between the native state and a misfolded state incapable of catalysis.23 In addition, several residues in the CPEB3 ribozyme are single stranded in the native state and so are likely mobile (Figure 1). Since macromolecular crowding generally shifts the equilibrium of large biomolecules towards compact structures, we reasoned that the CPEB3 ribozyme might show improved kinetic activity in the presence of crowding agents.
Figure 1. Secondary structure of WT CPEB3 ribozyme.

The pairings (P1, P2, P3, P4, and P1.1) of the ribozyme are represented by blue, green, yellow, orange, and purple respectively. Shown is precursor −8/68 WT human RNA, where nucleotides upstream of the cleavage site (−8/−1) are represented in teal.
Herein, we demonstrate that crowding and cosolute agents stimulate human ribozyme kinetics in physiological magnesium concentrations, but not high magnesium concentrations. In addition, we show that crowding and cosolute agents protect as well as refold the RNA in the presence of a denaturant. SAXS studies reveal that under physiological magnesium concentrations larger molecular weight crowders act to appreciably compact the RNA, while stabilizing cosolute has relatively little effect on the global structure.
Materials and Methods
RNA Preparation
Following are the sequences of the CPEB3 WT and C-2A mutant pre-cleaved ribozymes used in this study. Sequence upstream of the cleavage site is in lowercase font, and the mutated nucleotide (nt) is shown in red.
| WT (76 nt) | 5′ggauaacaGGGGGCCACAGCAGAAGCGUUCACGUCGCAGCCCCUGUCAGAUUCUGGUGAAUCUGCGAAUUCUGCUG |
| C-2A (76 nt) |
|
For RNA transcribed for kinetics studies, the following procedure was used to isolate full length pre-cleaved (−8/68) RNA. Both the WT and C-2A mutant were transcribed from linearized plasmid (Bsa I-digested) DNA using a modified transcription procedure to limit self-cleavage during the transcription process and this procedure was followed without modification.23 Specifically, to prepare uncleaved RNA for kinetic reactions, transcriptions were performed at a reduced temperature of 23°C and for only 2 h. The WT and C-2A CPEB3 ribozymes were transcribed in the presence of [γ-32P]GTP to 5′-end label the RNA. This procedure eliminates the need for dephosphorylation and end-labeling steps that lead to extensive self-cleavage during these steps. Labeled full length pre-cleaved RNA was gel purified and precipitated for use in kinetics experiments.
The following procedure was used to isolate large amounts of fully cleaved (1/68) RNA for SAX experiments. The WT CPEB3 RNA was transcribed from linearized plasmid DNA at 37 °C for 4 h—a higher temperature and longer time to promote both enhanced transcription yields and extent of cleavage during transcription. At this point, negligible full-length RNA was present, as most had cleaved during transcription. The cleaved ribozyme was purified by denaturing PAGE and precipitated. RNA was then buffer exchanged using an Amicon Ultra centrifugal filter (MWCO 3 kDa) in either 25 mM HEPES (pH 8)/100 mM KCl/0.5 mM MgCl2 or 25 mM HEPES (pH 8)/100 mM KCl/10 mM MgCl2. PEG200 and PEG8000 stock solutions were prepared in the same buffer so as to not dilute the buffer or salt concentrations.
Cleavage Experiments and Data Fitting
For each reaction, ~2nM [γ-32P]GTP of 5′-end labeled RNA was renatured at 90 °C for 3 min in 1xTE and allowed to cool to room temperature for 10 min. Reaction buffer consisted of 25 mM HEPES (pH 8), 100 mM KCl, and varying Mg2+ concentrations. Buffers were prepared using ultra-purified deionized water and filtered using 0.5 μm filters. Crowding and cosolute agents were added before Mg2+ unless otherwise noted. PEG200, Dextran10, Dextran40, Dextran70, and Ficoll70 were from Sigma-Aldrich (St. Louis, MO) and PEG8000 (average molecular weight 8 kDa) was from Research Organics (Cleveland, OH), and used within the first 3–4 months of opening without further purification. Concentration of additives is in % w/v unless otherwise noted. Reactions were initiated by the addition of Mg2+. Time points were removed and added to an equal volume of 95% formamide loading buffer with 0.1 M EDTA and immediately placed on dry ice. Aliquots were fractionated on a denaturing 10% PAGE gel and dried. Gels were visualized using a PhosphorImager and analyzed using ImageQuant software (Molecular Dynamics).
Plots of fraction product versus time were generated and fit to a single exponential equation (Equation 1),
| (1) |
where fc is the fraction of precursor substrate cleaved, kobs is the observed first-order rate constant, t is time, A is the fraction of substrate cleaved at completion, and −B is the amplitude of the observable phase. All kinetic parameters were obtained using least-squares fitting by KaleidaGraph (Synergy Software). Kinetic traces that gave 20% or less reaction after 2 h were fit to a linear equation. Each data point was the average of at least two trials ± standard deviation of the experiments. In plots that contain “fold-stimulation” the error on the plot is propagated from the errors in the compared conditions.
Model of Human CPEB3 Ribozyme
The crystal structure of the HDV ribozyme deposited in the protein data bank (PDB code 3NKB) was used as the starting point for building a model of the human CPEB3 ribozyme using COOT software.24 The bases were mutated from the HDV to the human CPEB3 ribozyme sequence, and base pairing in the P1, P1.1, P2, P3 and P4 was maintained. Of special note, the GC base pair at the base of P1.1 in the HDV ribozyme was changed to a U•U wobble pair, the ‘GCA’ stretch under P1.1 was deleted, and P4 was stacked onto the U•U wobble. Other key interactions were maintained, including the G•U wobble at the base of P1, the reverse G•U wobble at the base of P3, the stacking of P1/P1.1/P4, the stacking of P2/P3, and the interaction of the N3 of C57 with the 5′OH of G1. The UGGU loop modeled at the base of P4 was identified using COSSMOS software.25 The resulting coordinates were subjected to energy minimization using the online YASARA server.26 The energy-minimized model was re-checked for known tertiary interactions and used as the monomer model for fitting with the SAXS data.
SAXS Data Collection
Cleaved (1/68) CPEB3 ribozyme was prepared as described above and used for SAXS analysis. To test for aggregation, three concentrations of the RNA—0.2, 0.4, and 0.6 mg/ml—were prepared at both 0.5 mM and 10 mM Mg2+, with and without the 20% PEG200 and PEG8000. Dextran was not used because it is known to be a strong scatterer. RNA was renatured at 55 °C for 3 min and allowed to cool to room temperature for 10 min after addition of cosolute (buffer alone sample was also renatured). The RNA solution was centrifuged at 14k rpm for 10 min prior to data collection in order to degas and remove any dust. Initial SAXS data were collected on CHESS beamline F2 at 9.881 keV (1.2563 Å, the tantalum edge). The X-ray beam was collimated to 250 × 250 μm2 area and centered on a 2 mm diameter vertical quartz capillary tube with 10 μm thick walls (Hampton Research, Aliso Viejo, CA). To eliminate air scatter, the capillary tube and full X-ray flight path, including beam-stop, were kept in vacuo. Sample plugs of approximately 25–30 μl were delivered from a 96-well plate to the capillary using a Hudson SOLO single-channel pipetting robot (Hudon Robotics Inc. Springfield, New Jersey). A computer-controlled syringe pump (Aurora Biomed, Vancouver, B.C., Canada) was used to keep the sample liquid oscillating in the X-ray beam in order to reduce radiation damage. Fifteen scattering images were collected on a Quantum 1 CCD detector (Area Detector Systems Corporation, Poway, CA) with sequential 180-second exposures, to assess possible radiation damage. No radiation damage was detected in the RNA solutions, as multiple scans of the same sample provided similar scattering. Sample-to-detector distance was calibrated using silver behenate powder (The Gem Dugout, State College, PA).
Solution scattering images were reduced to profiles and buffer-subtracted using the BioXTAS RAW software.27 Scaling of the scattering curves in the presence of PEG200 and PEG8000 was conducted since macromolecule contrast decreases in the presence of PEG.28 Therefore, scattering profiles obtained in the presence of PEG200 and PEG8000 were scaled to buffer-only profiles. While the useful q-space range q = 4πsin(θl)/λ (with 2θ being the scattering angle) was determined on a case-by-case basis using the Guinier plot as a guide, it was generally the case that qmin= 0.02 Å−1 and qmax= 0.25 Å−1.
SAXS data at 10 mM Mg2+ in the absence of additive was contaminated by residual aggregates therefore we performed size-exclusion chromatography of annealed RNA samples immediately prior to SAXS at the SIBYLS beamline.29,30 Briefly, RNA samples were annealed at either 0.1 or 1 mg/mL as described above in buffer containing 10 mM MgCl2 and concentrated to 5 mg/mL. Then, 50 μL samples were injected onto a Shodex KW402.4 4.2 mL column in buffer pre-equilibrated with 25 mM HEPES (pH 8), 100 mM KCl and 10 mM MgCl2, and a peak fraction corresponding to ~1 mg/mL (40 to 60 uL) was taken for SAXS analysis as previously described30 with two exposures at 0.5 and 1 second.
SAXS Data Analysis
SAXS data were initially collected on RNA solutions at the above three different concentrations to determine the extent of inter-particle interference and concentration effects. Six solution conditions were tested: buffer alone, 20% PEG200, and 20% PEG8000 each in 0.5 and 10 mM Mg2+. For SAXS data analysis, scattering data at 0.6 mg/mL [RNA] were used for generation of the plots described below in 0.5 mM Mg2+ because the sample was monodisperse and this concentration showed increased signal to noise. In 10 mM Mg2+, data collected in the presence of PEG8000 were at 0.4 mg/mL [RNA], while data in the absence of crowder were collected subsequent to size-exclusion chromatography (SEC) as described above. Radius of gyration (Rg) was calculated using both the method of Guinier31 and the inverse Fourier transform (IFT) method as implemented in the GNOM program (Table 1).32 In the Guinier method, linear fitting was performed on data having a range of qRg<1.3. Interactive fitting was performed using the BioXTAS RAW program.27 The maximum diameter of the RNA (DMax) was determined by plotting the total estimate scores33 and χ2 on a range of DMax values using the RunGnomRun script.34 In addition, dimensionless Kratky plots were generated for 0.5 mM Mg2+ and were smoothed over ~0.01 Å−1.35
Table 1.
SAXS-determined Rg and DMax values for CPEB3 ribozyme with crowding and cosolute agents.
|
|
||||
|---|---|---|---|---|
| Rg(Guinier) (Å) | Rg(GNOM) (Å) | DMax (Å) | Excluded Volume (Å3) | |
| 0.5 mM Mg2+ | ||||
|
|
||||
| Buffer | 23.6 + 0.1 | 23.6 + 0.4 | 80 | 44,555 |
| 20% PEG200 | 26.1 + 0.5 | 25.4 ±0.5 | 87 | 45,570 |
| 20% PEG8000 | 21.3 + 0.1 | 21.8 + 0.7 | 75 | 40,544 |
|
|
||||
| 10 mM Mg2+ | ||||
|
|
||||
| Buffer | 22.0 + 0.6 | 22.6 + 0.1 | 75 | 41,280 |
| 20% PEG8000 | 19.9 + 0.7 | 20.2 ± 0.8 | 67 | 30,877 |
Model of CPEB3 ribozyme gives Rg = 20.4 Å and Dmax=73.8 Å. The 0.5 mM Mg2+ data are at 0.6 mg/mL RNA concentration, while the 10 mM Mg2+ data in 20% PEG8000 are at 0.2 mg/mL and the 10 mM Mg2+ data in buffer alone are at ~1 mg/mL immediately following size-exclusion chromatography. The SUPCOMB20 program was used to calculate the RMSD and average excluded volume.40
The experimental SAXS data were compared to the model of human CPEB3 ribozyme using the FoXS server.36,37 The program fits a given atomic structure to an experimental scattering curve optimizing particle hydration. Shape reconstructions were performed with 10 independent DAMMIF calculations38 using the ATSAS server with no symmetry conditions. The server outputs a consensus reconstruction using the DAMAVER program39 and the most probable model from DAMFILT is presented. Superposition of the DAMFILT model with the RNA model was done using the SUPCOMB20 program, which was also used to calculate the RMSD and average excluded volume.40 The superposed SAXS reconstruction envelopes and RNA models were visualized using the PYMOL software (The PyMOL Molecular Graphics System, Version 1.3, Schrödinger, LLC.).
Results
Ribozyme Reactivity is Favored by Crowding and Cosolute Agents in Low But Not High Magnesium Concentrations
We began by exploring the effects of the cosolute PEG200 and the higher molecular weight crowding agents PEG8000 and Dextran10 on CPEB3 ribozyme function. All studies were conducted on a one-piece form of the ribozyme, rather than a two-piece substrate-enzyme form, since this is the form it assumes in nature and is most likely to report biologically relevant folding. These polymers were chosen because their impacts on nucleic acid folding have been described in the literature: PEG200 is a cosolute that preferentially interacts with nucleic acids21,41 and changes the dielectric of the solution13, and PEG8000 and Dextran10 act as macromolecular crowding agents.5,41 Effects of these additives on CPEB3 ribozyme activity were studied herein under both in vivo-like free Mg2+ concentrations (0.1 and 0.5 mM) and standard in vitro Mg2+ concentrations (10 mM), both in the background of in vivo-like 100 mM KCl. Concentrations of free Mg2+ in eukaryotic cells have been estimated to range between 0.2 and 1 mM.42–45
In the presence of 10 mM Mg2+, the crowding agents and cosolute had essentially no effect on the rate (Figure 2); for instance, kobs for self-cleavage was 0.040±0.006 min−1 without additives and 0.036±0.006 min−1, 0.044±0.008 min−1, and 0.036±0.007 min−1 in the presence of 30% w/v PEG200, 30% w/v PEG8000, and 30% w/v Dextran10, respectively (Table S1). Lack of rate enhancement at high Mg2+ concentration suggests that the ribozyme may already be well folded under standard in vitro conditions, which is not surprising since these high, non-physiological Mg2+ conditions have been developed in the field for their ability to strongly promote RNA folding.
Figure 2. Stimulation of WT CPEB3 ribozyme kinetics by crowding and cosolute agents in physiological magnesium.
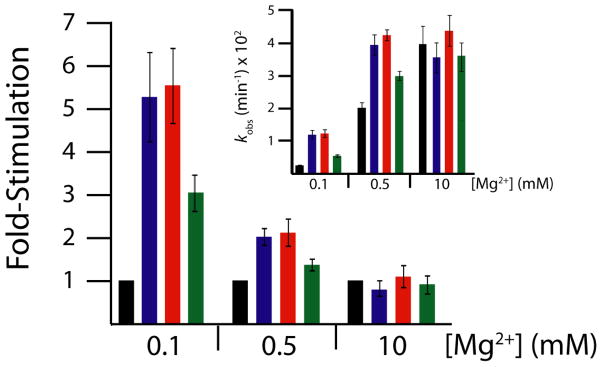
Main plot displays relative rate enhancement reported as “fold-stimulation” by comparing rate of condition with additive relative to rate of condition with buffer only (black) for each magnesium concentration, where PEG200 (blue), PEG8000 (red), and Dextran10 (green) were present at a concentration of 30% w/v. Inset: Raw self-cleavage rates of the WT CPEB3 ribozyme for the above-described conditions. Observed cleavage rate constants are provided in Table S1.
In contrast to strongly folding conditions, crowding and cosolute agents do promote the rate of the reaction in weakly folding ionic conditions of 0.5 mM Mg2+ (Figure 2). In particular, the rate of ribozyme self-cleavage is stimulated ~1.5–2.3-fold by the presence of PEG200, PEG8000, and Dextran10 (Table S1). Moreover the rates in 0.5 mM Mg2+ with additives are identical, within error, to the rates in 10 mM Mg2+. This indicates that PEG200, PEG8000, and Dextran10 reduce the Mg2+ requirement for the reaction, leading to saturation at biological Mg2+.
To see if rate enhancement from additives could be further enhanced, we determined the effect of these additives in the presence of just 0.1 mM Mg2+, which is closer to the lower estimates for physiological free Mg2+.42–45 Under these conditions, the rate increased from 0.0021±0.0003 min−1 in the absence of additives to 0.011±0.002 min−1, 0.012±0.001 min−1, and 0.007±0.001 min−1 in the presence of PEG200, PEG8000, and Dextran10, respectively, leading to overall increases in rate of 3- to 6-fold upon addition of additive (Figure 2).a It is interesting to note that these effects are substantially larger than seen for kcat in the above protein enzyme examples, which were 1.2- to 2.5-fold.16,17
Next, the dependence of rate on the concentrations of the crowding and cosolute agents was explored over the range of 10%–40% additive. As shown in Figure S1, under conditions of 0.5 mM Mg2+ the stimulation of cleavage was maximal at ~30% PEG200, 30% PEG8000, and 30% Dextran10, which remarkably is in the realm of biological crowding.3 Higher concentrations of these additives led to either no further stimulation or to inhibition. In an effort to explore the role of additives in the reaction, kinetic assays were also performed in 30% PEG200, 30% PEG8000, and 30% Dextran10 but without added Mg2+. As expected, no cleavage was observed for any of these conditions (data not shown), consistent with a requirement for a catalytic Mg2+ ion in the reaction under these conditions22,46 and confirming that the additive does not act as a Mg2+ surrogate or contain significant amounts of contaminating cations.
The effects of larger molecular weight crowders were also tested in the various magnesium concentrations. Dextran40, Dextran70, and Ficoll70, which have average MW of 40 kDa, 70 kDa, and 70 kDa, respectively, were used to determine the effects of larger molecular weight crowders on CPEB3 function. In the presence of 10 mM Mg2+, the larger molecular weight crowding agents had essentially no effect on the rate (Figure S2); for instance, kobs for self-cleavage was 0.040±0.006 min−1 without additives and 0.051±0.006 min−1, 0.044±0.008 min−1, and 0.047±0.007 min−1 in the presence of 30% w/v Dextran40, 30% w/v Dextran70, and 30% w/v Ficoll70, respectively, consistent with results above for the crowders PEG8000 and Dextran10. However, in 0.1 and 0.5 mM Mg2+, where substantial increases in cleavage rate were gained by adding PEG8000 and Dextran10 to the cleavage reaction, the larger molecular weight crowders also had little or no stimulatory effect. For example, Dextran40 led to ~2.5- and 2-fold increases in cleavage versus buffer alone in 0.1 and 0.5 mM Mg2+, respectively, while Dextran70 and Ficoll70 led to minimal stimulatory effects of up to only 1.3-fold in 0.1 and 0.5 mM Mg2+ (Figure S2). These data reveal a clear size dependence of the stimulatory effect gained by the presence of macromolecular crowders. Given that the RNA studied here is ~22 kDa, this trend is in agreement with theoretical predictions, where crowders larger than the size of the unfolded RNA have diminishing effects on RNA stability.47
Since both crowders and cosolutes stimulated the cleavage reaction, we probed whether local magnesium concentrations were being influenced by interactions between the additives and magnesium. Vapor pressure osmometry was used to determine the activity of water in the presence of Mg2+, PEG200, PEG8000, and Dextran 10. The activity of water was determined as a function of 0–10 mmol/kg Mg2+ parametric in 10 and 20 % w/v additives (Figure S3). It was found that the additives and magnesium affect the activity of water independently, supporting the notion that the additives are not significantly influencing local Mg2+ concentration.
Ribozyme Reactivity is Favored by Crowding and Cosolute Agents in Low And High Magnesium Concentrations in the Presence of Urea
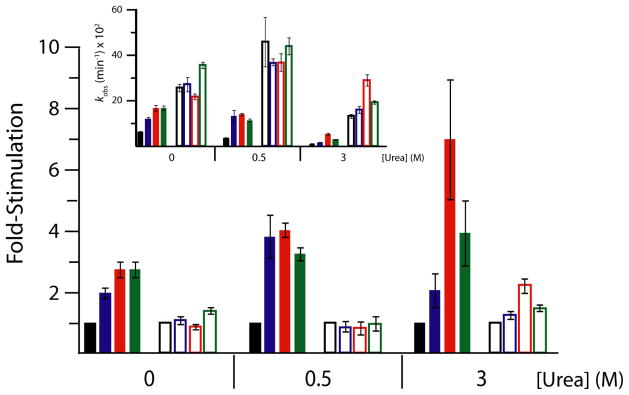
We reasoned that because the synthetic polymers rescued ribozyme activity only in weakly folding Mg2+ concentrations (0.1 and 0.5 mM Mg2+), the polymers may be acting as renaturants of RNA folding. To test this idea, we assessed whether these polymers could enhance ribozyme activity in the presence of denaturant. Urea was chosen as the denaturant for several reasons. First, it is a biologically relevant denaturant, as it can reach concentrations up to 0.6 m in certain plant and bacterial species48 and 5 m in kidney cells.49 Second, urea is known to generally denature RNA secondary and tertiary structure.20,50,51 Indeed, we found self-cleavage of the CPEB3 ribozyme to be sensitive to biological concentrations of urea (Figure S4). For example in a background of 0.5 mM Mg2+, 0.5 M urea led to ~2-fold slower cleavage, while 2.5 M urea produced 11-fold slower cleavage. In the background of 10 mM Mg2+, urea also slowed the rate, albeit with smaller, 2-fold effects (Figure 4).
Figure 4. Stimulation of WT CPEB3 ribozyme kinetics by crowding and cosolute agents in various concentrations of magnesium and urea.

Main plot displays relative rate enhancement reported as “fold-stimulation” by comparing rate of condition with additive relative to rate of condition with buffer only (black) for each Mg2+ concentration, where PEG200 (blue), PEG8000 (red), and Dextran10 (green) are present at concentrations of 30% w/v. Biological free Mg2+ (0.5 mM Mg2+, filled bars) and standard Mg2+ (10 mM Mg2+, open bars) were both used to evaluate ribozyme function in these conditions. Three urea concentrations were chosen to represent varying conditions: 0 M urea (highly folded), 0.5 M urea (denaturing), and 2.5 M urea (highly denaturing). Inset: Raw self-cleavage rates for the WT CPEB3 for the conditions described above. Observed cleavage rate constants are provided in Table S1.
To assess whether crowding and cosolute agents could act as a renaturant and to better understand the roles crowders and cosolutes might play in vivo, we tested whether part or all of the 11-fold loss of CPEB3 cleavage activity in 2.5 M urea and 0.5 mM Mg2+ could be rescued by crowding and cosolute additives. Initially, the additive was present before the urea and Mg2+. As shown in Figure 3a, each additive protected the ribozyme from the inhibitory effects of urea to some degree; for instance, the cleavage rate in 0.5 mM Mg2+ and 2.5 M urea was 0.0017±0.0005 min−1, but increased more than 10-fold to 0.018±0.001 min−1, 0.020±0.003 min−1, and 0.018±0.002 min−1 in the presence of PEG200, PEG8000, and Dextran10, respectively (Table S1, Figure 4). These rescued values are close to the urea-free rate constant of 0.019 min−1, indicating that the additives fully rescue the rate. In 2.5 M urea and 10 mM Mg2+, the additives also stimulated the rate back to urea-free values (Figure 4).
Figure 3. Self-cleavage of the WT CPEB3 ribozyme in 0.5 mM Mg2+ and 2.5 M urea with crowding and cosolute agents.
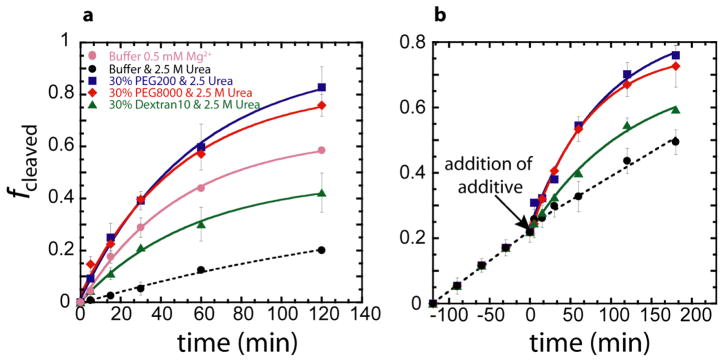
PEG200, PEG8000, and Dextan10 were present at final concentrations 30% w/v. (a) Crowding and cosolute additives are present in the reaction solution prior to simultaneous addition of urea and Mg2+. (b) Crowding and cosolute additives were added 120 min after addition of urea and Mg2+, keeping the urea and Mg2+ concentration constant throughout.
We next investigated whether the cosolute and crowding additives could refold the RNA when the destabilizing osmolyte was already present in the solution. In this case, the reaction was initiated with 0.5 mM Mg2+ in the presence of 2.5 M urea, and after 2 h the crowding or cosolute agent was added, while maintaining constant ionic strength (Figure 3b). Remarkably, crowding and cosolute agents restored catalysis to the levels observed for the first order-of-addition without any detectable lag. This finding demonstrates that under biological magnesium conditions, crowding and cosolute agents can overcome the inhibitory effects of destabilizing osmolytes, effectively acting as non-specific chaperones to promote RNA folding.
To establish the degree to which crowding and cosolute agents may aid native RNA folding in lower concentrations of urea, cleavage rates were measured in the background of just 0.5 M urea in both 0.5 and 10 mM Mg2+. In 10 mM Mg2+, 0.5 M urea had an approximately 2-fold inhibitory effect on the cleavage rate, and crowding and cosolute agents rescued this loss (Figure 4). In 0.5 mM Mg2+, 0.5 M urea also had an ~2-fold inhibitory effect on cleavage (Figure 4), but crowding and cosolute agents had up to a ~5-fold stimulatory effect restoring the rate to its values in the presence of these additives and no urea (Figure 4).
We probed whether local urea concentrations were being influenced by interactions urea using vapor pressure osmometry. The activity of water was determined in the presence of 10 and 20 % w/v PEG8000 and Dextran10 and 0–2 mol/kg urea (Figure S5). PEG200 was not used because at these concentrations the vapor pressure readings were out of the range of linearity for the instrument. We found that the additives and urea affect the activity of water in a largely independent manner.
Reactivity of the Fast-Reacting C-2A Mutant is Also Favored by Crowding and Cosolute Agents
As described above, crowding and cosolute agents stimulated wild-type CPEB3 ribozyme self-cleavage both with and without urea present (Figure 4). To test the generality of this trend, a faster cleaving mutant of the CPEB3 ribozyme termed ‘C-2A’ was transcribed, and cleavage assays were carried out in urea, Mg2+, and additive conditions identical to those described above. The C-2A change functions to destabilize a misfold termed “Alt P1” between ribozyme sequence and nucleotides upstream of the cleavage site,23 which is depicted in Scheme 1.
Scheme 1.

Despite the absence of the stable Alt P1 misfold, the C-2A ribozyme exhibited similar kinetic trends as the WT CPEB3 ribozyme in various Mg2+ and urea concentrations upon the addition of crowding and cosolute agents (Figure 5). For instance, in 0.5 mM Mg2+ 0.5 M urea again inhibited cleavage 2-fold, and additives restored the rate to values in the presence of additives and no urea. The similarity of the trends demonstrates that the stimulatory effects of the additives reflect features of the equilibrium between the intermediate and native state rather than the need to escape an alternative pairing.
Figure 5. C-2A CPEB3 ribozyme observed cleavage rates with and without crowding and cosolute agents in various concentrations of Mg2+ and urea.
Main plot displays relative rate enhancement reported as “fold-stimulation” by comparing rate of condition with additive (colored as below) relative to the condition containing only buffer (black) for each Mg2+ concentration, where PEG200 (blue), PEG8000 (red), and Dextran10 (green) are present at concentrations of 20, 40, and 40%, respectively. Biological free Mg2+ (0.5 mM Mg2+, filled bars) and standard Mg2+ (10 mM Mg2+, open bars) were both used to evaluate the difference between ribozyme function in these conditions. The three urea concentrations were chosen as described in Figure 4. Inset: Raw self-cleavage rates for the C-2A CPEB3 for the conditions described above. Observed cleavage rate values are provided in Table S1.
SAXS Studies Reveal Compaction in the Presence of Crowder
In an effort to relate the above rate-stimulatory effects of crowding and cosolute agents to RNA structure, small angle X-ray scattering (SAXS) experiments were performed. SAXS was chosen for this portion of the study because it provides information on the global structure of RNA in the presence of the polymers.4 Cleaved CPEB3 (1/68) was used in the SAXS experiments. The cleaved form is relevant to the reaction, as previous studies of the structurally similar HDV ribozyme have demonstrated that the cleaved form has a very similar fold as the pre-cleaved and captures the critical catalytic interactions.46,52
We provide the scattering profiles of the CPEB3 ribozyme in 0.5 and 10 mM Mg2+, both in 100 mM KCl in Figures 6a and S7, respectively. Data were collected in three different conditions in 0.5 mM Mg2+: buffer alone, 20% PEG200, and 20% PEG8000. In 10 mM Mg2+, data were collected for buffer alone and 20% PEG8000. These data reveal a standard decay of intensity with q, with similar but somewhat different curves for each condition. Also provided in these figures as insets are Guinier analyses, which show linearity to small q. The Guinier analyses allow us to obtain radius of gyration (Rg) values under these various conditions, which are provided Table 1.
Figure 6. SAXS scattering profiles, p(r) plots, and Kratky plots in 0.5 mM Mg2+ help describe the global folds.
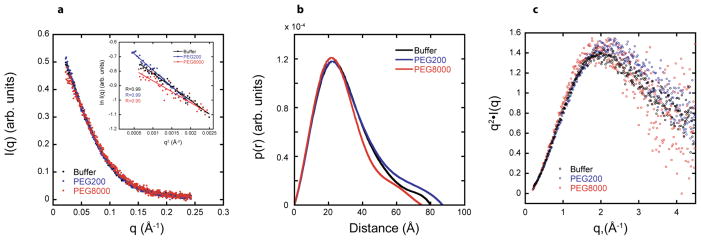
For all panels, plots are for RNA in buffer (black), buffer with 20% PEG200 (blue), and buffer with 20% PEG8000 (red). (a) Scattering profile. RNA scattering profiles in the presence of PEG200 and PEG8000 are normalized to RNA scattering profiles in buffer alone to account for differences in contrast. Rg was determined from data in the Guinier regime (qRg<1.3) (inset), and Rg values are provided in Table 1. Linear behavior extending to low q supports absence of aggregation. (b) p(r) plots. For PEG8000, the distribution is narrower and the peak is at smaller distance which is reflected in a smaller Rg. (c) Dimensionless Kratky plots. These shapes are consistent with a folded native state and absence of significant unstructured regions.
We assessed Rg values for the cleaved CPEB3 ribozyme in both 0.5 and 10 mM Mg2+. The Rg value from Guinier analysis in 0.5 mM Mg2+ and buffer is 23.6 Å. Upon adding PEG200 to 20% the Rg value increased to 26.1 Å, suggesting that PEG200 does not compact the RNA and in fact may expand it. In contrast, addition of PEG8000 to 20% decreased the Rg to a value of 21.3 Å, which suggests that the above-observed increase in rate in PEG8000 may arise from compaction of the fold. This is further bolstered by agreement with an Rg of 20.4 Å from our model of the native state (described below).
We anticipated that as Mg2+ concentration increased, a compaction of the RNA would occur, as observed by Woodson and colleagues.4 However, we found that the SAXS-derived Rg values determined in buffer and no additive increased from 23.6 Å to 28.5 Å as Mg2+ concentration increased from 0.5 to 10 mM Mg2+. These data suggest that aggregation of the sample may occur in 10 mM Mg2+ but not 0.5 mM Mg2+. Aggregation in 10 mM Mg2+ was also supported by dynamic light scattering (data not shown).
To provide an additional assay for aggregation, native gels were run using identical buffer conditions and RNA concentrations as those in the SAXS experiments at both 0.5 and 10 mM Mg2+. Native gel data are provided in Figure S6. Very low aggregation was present on native gels in 0.5 mM Mg2+ for 0.2, 0.4, or 0.6 mg/mL RNA. In contrast, appreciable aggregation was observed in native gels at 10 mM Mg2+ for all three concentrations of RNA, consistent with the larger Rg values from the SAXS experiments. Native gel lanes with trace RNA concentrations, similar to those used in kinetics experiments, showed virtually no aggregation in either Mg2+ concentrations (Figure S6).
Since aggregation of RNA was observed in 10 mM Mg2+ buffer alone samples, we used size-exclusion chromatography (SEC) to isolate a monomeric fraction for SAXS analysis. A sharp, fast mobility peak correlating to the monomeric RNA was collected and used for SAXS data collection. Analysis of this peak revealed an Rg of 22.0 Å, which shows compaction compared to the RNA in 0.5 mM Mg2+ in buffer alone (Table 1). Strikingly, the Rg of 22.0 Å for the RNA in 10 mM Mg2+ buffer alone is very similar to the Rg of 21.3 in 0.5 mM Mg2+ with 20% PEG8000.
Next, we conducted a GNOM analysis of the data. Both Rg and DMax values from GNOM analysis are provided in Table 1. We begin with analysis of 0.5 mM Mg2+ data. The Rg values from GNOM analysis are in excellent agreement with those from the Guinier analysis in 0.5 mM Mg2+. The GNOM-generated p(r) plots for 0.5 mM Mg2+ are provided in Figures 6b. For 0.5 mM Mg2+, DMax values of 80 Å, 87 Å, and 75 Å were obtained in buffer, PEG200, and PEG8000, respectively. This trend in Dmax values agrees well with the trend observed for the Rg values in 0.5 mM Mg2+. At the same time, the shape of the distribution in 20% PEG8000 and 0.5 mM Mg2+ is somewhat narrower and the maximum is at a slightly smaller distance than for PEG200 or buffer only (Figure 6b), which is reflected in the smaller Rg for PEG8000 (Table 1). Overall, these data support compaction of the ribozyme by large molecular weight crowders in 0.5 mM Mg2+.
The p(r) plots for 10 mM Mg2+ were constructed in buffer only and 20% PEG8000 and are provided in Figure S7. The Rg values from the GNOM analysis agree well with the Rg values obtained from the Guinier analysis for both the buffer alone and PEG8000 in 10 mM Mg2+. In buffer alone, the DMax value was 75 Å, which is identical to that observed for the RNA in 0.5 mM Mg2+ and PEG8000. This mirrors the similarity in Rg values for these two conditions, presented above. Introduction of 20% PEG8000 in the background of 10 mM Mg2+ leads to further compaction, to a DMax value of 67 Å. Interestingly, this further compaction does not lead to an enhancement in catalysis suggesting that it may occur outside the catalytic core (see Discussion).
Kratky plots can reveal information about the degree of folding of an RNA. For example, globular RNAs typically have Kratky plots shaped like an inverted parabola, while Kratky plots for partially unfolded RNAs do not return to baseline at large q values and can even drift upwards or show a second feature.53,54 Dimensionless Kratky plots for 0.5 mM Mg2+ are provided in Figure 6c. The Kratky plots in all conditions slope downward at high q indicating that the RNAs are folded. The peak shift for the PEG200 Kratky curve is to the right and slightly more elevated, which indicates that the RNA is less compact as compared to buffer and PEG8000, consistent with Rg and DMax values mentioned above.
SAXS Reconstructions Reveal Optimal Overlays with a Structural Model
Shape reconstruction was performed by running 10 independent DAMMIF calculations on the GNOM data.38 The individual outputs were averaged to provide a single consensus reconstruction using the DAMAVER program.39 From the consensus reconstruction, we calculated an excluded volume. The excluded volumes in 0.5 mM Mg2+ and buffer only, 20% PEG200, and 20% PEG8000 were 44,555, 45,570, and 40,544 Å3, respectively (Table 1). Clearly, the excluded volume is minimal in 20% PEG8000 indicating that this condition leads to the most compact state of the ribozyme, consistent with Rg and DMax analyses provided above. These conclusions are strengthened by consideration of the RMSD for superposing the various SAXS-generated envelopes with our model of the CPEB3 cleaved state, which revealed a value of just 2.6 Å for PEG8000, but 3.4 and 3.8 Å for buffer and PEG200, respectively.
In 10 mM Mg2+, consensus reconstructions were employed to calculate excluded volume in buffer alone and PEG8000. The excluded volumes were 41,280 and 30,877 Å3 in buffer alone and PEG8000, respectively. The excluded volume of the RNA in buffer alone agrees very well with the excluded volume in 0.5 mM Mg2+ and PEG8000. The smaller excluded volume for the RNA in 10 mM Mg2+ and PEG8000 compared to 10 mM Mg2+ in buffer alone indicates that the crowding agent leads to further compaction, consistent with Rg and DMax values above. On the basis of the above observations, we focused superposition of the reconstruction and model on the 0.5 mM Mg2+/PEG8000 and 10 mM Mg2+/buffer alone data.
Superpositions of the consensus reconstructions in 0.5 mM Mg2+/20% PEG8000 and 10 mM Mg2+/buffer alone with the model of the CPEB3 ribozyme were achieved using the SUPCOMB20 program.40 The envelope reconstructions have low MNSD of 0.33 and 0.65 in 0.5 mM Mg2+/20% PEG8000 and 10 mM Mg2+/buffer alone, respectively (Figure 7a,c). The envelope reconstruction for both sets of data has the same general shape as the native-state model and encompasses the entire model (Figure 7a,c). The native-state model fits well throughout all portions of the reconstruction without excessive empty spaces, which supports the actual RNA folding in a fashion similar to our model. This conclusion is strengthened by excellent agreement of the calculated scattering curve generated from the model and the experimental scattering curves, although there is slight deviation for the 10 mM Mg2+/buffer alone data (Figure 7b,d). In addition, we calculated Rg and DMax values of 20.4 Å and 73.8 Å, respectively, from the calculated scattering curve of the model and these values are in excellent agreement with the Rg and DMax values of 21.8 Å and 75 Å, respectively, from the GNOM analysis in 0.5 mM Mg2+/PEG8000 and Rg and DMax values of 22.6 Å and 75 Å, respectively, from the GNOM analysis in 10 mM Mg2+/buffer alone. These results further support the conclusion that the RNA has an almost identical shape and compactness in 10 mM Mg2+ buffer alone as in 0.5 mM Mg2+ supplemented with crowding agent, with slightly greater compactness in the lower Mg2+ with crowding agent. These results demonstrate that activity facilitation of the ribozyme by crowding agents comes from increased compactness.
Figure 7. Model of CPEB3 ribozyme agrees well with SAXS data.

(a,c) SAXS reconstructions in (a) 0.5 mM Mg2+ and 20% PEG8000 (pink spheres) and (c) 10 mM Mg2+ and no additive (grey spheres) superimposed on the same CPEB3 ribozyme model. The CPEB3 ribozyme model was constructed from the HDV ribozyme crystal structure and color-coded according to the secondary structure in Figure 1. (b,d) Experimental scattering data for CPEB3 ribozyme in (b) 0.5 mM Mg2+ and 20% PEG8000 and (d) 10 mM Mg2+ and no additive plotted with the calculated scattering data from native state model. The calculated scattering profile for CPEB3 model was generated using FoXS server.36,37
Discussion
The majority of the studies of structure and function in the RNA literature have been conducted under conditions of 5–10 mM and higher Mg2+, or 1 M Na+. This is because such ionic conditions tend to promote RNA folding and populate the native and functional state of a functional nucleic acid. Such behavior is of great utility for binding and enzymatic studies in riboswitches and ribozymes, and for NMR and X-ray crystallographic structural studies. Conditions in the cell are much different, however.
Concentrations of free magnesium ions in a eukaryotic cell are estimated to be only 0.2 to 1 mM42–45--concentrations that lead to much less robust RNA folding.55,56 At the same time, cells are extremely crowded owing to biopolymers and solutes such as NTPs and metabolites. The extent to which these additives influence RNA folding and function is an important one to address. In the present study, we found that crowders and cosolutes facilitate ribozyme activity, up to ~10-fold, but only in the presence of biological magnesium concentrations and denaturants. Indeed, we found that the molecular basis for the effect of the high molecular weight crowder PEG8000 is compaction of the RNA, as demonstrated by Rg, DMax, and excluded volume values are lower than in buffer alone, as well as overlay of a native-state model of the CPEB3 ribozyme and averaged SAXS reconstructions. A key result is that biological Mg2+ and crowders give rise to SAXS profiles nearly identical to those in standard literature conditions of 10 mM Mg2+. While others have shown that specific ligands can offer such compaction, such as in the case of riboswitches,57,58 the effect in our study appear to be due to general, less specific effects.
The importance of compaction is emphasized by observation that the C-2A fast-reacting version of the ribozyme, which has to populate the same native state, is also facilitated by PEG8000 and Dextran10. It thus appears that the basis for high molecular weight crowder facilitating ribozyme function is related to its ability to compact the RNA into the native state. Scheme 1 summarizes these data. Shown are three states, ‘M’, ‘I’, and ‘N’, for misfolded, intermediate, and native states. The wild-type ribozyme can populate the Alt P1 pairing, in which upstream nucleotides mispair with the P1.1-forming G37; this state is depicted as ‘M’. The C-2A mutant destabilizes Alt P1, allowing the native P1 to form, depicted as ‘I’ since further additive stimulates this state to the true ‘N’.23 Given that PEG8000 compacts the cleaved state and favors reactivity, we depict this as populating the native state, which is common to both WT and C-2A RNAs.
Moreover, this relationship offers an explanation as to why crowding does not facilitate reactivity in the background of highly folding 10 mM Mg2+ conditions, as the RNA is already well folded in this case. Consistent with this notion, if the RNA is moderately denatured in 2.5 M urea, these same additives stimulate ribozyme function in the presence of 10 mM Mg2+. Moreover, this facilitation can occur both at the start of the reaction or partway through the progress of the reaction, suggesting that crowding can act both as a protectant and a renaturant.
Notably, 10 mM Mg2+ conditions lead to a number of problems with folding of the CPEB3 ribozyme at SAXS concentrations of RNA. In particular, the ribozyme aggregates, as revealed by both native gels and the SAXS analyses. Aggregation was overcome in two ways in our study. One method we used to isolate a monomeric fraction of the RNA by SEC just prior to SAXS analysis, and a second way was through the addition of the crowding agent to the 10 mM Mg2+ sample, which also provided monomeric SAXS data. We do note that Mg2+ has reported to drive aggregation of other RNA molecules according SAXS studies.59
PEG200 stimulates the ribozyme reaction to approximately the same extent as PEG8000, however the origin of the PEG200 effect is less clear. Our data clearly show that PEG200 operates by a different mechanism than PEG8000. In particular, Rg, Dmax, and excluded volume values provide no evidence that PEG200 leads to compaction of the RNA, and in fact suggest that PEG200 may lead to a modest expansion of the RNA—a conclusion that is consistent with studies by Record and co-workers who indicated that PEG200 does not crowd the solution.41 In fact, this same study provided evidence that PEG200 directly interacts with DNA nucleotides,41 while other studies showed that PEG200 destabilizes RNA and DNA secondary structure.5 How such features drive ribozyme catalysis is not clear at present, but there has been evidence that PEG200 lowers the dielectric of the solution, which could enhance metal binding,21,41 although PEG in general does not appear to alter the activity of Mg2+.
The rate effects found in our study are similar in magnitude to those found for seminal studies on the hammerhead ribozyme by Nakano and co-workers, where 20% PEG8000 afforded an ~10-fold stimulation of the rate in 3 mM Mg2+.60 However, it is important to point out several important ways in which our study differs from theirs. First, we study a human ribozyme under conditions relevant to a eukaryotic cell. Second, we examine the effect of chemical denaturants and rescue by additives. Third, and most important, we provide a structural basis for the effects through our SAXS studies. These studies demonstrate compaction of the RNA by the additives in biological Mg2+ concentrations. Moreover, through comparison to a fast-reacting variant of the CPEB3 ribozyme, we provide evidence that our effects operate through favoring the fold of the native state.
Overall, cellular-like conditions of low ionic strength and crowding clearly influence RNA folding and thus optimal activity of functional RNAs. It may be the case that crowders will stimulate the function of many ribozymes and riboswitches and that at least part of the mechanism will involve favoring a native compact state. Furthermore, such effects are expected to be enhanced for RNAs that start off in less compact states. It will be of great interest to test the extent to which cellular conditions alter the folding and function of other RNAs.
Supplementary Material
Acknowledgments
Funding Information
This work is based upon research conducted at the Cornell High Energy Synchrotron Source (CHESS), which is supported by the National Science Foundation DMR-0936384 and the National Institutes of Health/National Institute of General Medical Sciences GM-103485. The SIBYLS beamline is supported by National Institute of General Medical Sciences project MINOS (Macromolecular INsights Optimized by Scattering) and by the United States Department of Energy program Integrated Diffraction Analysis Technologies DEAC02-05CH11231. This work was supported by NASA grant NNX13AI01G.
We thank the Penn State macromolecular X-ray crystallography core facility for the use of the dynamic light scattering instrument and Richard Gillilan for help with acquiring SAXS data. We also thank Lois Pollack, Durga Chadalavada, and Josh Blose for assistance.
Abbreviations
- CPEB3 ribozyme
cytoplasmic polyadenylation element–binding protein 3 HDV-like ribozyme
- C-2A
variant of CPEB3 ribozyme where the upstream -2 position C is mutated to an A
- Dextran10
dextran average molecular weight 10 kDa
- HDV
hepatitis delta virus
- PEG200
polyethylene glycol average molecular weight 200 Da
- PEG8000
polyethylene glycol average molecular weight 8 kDa
- SAXS
small-angle X-ray scattering
- SEC
size-exclusion chromatography
- VPO
vapor pressure osmometry
Footnotes
These effects are unlikely to be due to viscosity changes. The ribozyme reactions studied herein are single turnover and so do not depend on substrate association or product release. Moreover, the lack of effect of additives on the reaction at 10 mM Mg2+, where they change the viscosity of the solution by similar amounts as in lower Mg2+ concentrations, argues that viscosity changes play at most a minor role in the rate enhancements.
The supporting information contains additional figures and descriptions of kinetic experiments, SAXS experiments, vapor pressure osmometry, and native gel electrophoresis. This material is available free of charge via the Internet at http://pubs.acs.org.
References
- 1.Strulson CA, Molden RC, Keating CD, Bevilacqua PC. RNA catalysis through compartmentalization. Nat Chem. 2012;4:941. doi: 10.1038/nchem.1466. [DOI] [PubMed] [Google Scholar]
- 2.Minton AP. The influence of macromolecular crowding and macromolecular confinement on biochemical reactions in physiological media. J Biol Chem. 2001;276:10577–10580. doi: 10.1074/jbc.R100005200. [DOI] [PubMed] [Google Scholar]
- 3.Ellis RJ. Macromolecular crowding: obvious but underappreciated. Trends Biochem Sci. 2001;26:597–604. doi: 10.1016/s0968-0004(01)01938-7. [DOI] [PubMed] [Google Scholar]
- 4.Kilburn D, Roh JH, Guo L, Briber RM, Woodson SA. Molecular crowding stabilizes folded RNA structure by the excluded volume effect. J Am Chem Soc. 2010;132:8690–8696. doi: 10.1021/ja101500g. [DOI] [PMC free article] [PubMed] [Google Scholar]
- 5.Nakano S, Karimata HT, Kitagawa Y, Sugimoto N. Facilitation of RNA enzyme activity in the molecular crowding media of cosolutes. J Am Chem Soc. 2009;131:16881–16888. doi: 10.1021/ja9066628. [DOI] [PubMed] [Google Scholar]
- 6.Karimata H, Nakano S, Sugimoto N. The roles of cosolutes on the hammerhead ribozyme activity. Nucleic Acids Symp Series. 2006;50:81–82. doi: 10.1093/nass/nrl040. [DOI] [PubMed] [Google Scholar]
- 7.Kassel KM, Au DR, Higgins MJ, Hines M, Graves LM. Regulation of human cytidine triphosphate synthetase 2 by phosphorylation. J Biol Chem. 2010;285:33727–33736. doi: 10.1074/jbc.M110.178566. [DOI] [PMC free article] [PubMed] [Google Scholar]
- 8.Bergström J, Fürst P, Norée LO, Vinnars E. Intracellular free amino acid concentration in human muscle tissue. J Appl Physiol. 1974;36:693–697. doi: 10.1152/jappl.1974.36.6.693. [DOI] [PubMed] [Google Scholar]
- 9.Bar-Even A, Noor E, Flamholz A, Buescher JM, Milo R. Hydrophobicity and charge shape cellular metabolite concentrations. PLoS Comput Biol. 2011;7:e1002166. doi: 10.1371/journal.pcbi.1002166. [DOI] [PMC free article] [PubMed] [Google Scholar]
- 10.Zhou HX, Rivas G, Minton AP. Macromolecular crowding and confinement: biochemical, biophysical, and potential physiological consequences. Annu Rev Biophys. 2008;37:375–397. doi: 10.1146/annurev.biophys.37.032807.125817. [DOI] [PMC free article] [PubMed] [Google Scholar]
- 11.Knowles DB, Lacroix AS, Deines NF, Shkel I, Record MT., Jr Separation of preferential interaction and excluded volume effects on DNA duplex and hairpin stability. Proc Natl Acad Sci U S A. 2011;108:12699–12704. doi: 10.1073/pnas.1103382108. [DOI] [PMC free article] [PubMed] [Google Scholar]
- 12.Guinn EJ, Schwinefus JJ, Cha HK, McDevitt JL, Merker WE, Ritzer R, Muth GW, Engelsgjerd SW, Mangold KE, Thompson PJ, Kerins MJ, Record MT. Quantifying functional group interactions that determine urea effects on nucleic acid helix formation. J Am Chem Soc. 2013;135:5828–5838. doi: 10.1021/ja400965n. [DOI] [PMC free article] [PubMed] [Google Scholar]
- 13.Nakano S, Hirayama H, Miyoshi D, Sugimoto N. Dimerization of nucleic acid hairpins in the conditions caused by neutral cosolutes. J Phys Chem B. 2012;116:7406–7415. doi: 10.1021/jp302170f. [DOI] [PubMed] [Google Scholar]
- 14.Kim YC, Best RB, Mittal J. Macromolecular crowding effects on protein-protein binding affinity and specificity. J Chem Phys. 2010;133:205101. doi: 10.1063/1.3516589. [DOI] [PubMed] [Google Scholar]
- 15.Wang Y, Sarkar M, Smith AE, Krois AS, Pielak GJ. Macromolecular crowding and protein stability. J Am Chem Soc. 2012;134:16614–16618. doi: 10.1021/ja305300m. [DOI] [PubMed] [Google Scholar]
- 16.Jiang M, Guo Z. Effects of macromolecular crowding on the intrinsic catalytic efficiency and structure of enterobactin-specific isochorismate synthase. J Am Chem Soc. 2007;129:730–731. doi: 10.1021/ja065064+. [DOI] [PubMed] [Google Scholar]
- 17.Tokuriki N, Kinjo M, Negi S, Hoshino M, Goto Y, Urabe I, Yomo T. Protein folding by the effects of macromolecular crowding. Protein Sci. 2004;13:125–133. doi: 10.1110/ps.03288104. [DOI] [PMC free article] [PubMed] [Google Scholar]
- 18.Nashimoto M. Correct folding of a ribozyme induced by nonspecific macromolecules. Eur J Biochem. 2000;267:2738–2745. doi: 10.1046/j.1432-1327.2000.01294.x. [DOI] [PubMed] [Google Scholar]
- 19.Nakano S, Kitagawa Y, Karimata HT, Sugimoto N. Molecular crowding effect on metal ion binding properties of the hammerhead ribozyme. Nucleic Acids Symp Series. 2008;52:519–520. doi: 10.1093/nass/nrn263. [DOI] [PubMed] [Google Scholar]
- 20.Lambert D, Draper DE. Effects of osmolytes on RNA secondary and tertiary structure stabilities and RNA-Mg2+ interactions. J Mol Biol. 2007;370:993–1005. doi: 10.1016/j.jmb.2007.03.080. [DOI] [PMC free article] [PubMed] [Google Scholar]
- 21.Nakano S, Hirayama H, Miyoshi D, Sugimoto N. Dimerization of nucleic acid hairpins in the conditions caused by neutral cosolutes. J Phys Chem B. 2012;116:7406–7415. doi: 10.1021/jp302170f. [DOI] [PubMed] [Google Scholar]
- 22.Salehi-Ashtiani K, Lupták A, Litovchick A, Szostak JW. A genomewide search for ribozymes reveals an HDV-like sequence in the human CPEB3 gene. Science. 2006;313:1788–1792. doi: 10.1126/science.1129308. [DOI] [PubMed] [Google Scholar]
- 23.Chadalavada DM, Gratton EA, Bevilacqua PC. The human HDV-like CPEB3 ribozyme is intrinsically fast-reacting. Biochemistry. 2010;49:5321–5330. doi: 10.1021/bi100434c. [DOI] [PMC free article] [PubMed] [Google Scholar]
- 24.Emsley P, Cowtan K. Coot: model-building tools for molecular graphics. Acta Crystallogr D. 2004;60:2126–2132. doi: 10.1107/S0907444904019158. [DOI] [PubMed] [Google Scholar]
- 25.Vanegas PL, Hudson GA, Davis AR, Kelly SC, Kirkpatrick CC, Znosko BM. RNA CoSSMos: Characterization of Secondary Structure Motifs--a searchable database of secondary structure motifs in RNA three-dimensional structures. Nucleic Acids Res. 2012;40:D439–444. doi: 10.1093/nar/gkr943. [DOI] [PMC free article] [PubMed] [Google Scholar]
- 26.Krieger E, Joo K, Lee J, Lee J, Raman S, Thompson J, Tyka M, Baker D, Karplus K. Improving physical realism, stereochemistry, and side-chain accuracy in homology modeling: Four approaches that performed well in CASP8. Proteins: Struct, Funct, Bioinf. 2009;77:114–122. doi: 10.1002/prot.22570. [DOI] [PMC free article] [PubMed] [Google Scholar]
- 27.Nielsen SS, Toft KN, Snakenborg D, Jeppesen MG, Jacobsen JK, Vestergaard B, Kutter JP, Arleth L. BioXTAS RAW, a software program for high-throughput automated small-angle X-ray scattering data reduction and preliminary analysis. J Appl Crystallogr. 2009;42:959–964. [Google Scholar]
- 28.Meisburger Steve P, Warkentin M, Chen H, Hopkins Jesse B, Gillilan Richard E, Pollack L, Thorne Robert E. Breaking the radiation damage limit with cryo-SAXS. Biophys J. 2013;104:227–236. doi: 10.1016/j.bpj.2012.11.3817. [DOI] [PMC free article] [PubMed] [Google Scholar]
- 29.Classen S, Hura GL, Holton JM, Rambo RP, Rodic I, McGuire PJ, Dyer K, Hammel M, Meigs G, Frankel KA, Tainer JA. Implementation and performance of SIBYLS: a dual endstation small-angle X-ray scattering and macromolecular crystallography beamline at the Advanced Light Source. J Appl Crystallogr. 2013;46:1–13. doi: 10.1107/S0021889812048698. [DOI] [PMC free article] [PubMed] [Google Scholar]
- 30.Rambo RP, Tainer JA. Improving small-angle X-ray scattering data for structural analyses of the RNA world. RNA. 2010;16:638–646. doi: 10.1261/rna.1946310. [DOI] [PMC free article] [PubMed] [Google Scholar]
- 31.Guinier A, Fournet G. Small-angle scattering of X-rays. Wiley; New York: 1955. [Google Scholar]
- 32.Semenyuk AV, Svergun DI. GNOM - a program package for small-angle scattering data processing. J Appl Crystallogr. 1991;24:537–540. doi: 10.1107/S0021889812007662. [DOI] [PMC free article] [PubMed] [Google Scholar]
- 33.Svergun DI. Determination of the regularization parameter in indirect-transform methods using perceptual criteria. J Appl Crystallogr International Union of Crystallography. 1992;25:495–503. [Google Scholar]
- 34.Hura GL, Menon AL, Hammel M, Rambo RP, Poole FL, II, Tsutakawa SE, Jenney FE, Jr, Classen S, Frankle KA, Hopkins RC, Yang SJ, Scott JW, Dillard BD, Adams MW, Tainer JA. Robust, high-throughput solution structural analyses by small angle X-ray scattering (SAXS) Nat Methods. 2009;6:606. doi: 10.1038/nmeth.1353. [DOI] [PMC free article] [PubMed] [Google Scholar]
- 35.Durand D, Vives C, Cannella D, Perez J, Pebay-Peyroula E, Vachette P, Fieschi F. NADPH oxidase activator p67(phox) behaves in solution as a multidomain protein with semi-flexible linkers. J Struct Biol. 2010;169:45–53. doi: 10.1016/j.jsb.2009.08.009. [DOI] [PubMed] [Google Scholar]
- 36.Schneidman-Duhovny D, Hammel M, Sali A. FoXS: a web server for rapid computation and fitting of SAXS profiles. Nucleic Acids Res. 2010;38:W540–544. doi: 10.1093/nar/gkq461. [DOI] [PMC free article] [PubMed] [Google Scholar]
- 37.Schneidman-Duhovny D, Hammel M, Tainer JA, Sali A. Accurate SAXS profile computation and its assessment by contrast variation experiments. Biophys J. 2013;105:962–974. doi: 10.1016/j.bpj.2013.07.020. [DOI] [PMC free article] [PubMed] [Google Scholar]
- 38.Franke D, Svergun DI. DAMMIF, a program for rapid ab-initio shape determination in small-angle scattering. J Appl Crystallogr. 2009;42:342–346. doi: 10.1107/S0021889809000338. [DOI] [PMC free article] [PubMed] [Google Scholar]
- 39.Volkov VV, Svergun DI. Uniqueness of ab initio shape determination in small-angle scattering. J Appl Crystallogr. 2003;36:860–864. doi: 10.1107/S0021889809000338. [DOI] [PMC free article] [PubMed] [Google Scholar]
- 40.Kozin MB, Svergun DI. Automated matching of high- and low-resolution structural models. J Appl Crystallogr. 2001;34:33–41. [Google Scholar]
- 41.Knowles DB, LaCroix AS, Deines NF, Shkel I, Record MT. Separation of preferential interaction and excluded volume effects on DNA duplex and hairpin stability. Proc Natl Acad Sci USA. 2011;108:12699–12704. doi: 10.1073/pnas.1103382108. [DOI] [PMC free article] [PubMed] [Google Scholar]
- 42.London RE. Methods for measurement of intracellular magnesium: NMR and fluorescence. Annual Reveiw of Physiology. 1991;53:241–258. doi: 10.1146/annurev.ph.53.030191.001325. [DOI] [PubMed] [Google Scholar]
- 43.Grubbs RD. Intracellular magnesium and magnesium buffering. BioMetals. 2002;15:251–259. doi: 10.1023/a:1016026831789. [DOI] [PubMed] [Google Scholar]
- 44.Alberts B, Bray D, Lewis J, Raff M, Roberts K, Watson JD. Molecular biology of the cell. 3. Garland Science; New York: 1994. [Google Scholar]
- 45.Feig AL, Uhlenbeck OC. The RNA World. Cold Spring Harbor Press; New York: 1999. The role of metal Ions in RNA biochemistry. [Google Scholar]
- 46.Chen J, Ganguly A, Miswan Z, Hammes-Schiffer S, Bevilacqua PC, Golden BL. Identification of the catalytic Mg2+ ion in the hepatitis delta virus ribozyme. Biochemistry. 2013;52:557–567. doi: 10.1021/bi3013092. [DOI] [PMC free article] [PubMed] [Google Scholar]
- 47.Denesyuk NA, Thirumalai D. Crowding promotes the switch from hairpin to pseudoknot conformation in human telomerase RNA. J Am Chem Soc. 2011;133:11858–11861. doi: 10.1021/ja2035128. [DOI] [PubMed] [Google Scholar]
- 48.Yancey PH, Clark ME, Hand SC, Bowlus RD, Somero GN. Living with water stress: Evolution of osmolyte systems. Science. 1982;217:1214–1222. doi: 10.1126/science.7112124. [DOI] [PubMed] [Google Scholar]
- 49.Rösgen J, Pettitt BM, Bolen DW. Protein folding, stability, and solvation structure in osmolyte solutions. Biophys J. 2005;89:2988–2997. doi: 10.1529/biophysj.105.067330. [DOI] [PMC free article] [PubMed] [Google Scholar]
- 50.Shelton VM, Sosnick TR, Pan T. Applicability of urea in the thermodynamic analysis of secondary and tertiary RNA folding. Biochemistry. 1999;38:16831–16839. doi: 10.1021/bi991699s. [DOI] [PubMed] [Google Scholar]
- 51.Priyakumar UD, Hyeon C, Thirumalai D, MacKerell AD. Urea destabilizes RNA by forming stacking interactions and multiple hydrogen bonds with nucleic acid bases. J Am Chem Soc. 2009;131:17759–17761. doi: 10.1021/ja905795v. [DOI] [PMC free article] [PubMed] [Google Scholar]
- 52.Ferre-D’Amare AR, Zhou K, Doudna JA. Crystal structure of a hepatitis delta virus ribozyme. Nature. 1998;395:567–574. doi: 10.1038/26912. [DOI] [PubMed] [Google Scholar]
- 53.Russell R, Zhuang X, Babcock HP, Millett IS, Doniach S, Chu S, Herschlag D. Exploring the folding landscape of a structured RNA. Proc Natl Acad Sci USA. 2002;99:155–160. doi: 10.1073/pnas.221593598. [DOI] [PMC free article] [PubMed] [Google Scholar]
- 54.Lipfert J, Herschlag D, Doniach S. Riboswitch conformations revealed by small-angle X-ray scattering. Methods Mol Biol. 2009;540:141–159. doi: 10.1007/978-1-59745-558-9_11. [DOI] [PMC free article] [PubMed] [Google Scholar]
- 55.Fang X, Littrell K, Yang XJ, Henderson SJ, Siefert S, Thiyagarajan P, Pan T, Sosnick TR. Mg2+-dependent compaction and folding of yeast tRNAPhe and the catalytic domain of the B. subtilis RNase P RNA determined by small- angle X-ray scattering. Biochemistry. 2000;39:11107–11113. doi: 10.1021/bi000724n. [DOI] [PubMed] [Google Scholar]
- 56.Misra VK, Shiman R, Draper DE. A thermodynamic framework for the magnesium-dependent folding of RNA. Biopolymers. 2003;69:118–136. doi: 10.1002/bip.10353. [DOI] [PubMed] [Google Scholar]
- 57.Lipfert J, Das R, Chu VB, Kudaravalli M, Boyd N, Herschlag D, Doniach S. Structural transitions and thermodynamics of a glycine-dependent riboswitch from Vibrio cholerae. J Mol Biol. 2007;365:1393–1406. doi: 10.1016/j.jmb.2006.10.022. [DOI] [PMC free article] [PubMed] [Google Scholar]
- 58.Chen B, Zuo X, Wang YX, Dayie TK. Multiple conformations of SAM-II riboswitch detected with SAXS and NMR spectroscopy. Nucleic Acids Res. 2012;40:3117–3130. doi: 10.1093/nar/gkr1154. [DOI] [PMC free article] [PubMed] [Google Scholar]
- 59.Schlatterer JC, Kwok LW, Lamb JS, Park HY, Andresen K, Brenowitz M, Pollack L. Hinge stiffness is a barrier to RNA folding. J Mol Biol. 2008;379:859–870. doi: 10.1016/j.jmb.2008.04.013. [DOI] [PMC free article] [PubMed] [Google Scholar]
- 60.Nakano S, Karimata HT, Kitagawa Y, Sugimoto N. Facilitation of RNA enzyme activity in the molecular crowding media of cosolutes. J Am Chem Soc. 2009;131:16881–16888. doi: 10.1021/ja9066628. [DOI] [PubMed] [Google Scholar]
Associated Data
This section collects any data citations, data availability statements, or supplementary materials included in this article.