

Purpose
In-vivo cortical parcellation based on the brain connectivity structure, as elucidated by diffusion based tractography, has the potential to identify cortical regions with mutually distinct and internally coherent connectivity that are believed to be strongly correlated with the brain function. In tractography based cortical parcellation [1], cortical areas with similar long-range connectivity are combined into a region, which is segregated from neighboring regions with different connectivity, thereby creating cortical areas with similar connectivity profiles. Promising results demonstrated for the parcellation of the medial frontal cortex [1] and the geniculate bodies [2] suggest that such a regional connectivity profile of the brain can provide a unique characterization of the brain. This requires the investigation of the reproducibility of such parcellations in an individual at different time points. Here we investigate the stability of parcellation over time (with an application to the parcellation of the primary visual cortex) and establish a paradigm that can be used to parcellate the brain based on study-specific hypotheses. Owing to the stability of parcellation, any change can be interpreted as being introduced by pathology. In addition, demonstrating that these parcellations are stable over time within subjects would be helpful in defining a parcellation profile for a subject and will constitute a first step in quantifying differences between people.
Dataset and Methods
For our investigation, we used the diffusion data acquired on a healthy adult female subject, at three time points, two weeks apart. The diffusion protocol used the modified Stejskal-Tanner imaging sequence (TE=106ms, TR=16.9s, 2mm isotropic voxels, 2 non diffusion-weighted b=0 images, 64 gradient directions at b=3000 s/mm2) on a Siemens 3T Verio scanner with a 32-channel head coil.. Total acquisition time was 16 minutes. Using Freesurfer [3] on structural T1 images, that were acquired during the same session, we segmented the primary visual cortex (V1) on the first time point. Said segmentation was downsampled to 2 mm isotropic voxels, obtaining 480 seed voxels. We then rigidly registered this V1 segmentation to the other two time points. We used all the other cortical labels from Freesufer and segmented the white matter – grey matter boundary, downsampled it to 4 mm isotropic voxels and obtained 4900 target voxels, which were then rigidly transformed it to the other two time points. Probabilistic tractography [4] was performed between the seed and the target voxels at all three time points and the connectivity matrices were computed. To better clusterize those seed points based on their respective tractograms, a cross-correlation matrix of these 480 seeds was created and an unsupervised spectral clustering algorithm [4] was used to obtain the regions, We used the normalized mutual information metric in order to analyze how well the clusters matched between the time-points, where 1 suggests perfect overlap between the clusters and 0 means no overlap.
Results
Figure 1 shows a relative stability of the unsupervised clusters across time points. For time points #1 and #3, we obtained 4 clusters. Time point #2 has 5 clusters but the fifth cluster is only a subdivision of the most antero-superior clusters. Parcellation of primary visual cortex shows an organization in layers, oriented obliquely from the tip of the occipital lobe towards the antero-superior part. The cross correlation matrices, exhibit the same size and organization of clusters and furthermore show that the extra cluster of timepoint #2 is a subdivision of another cluster. Mutual information run on the resulting clusters is 0.81 between t1 and t2, 0.77 between t1 and t3 and 0.79 between t2 and t3.
Figure 1.
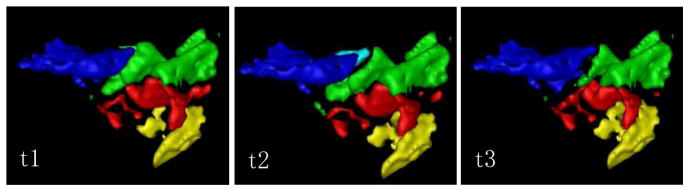
3D rendering of the clusters for V1 connectivity based parcellation on a sagitall view. Left-right axis is the antero-posterior axis. First and third time points show 4 clusters and the second time points shows an extra cluster.
Discussion
To the best of our knowledge, this is the first study to test the reproducibility of connectivity based parcellation of the cortex and its application to primary visual cortex. Other techniques were proposed [5–7] to parcellate the brain but none of them have tested the stability of these parcellations over time. The main advantage of this technique is that this paradigm creates connectivity based clusters in an unsupervised manner while other methods need an additional constraint to ensure spatial consistency of the clusters or use supervised clutering methods like k-means to obtain a specific number of clusters, which need to be known a priori. Extension to full brain connectivity parcellation would provide a blue print of a person’s brain and will be helpful to diagnose several diseases. Moreover, the process presented in that paper can be used in clinical studies to process hypothesis driven regions to give more insight on connectivity related pathologies.
Conclusion
This study investigates the reproducibility of connectivity based cortical parcellation and its application to primary visual cortex. Results show that the paradigm we use to obtain such a parcellation is stable over time within a subject and that the information contained in the tractograms of the sub-regions obtained through this method is discriminatory enough to define a parcellation profile for a person, which can then be used in clinical studies.
References
- 1.Johansen-Berg, et al. PNAS. 101(36):2004. [Google Scholar]
- 2.Devlin, et al. Neuroimage. 26(Supp 1):2005. [PMC free article] [PubMed] [Google Scholar]
- 3.Fischl, et al. Neuron. 33(3):2002. doi: 10.1016/s0896-6273(02)00569-x. [DOI] [PubMed] [Google Scholar]
- 4.Behrens, et al. Neuroimage. 34(1):2007. doi: 10.1016/j.neuroimage.2006.09.018. [DOI] [PMC free article] [PubMed] [Google Scholar]
- 5.Klein, et al. Neuroimage. 34(1):2007. doi: 10.1016/j.neuroimage.2006.08.022. [DOI] [PubMed] [Google Scholar]
- 6.Anwander, et al. Cerebral Cortex. 17(4):2007. doi: 10.1093/cercor/bhk034. [DOI] [PubMed] [Google Scholar]
- 7.Mars, et al. Journal of Neuroscience. 21(11):2011. [Google Scholar]