Abstract
Myo-inositol oxygenase (MIOX) catalyzes the 4e− oxidation of myo-inositol (MI) to D-glucuronate using a substrate activated Fe(II)Fe(III) site. The biferrous and Fe(II)Fe(III) forms of MIOX were studied with circular dichroism (CD), magnetic circular dichroism (MCD), and variable temperature variable field (VTVH) MCD spectroscopies. The MCD spectrum of biferrous MIOX shows two ligand field (LF) transitions near 10,000 cm−1, split by ~2,000 cm−1, characteristic of 6 coordinate (6C) Fe(II) sites, indicating that the modest reactivity of the biferrous form toward O2 can be attributed to the saturated coordination of both irons. Upon oxidation to the Fe(II)Fe(III) state, MIOX shows two LF transitions in the ~10,000 cm−1 region, again implying a coordinatively saturated Fe(II) site. Upon MI binding, these split in energy to 5,200 cm−1 and 11,200 cm−1, showing that MI binding causes the Fe(II) to become coordinately unsaturated. VTVH MCD magnetization curves of unbound and MI-bound Fe(II)Fe(III) forms show that upon substrate binding, the isotherms become more nested, requiring that the exchange coupling and ferrous zero field splitting (ZFS) both decrease in magnitude. These results imply that MI binds to the ferric site, weakening the Fe(III)-μ-OH bond and strengthening the Fe(II)-μ-OH bond. This perturbation results in the release of a coordinated water from the Fe(II) that enables its O2 activation.
Introduction
Ferritin-like, binuclear non-heme-iron enzymes (diiron enzymes that have a common 4-helical bundle motif) are involved in a wide range of biochemical processes, many of which have either implications to human health or perform industrially important chemical transformations.1-4 The diiron core of ribonucleotide reductase (RR) catalyzes the formation of a tyrosine radical that is required in the de novo synthesis of deoxyribonucleotides.4,5 Δ9-desaturase (Δ9D) catalyzes the insertion of a carbon-carbon double bond in stearoyl-ACP, essential in the biosynthesis of oleic acid, the most abundant fatty acid in human adipose tissue 6,7,8. The diiron site of methane monooxygenase (MMO) catalyzes the oxidation of methane, a green house gas9, to methanol, a usable fuel10,11-13. While myo-inositol oxygenase (MIOX), a eukaryotic/human enzyme that is essential to human health, also harbors a binuclear non-heme-iron cofactor,14 it is structurally and mechanistically distinct from the ferritin-like diiron oxygenases and oxidases, such as RR, Δ9D, and MMO.15-18
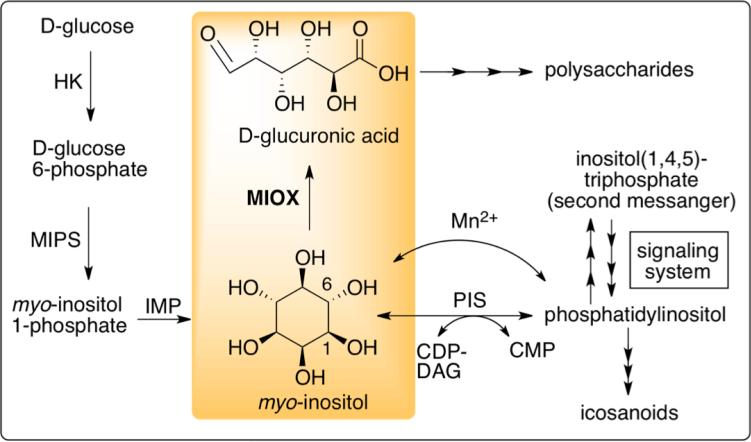
MIOX catalyzes the 4e− oxidation of myo-inositol (MI) to D-glucuronate (DG).17,19 This catalytic reaction forms a central part of the metabolic pathway of MI (Figure 1)20-26. With roles in osmoregulation, membrane structure, signal transduction, and in the transcriptional regulation of hundreds of genes, the reactant (MI) has been implicated in affecting mood, reproduction, osteogenesis, the central nervous system, and insulin sensitivity and is a suggested treatment for various psychiatric and metabolic conditions, polycystic ovary syndrome, and in the inhibition of certain types of cancer.19,23-25,27-36 Its concentration is associated with glial proliferation and thought to be a glial marker.37,38 The product (DG) is of interest in biotechnology, specifically its incorporation into the backbones of polysaccharides (Figure 1).39 In addition to the important medical implications of the substrate (MI) and the biotech applications of the product (DG), diabetic complications have been attributed to an increase in MIOX expression and activity, making the enzyme a potential drug-target.31
Figure 1.
Metabolic pathway of myo-inositol. 20-26 The oxygenation of myo-inositol to D-glucuronate, catalyzed by MIOX, is highlighted. Abbreviations: hexokinase (HK), myo-inositol-1-phosphate synthase (MIPS), inositol monophosphate phosphatase (IMP), phosphatidylinositol synthase (PIS), cytidine diphosphate diacylglycerol (CDP-DAG), cytidine monophosphate (CMP).
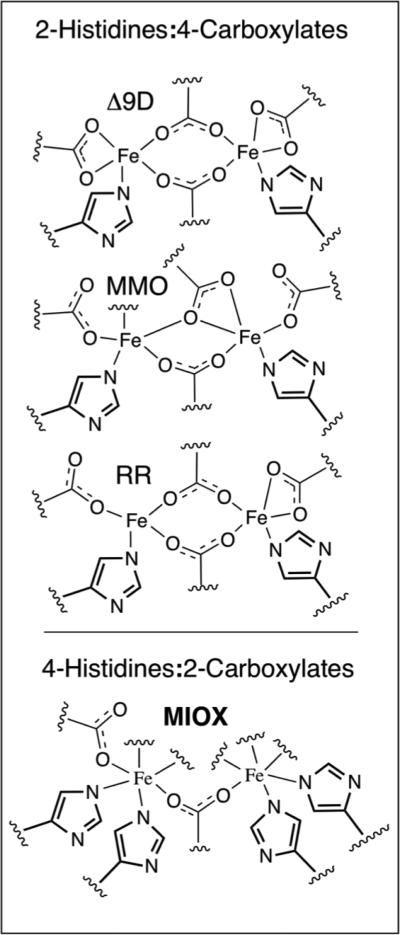
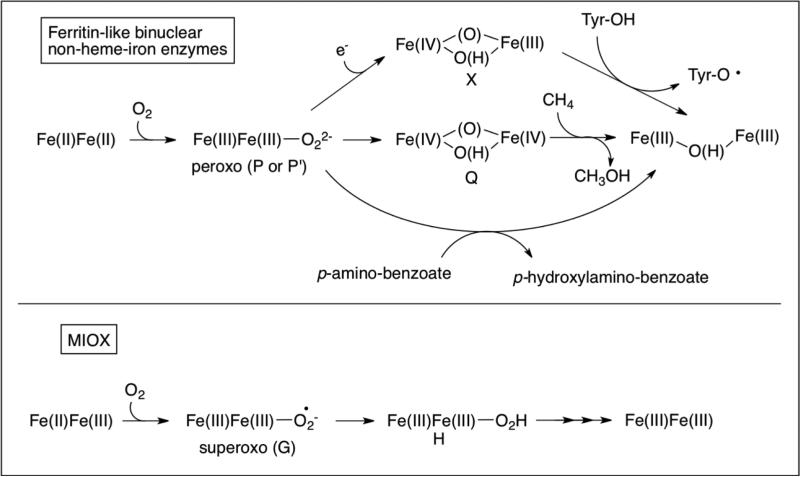
Most binuclear non-heme-iron enzymes, including RR, Δ9D, and MMO, have diiron sites that are housed in 4-α helical bundle motifs and coordinated by 2-histidines and 4-carboxylates from protein derived ligand sets (Figure 2, top).1,2,5,7,8,11,12,40 They are active in the Fe(II)Fe(II) state (Figure 3, top). 1,41-48 They activate O2 by a 2e− reduction, forming bridged peroxy-Fe(III)Fe(III) intermediates, and catalyze 2-electron oxidations. MIOX, however, deviates from these commonly shared characteristics among diiron enzymes. The diiron cofactor is housed in an HD-domain (named after a conserved His and Asp residue doublet), where 5 helixes contribute a 4-His/2-carboxylate ligand set (Figure 2, bottom). 16-18 It is, to date, the only member of the HD-domain protein structural superfamily known to possess a diiron cluster and oxygenase activity (although a recent report suggests that there may be more examples). 49 Although MIOX can exist in three oxidation states (Fe(II)Fe(II), Fe(II)Fe(III), and Fe(III)Fe(III)), the Fe(II)Fe(III) form is catalytically active (Figure 3, bottom), and substrate must first bind to the active site before O2 activation occurs. 27,28 Putatively, the substrate coordinates to the Fe(III) site of the cofactor via its C1 and C6 alkoxides (Figure 1). While the outer-sphere 1e− reduction of O2 is thermodynamically difficult (E = −160 mV) 50 , MIOX undergoes an oxidative addition of O2 to the Fe(II) to form a superoxo-Fe(III) species (Figure 3, bottom), intermediate G. 16-18,27,28 G initiates MI oxidation by cleavage of the C1-H bond. 27 Steps in the catalysis of MIOX following hydrogen abstraction from C1 are less well characterized, but are thought to involve one of the following: homolysis of the O-O bond followed by substrate/hydroxyl radical recombination; transfer of the hydroperoxyl moiety to the substrate radical; or generation of a ketone intermediate, which is attacked by the (hydro)peroxo moiety. 17,51 Understanding the reactivity of this unusual enzyme at the molecular level offers fundamental insight into how a binuclear non-heme-iron center may be tuned to use a 1e− rather than 2e− reduction strategy for O2 activation and has the potential to aid in the development of new diabetic therapies and glucuronic acid based polysaccharides for biotech applications.
Figure 2.
Protein derived ligand sets of ferritin-like binuclear non-heme-iron enzymes 1,2,5,7,8,11,12,40 (top) and MIOX16-18 (bottom).
Figure 3.
Comparison of the mechanistic strategies of most binuclear non-heme-iron enzymes 1,41-48 (top) and MIOX16-18,27,28 (bottom).
These studies elucidate several fundamental features of the MIOX reaction. This includes the unusual lack of catalytic activity of the Fe(II)Fe(II) state, as well as the modest O2 reactivity of this form (k ~ 2×10³ M−1s−1; 100-fold less than that of the Fe(II)Fe(III)•MI form) 27,52 , and the necessity for substrate addition to the mixed-valent Fe(II)Fe(III) species for O2 activation. CD/MCD and VTVH MCD studies of MIOX in its Fe(II)Fe(II), Fe(II)Fe(III), and Fe(II)Fe(III)•MI states are presented and provide structural and mechanistic insight into these requirements for O2 activation.
Near IR CD/MCD is especially useful for studying the high-spin d6 Fe(II) center in biferrous, Fe(II)Fe(III), and Fe(II)Fe(III)•MI forms of MIOX. Non-heme ferrous sites are generally inaccessible through EPR and absorption spectroscopies, making them difficult to study. Near IR CD/MCD spectroscopies, however, allow for the observation of ferrous ligand field (LF) transitions, which are weak in absorption but relatively intense in CD and MCD. 1,53 The energies of these correlate to different coordination geometries. A 6-coordinate (6C) Fe(II) site will exhibit two LF transitions near 10,000 cm−1, split by ~2,000 cm−1. These transitions undergo a larger splitting in a 5C square pyramidal geometry, giving rise to one band at > 10,000 cm−1 and the other at ~5,000 cm−1. For a 5C trigonal bipyramidal site, these bands shift to < 10,000 cm−1 and < 5,000 cm−1. For a 4C tetrahedral site, two transitions are present in the 5,000-7,000 cm−1 region.
Transitions involving the Fe(III) in the Fe(II)Fe(III) forms of MIOX may also be accessible with near IR CD/MCD spectroscopies. Weak spin forbidden Fe(III) 6A1 → 4T1 and 6A1 → 4T2 LF transitions may be observed due to exchange coupling between the irons and mixing with intense charge-transfer transitions. 54-62 These transitions decrease in energy with increasing ligand-field strength, with LF transitions of 4C Fe(III) sites at highest energy and those of 6C sites at lowest energy. In addition, the mixed-valent forms of MIOX could also have an intervalence charge-transfer (IT, Fe(II) → Fe(III)) transition, which would contribute to the near IR region of the spectrum but is expected to have little MCD intensity (as these are strongly polarized along the Fe-Fe bond and MCD C-term intensity requires two perpendicular transition moments). 54,62-64
VTVH MCD methodology is also a valuable probe of the ground states of the coupled binuclear Fe sites in both the Fe(II)Fe(II) and Fe(II)Fe(III) forms of MIOX. It allows for analysis of the spin system and determination of important spin-Hamiltonian parameters, specifically the exchange coupling (J) between the Fe ions, which reflects the nature of the bridging ligands, and the zero field splittings (ZFSs) of each of the Fe ions, which provide information complementary to that obtained from CD/MCD spectra about the nature the ligand field at each Fe site. 1,54,62
As presented below, the combined CD, MCD and VTVH MCD approach provides insights into the geometric and electronic structures, and thus, the reactivities of the Fe(II)Fe(II) and Fe(II)Fe(III) sites and the role of MI binding in activating the enzyme for O2 addition to the cofactor. They generate a model where high histidine ligation results in a coordinatively saturated Fe(II)Fe(II) site. Oxidation to the Fe(II)Fe(III) state allows for MIOX to bind MI, which modifies a bridge and results in an open coordination position at the Fe(II) for the activation of O2 by 1e−. This mechanism is in sharp contrast to that of the ferritin-like diiron oxygenases and oxidases, which react from the biferrous state with open coordination positions on both irons allowing 2e− reductive activation of O2 to form a peroxo-bridge.
Experimental
Materials
FeSO4·6H2O was obtained from J.T. Baker. Bis-tris buffer, MI, acetic acid and sucrose were obtained from Sigma-Aldrich. Deuterium oxide (D2O; 99.9% 2H) and perdeuterated glycerol (d8-glycerol; 98% 2H) were obtained from Cambridge Isotope Laboratories (Andover, MA). Both MI and sucrose were dissolved in D2O and lyophilized before use. N2(g) (ultrahigh purity) for the glovebox and Ar(g) (99.9%) for Schlenk line manipulations were obtained from Praxair. N2(l) and He(l) were also obtained from Praxair. Deoxygenated deuterated buffer (50 mM Bis-tris•acetate in D2O with 10% wt/wt d8-glycerol and pD 6.0) was prepared by multiple freeze-pump-thaw cycles on a Schlenk line with Ar(g). Deoxygenated protein was prepared (on ice) by multiple (6+) gentle vacuum/purge cycles followed by purging the sample’s headspace with Ar(g) for 3+ hours.
Preparation of Apo-MIOX
Apo M. musculus kidney MIOX was expressed, purified and quantified according to published procedures. 14 Apo MIOX was exchanged into deuterated buffer (50 mM Bis-tris•acetate in D2O with 10% wt/wt d8-glycerol, pD 6.0) by 8+ cycles of 4 x dilution with D2O-buffer and concentration back to 2-3 mM. The concentration was determined by the absorption band at 280 nm (ε = 60,800 M−1 cm−1). 14 Protein was kept at 5-10 °C during buffer exchange. The voltage associated with the absorption of the CD spectrum of the apo-protein was checked at 1500 nm (~6,700 cm−1) to monitor the buffer exchange.
Preparation of biferrous MIOX (MIOX(II,II))
Deoxygenated apo-MIOX in deuterated buffer was brought into the glove box and kept at 7 °C on a cold plate while 1.70 eq. of deoxygenated ferrous ammonium sulfate (in deuterated buffer) was added to the apo-protein sample. Fe(II) loading was confirmed by near IR CD.
Preparation of biferric MIOX (MIOX(III,III))
MIOX(II,II) (~1-2 mM) was treated with excess O2 by diluting the sample with an O2 containing buffer (~4 °C, ~300-400 μM of O2) 65 to 30 μM and leaving it in an aerobic atmosphere (~4 °C) for 8 hours. MIOX(III,III) samples were then concentrated to 2-3 mM. Complete oxidation to MIOX(III/III) by this protocol was verified by Mössbauer spectroscopy after MI addition (see Figure S13 (middle) in the Supporting Information).
Preparation of mixed-valent Fe(II)Fe(III) MIOX (MIOX(II,III))
Equimolar amounts of deoxygenated MIOX(II,II) and MIOX(III,III) were mixed in an anaerobic environment (glove box) and incubated for 1 hour at 7 °C. Mössbauer spectra taken on samples prepared according to this protocol and then treated with saturating MI showed 60-70 % conversion to the mixed-valent species with equal quantities (15-20 %) of biferrous and biferric components (see Figure S13 (bottom) in the Supporting Information).
Preparation of MI complexes of MIOX
MIOX•MI samples (1-3 mM) were prepared by adding (anaerobically for MIOX(II,III)•MI and MIOX(II,II)•MI and aerobically for MIOX(III,III)•MI) a small volume (10-20 μL) of a concentrated MI solution to the MIOX samples for final MI concentrations of 50-100 mM.
Instrumentation
Near IR (600-1900 nm region) CD and MCD spectroscopies were performed on a JASCO J730D spectropolarimeter with an N2(l) cooled InSb detector. The MCD and VTVH MCD data for the 800-500 nm region were collected on a JASCO J810 spectropolarimeter equipped with a photomultiplier tube that has an S1 photocathode. For CD spectroscopy, a circulator connected to the CD cell holder was used to cool the anaerobic quartz CD cell. For MCD spectroscopy, a He(l) cooled Oxford Instrument SM4000 7T-superconducting magnet was used for field and temperature variation. An Agilent 8453 UV-visible Spectrophotometer was used to determine protein concentrations.
CD and MCD Spectroscopy
All CD experiments were performed in an anaerobic quartz cell at 4 °C. CD titrations were performed by adding 120 μL of deoxygenated apo-MIOX to the anaerobic quartz cell in a glove box. For each addition of ferrous ammonium sulfate (at 0, 0.25, 0.5, 0.75, 1, 1.25, 1.5, 1.75, 2, 2.5, and 3 eq. of Fe(II)), a CD spectrum was taken after a 15-20 min. incubation. MCD samples were prepared by adding sucrose to saturation and separating out any solid sucrose through centrifugation in a glovebox. A CD spectrum was taken after sucrose addition to confirm that it did not perturb the diiron site (see Figures S3 and S5 in Supporting Information). Sucrose-saturated samples were then added to MCD cells in the glovebox and immediately transferred to N2(l). MCD spectra were taken at ±7 T, ±5 T, ±3 T, ±1 T, and 0 T at 2 K, and ±7 T and 0 T for temperatures of 5 K, 10 K, and 20 K. The MCD baseline was corrected by averaging positive and negative fields (e.g. ((+7T)-(-7T))/2). CD and MCD spectra were analyzed by a non-linear least-squares fitting procedure to resolve them into the minimum number of Gaussian bands required to fit both data sets while allowing for limited sharpening and shifting of peaks in the MCD (taken at low temperature). For both the CD and MCD spectra reported, multiple scans (5-20) were averaged.
VTVH MCD
VTVH MCD data were taken at 10,600 cm−1 and 8,500 cm−1 for MIOX(II,II) and MIOX(II,II)•MI and at 17,600 cm−1 for MIOX(II,III) and MIOX(II,III)•MI. Data were taken at fields of 0, ±0.35, ±0.7, ±1.4, ±2.1, ±2.8, ±3.5, ±4.2, ±4.7, ±5.6, ±6.3, and ±7.0 T and for temperatures of 2, 3, 5, 7.5, 10, 15, 20, and 25 K. MCD intensity was averaged over 100-200 scans for each field at each temperature. The reported data points are baseline-subtracted averages of the measurements for positive and negative field taken at the same temperature (their error bars represent the propagation of errors from the standard deviations). The reduced chi-squared value was used to judge the goodness of fit for the VTVH MCD data. The VTVH MCD data were fit with doublet and spin projection models as described in the Results and Analysis section. 53,66
Results and Analysis
MIOX(II,II)
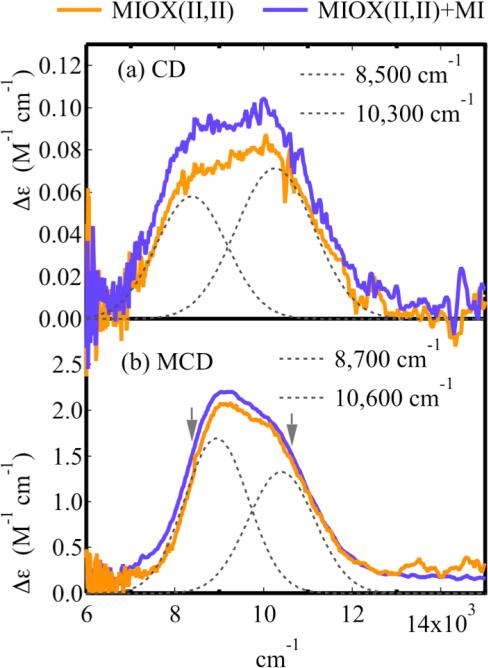
The binding of Fe(II) to apo-MIOX in the absence of O2 was investigated with near-IR (NIR) CD spectroscopy at 4 °C. Two positive bands at ~10,000 cm−1 grow in together with added Fe (Figure S1a). These features saturate at ~2 equivalents of Fe(II) (Figure S1b). Least squares fitting of the titration curve at 10,100 cm−1 (Figure S1a insert) to Equation S1 gave an Fe(II) dissociation constant (KD) of 0.2 mM, similar in magnitude to that of Δ9D (0.8 mM). 7 The CD spectrum of biferrous MIOX (MIOX(II,II)) showed no perturbation upon the addition of myo-inositol (MI) in substantial excess (25:1), with the relative intensities and peak positions of the bands unchanged (Figure 4a). The two bands in the CD spectrum of MIOX(II,II) were Gaussian resolved into bands with energies of 8,500 cm−1 and 10,300 cm−1 and were unaltered upon the addition of the glassing agent, sucrose (Figure S3).
Figure 4.
The CD and MCD spectra of MIOX(II,II). This includes without (orange) and with (purple) the addition of MI (25 fold excess) for the (a) CD and (b) MCD of biferrous MIOX. The grey arrows in (b) indicate where the VTVH MCD was taken. Protein concentrations were 1-2 mM.
Similarly, the NIR MCD spectrum of MIOX(II,II) taken at low temperature (2 K) and high field (7 T) was Gaussian resolved into two bands at 8,600 cm−1 and 10,400 cm−1 (Figure 4b). These bands correlate well with those in the CD, with slight differences in energy and diminished line-widths due to the lower temperature for MCD (2K vs. 4 °C). As in CD, the addition of MI did not perturb these spectral features (Figure 4b). The NIR CD and MCD spectral features are attributed to d → d transitions for a biferrous site. The CD and MCD spectra of MIOX(II,II) lack any features < 8,000 cm−1, and thus, the biferrous site does not contain a 4C or 5C square pyramidal Fe(II) center. 1,53 The presence of a band at 10,400 cm−1 indicates that at least one of the Fe(II) ions is 6C. The VTVH MCD results below distinguish between the 6C and 5C trigonal bipyramidal geometries possible for the second Fe(II).
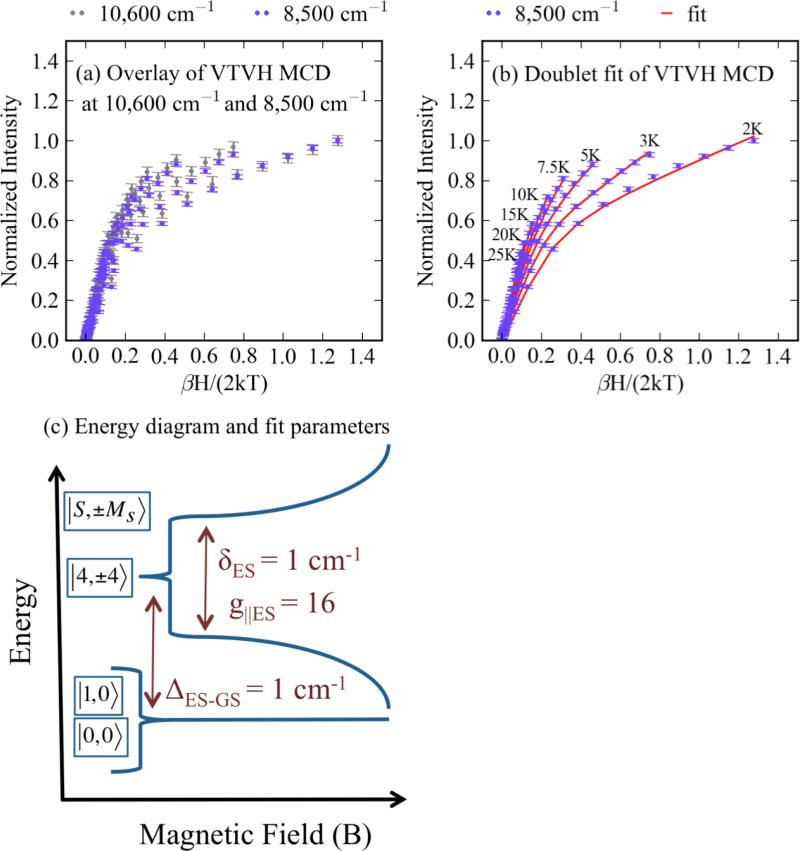
VTVH MCD data were taken on biferrous MIOX at 8,500 cm−1 and 10,500 cm−1 (Figure 4b arrows), and show that the signals decrease with increasing temperature (Figure 5a), confirming that the bands are associated with MCD C-terms. 67 No perturbation of the VTVH MCD saturation magnetization curves is observed upon addition of MI (Figure S2a and b). The VTVH MCD data taken at both 8,500 cm−1 and 10,500 cm−1 overlay (Figure 5a), indicating that the intensities of the two bands have equal contributions from both Fe(II) sites. If a 5C trigonal bipyramidal Fe(II) site were present, it would contribute intensity to the < 10,000 cm−1 band and would result in different VTVH MCD behaviors at 8,500 cm−1 and 10,500 cm−1. 1,53 Thus, both Fe(II) ions are 6C.
Figure 5.
The VTVH MCD of MIOX(II,II). For biferrous MIOX (2 mM), (a) shows overlay of the VTVH MCD at 8,500 cm−1 (blue) and 10,600 cm−1 (grey), (b) shows the fit of the VTVH MCD (data in blue, fit in red), and (c) shows the energy diagram of the doublet fit, including fit parameters.
The VTVH MCD data of an integer spin system may be fit according to a non-Kramers-doublet model in which the total MCD intensity is given by the sum of contributions from the different sublevels of the spin manifold of the biferrous site (Equation 1). 1,53,68,69
| (eq. 1) |
where , , and . The MCD contribution from the ith doublet is described in terms of C-term (Asat) and B-term (Bi) intensities, rhombic dimer zero-field splitting (ZFS) (δi), dimer g-values (g⊥i and g∥i), and energy Ei. The linear B-term allows for the mixing between different doublets induced by the applied magnetic field H. The factors αi and γi allow for the Boltzmann population over the spin manifold at a given temperature T where k is the Boltzmann constant. , where Mz and Mx,y are the transition dipole moments for the indicated direction. This model assumes that only one chromophore contributes to the MCD intensity at a given energy. Equation 1 can be modified to account for m chromophores contributing to the VTVH MCD intensity at a given energy (where each chromophore has a different (Asat)i, Bi, and P) by substituting these with:
This modified equation was employed to fit the VTVH MCD data in Figure 5a. Initial fits fixed the polarization ratios and g⊥ to zero. Treating the polarization ratios and g⊥ as adjustable parameters and allowing them to deviate from zero did not improve the fit. The best fit (Figure 5b, solid line) requires two singlet sublevels lowest in energy and a doublet excited state (ΔES-GS) at 1 cm−1 with g⊥ES = 16 and δES = 1 cm−1. Inclusion of a second excited state did not significantly improve the fit. These results (Figure 5c) indicate that two Ms = 0 levels are at the lowest energy and a sublevel with Ms = ±4 is the lowest lying excited state.
High spin Fe(II) has S = 2 and Ms = ±2, ±1, 0, which will split due to axial (D) and rhombic (E) ZFS. Additionally, the two irons interact through superexchange pathways provided by bridging ligands, which results in Stot = |S1 + S2| ... |S1 – S2| = 4, 3, 2, 1, 0 levels split by 8J, 6J, 4J, and 2J (Hex = –2JŜ1 · Ŝ2, where J quantifies the exchange coupling). The combined effects of exchange coupling and axial and rhombic ZSF for each Fe(II) ion and the Zeeman effect can be described by the spin-Hamiltonian in equation 2, which acts on the |S1, S2, Ms1, Ms2〉 uncoupled basis sets of Fe1 and Fe2. 1
| (eq. 2) |
The relationship from LF theory between the g-values of the Zeeman terms and D and E for an Fe(II) ion is given by equations 3a and 3b, where λ is the ground state spin-orbit coupling constant (−100 cm−1 for Fe(II), and k2 is the Steven's orbital reduction factor (< 1 due to covalency).
| (eq. 3a) |
| (eq. 3b) |
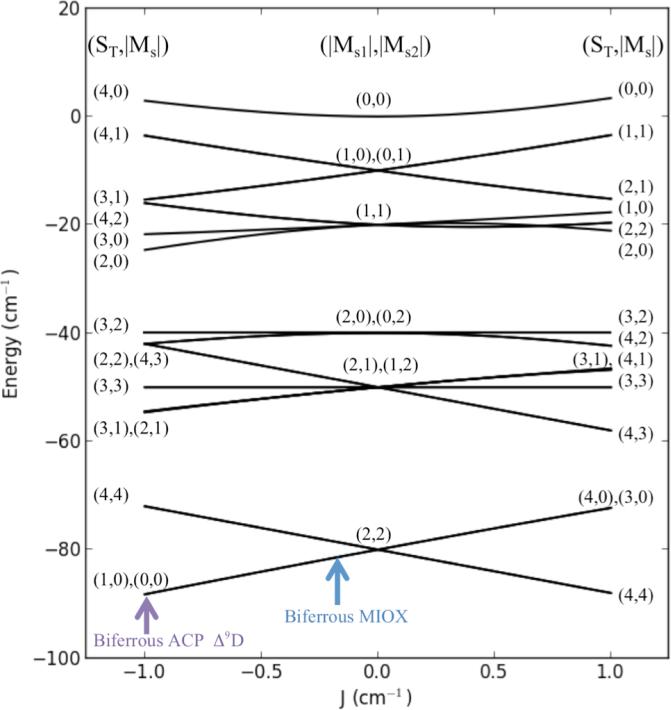
Applying equation 2 to the uncoupled ferrous basis set results in a 25×25 matrix, with eigenvectors and eigenvalues giving the spin-state wave functions and their energies for the coupled biferrous site. The ferrous |D|'s were constrained to be ≤ 15 cm−1, the maximum observed in model systems and ligand field calculations, and |E/D|'s were constrained to be ≤ 1/3. This spin Hamiltonian analysis shows that two Ms = 0 ground sublevels and a low-lying Ms = ±4 (g’ = 16) sublevel (as in Figure 5c) occur when D1 , D2, and J are all negative and J is small. The J/D correlation diagram for this case is given in Figure 6. In this diagram (D1 = D2 = −10 cm−1 and E1 = E2 = 0) two Ms = 0 sublevels are lowest in energy and an Ms = ±4 sublevel excited state is next in energy when −3 < J < 0 cm−1. Allowing E/D ratios to be 1/3 mixes the spin wave functions, splits the doublets, and alters the energies. The final fit shows that both Fe(II) sites have similar values of D (−8 to −12 cm−1) and E/D (0.18 and 0.2) and are weakly antiferromagnetic coupled (J = −0.1 cm−1).
Figure 6.
The correlation diagram for a coupled Fe(II) system with both ions having negative ZFS. Correlation diagram includes only the zero field energy levels for a coupled S1 = S2 = 2 system (Equation 3 where Hx,y,z = 0) with D1 = D2 = −10 cm−1 and (E/D)1 = (E/D)2 = 0. The exchange coupling (J) is varied from +1 to −1 cm−1. The middle represents the energy splitting for only ZFS contributions (thus, an uncoupled system). The left and right sides represent antiferromagnetic (J < 0) and ferromagnetic (J > 0) interactions. The relative positions of biferrous MIOX and ACP Δ9D are indicated by the blue and purple arrows.
Table 1 summarizes the parameters from this doublet fit, the results of the spin-Hamiltonian analysis of MIOX(II,II) and their comparison to equivalent data on reduced Δ9D, another binuclear ferrous enzyme with a similar spin manifold in the ground state. In the case of reduced Δ9D, the g = 16 doublet excited state is significantly higher in energy (10.6 cm−1 compared to 1 cm−1) correlating to a larger -J, resulting in a field-induced crossover of the ground state to be observable as an inflection point in the lowest temperature isotherm of the VTVH MCD data. 7 While no inflection point is present in the VTVH MCD data of MIOX(II,II) in Figure 5b, a g = 16 EPR signal was observed in previous studies. 14 Because the VTVH MCD data cannot be fit with a g = 16 ground state, the EPR data support the presence of a g∥ = 16 low lying excited state. The final result with two negative ZFS of similar values (D’s = −8 to −12 cm−1) is consistent with the assignment of two similar 6C Fe(II) sites. 1 The small antiferromagnetic coupling constant eliminates the possibility of a hydroxo bridge, but is consistent with the presence of one or more μ-1,3-carboxylate bridge(s). 1
Table 1.
Summary of the doublet fit and spin Hamiltonian parameters for biferrous MIOX and ACP Δ9D
| MIOX* | ACP Δ9D** | |||
|---|---|---|---|---|
| Doublet Fit Parameters | g\ es | 16.0 | 16.0 | |
| δes (cm−1) | 1.0 | 2.07 | ||
| Ms = ±4 | Atot | 1.0 | 1.6 | |
| B-term (%Atot) | −2.3 | −3 | ||
| Energy (cm−1) | 1.1 | 10.6 | ||
| B-term (arb) | 1.31 | 0.08 | ||
| Ms = 0 | Energy (cm−1) | 0 | 1.97 | |
| B-term (arb) | 1.06 | 0.02 | ||
| Ms = 0 | Energy (cm−1) | 0 | 0 | |
| Spin Hamiltonian Parameters | J (cm−1) | −0.1 | −1.0 | |
|
D1 (cm−1) (E/D)1 |
−8 to −12 0.18 |
−5 to −15 | ||
|
D2 (cm−1) (E/D)2 |
−8 to −12 0.2 |
−5 to −15 | ||
This work
ref 7
The CD, MCD, and VTVH MCD data of MIOX(II,II) and their analysis reveal a biferrous site with both Fe(II) ions coordinated by 6 ligands and bridged by one or more carboxylates. No change was observed upon the addition of excess MI, suggesting that MI does not bind to MIOX(II,II).
MIOX(II,III) CD and MCD
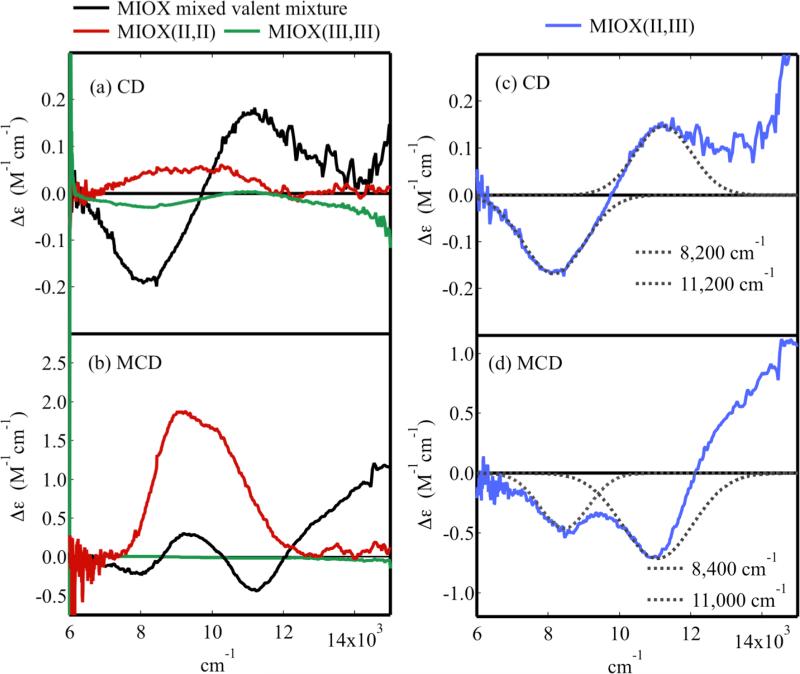
The mixed-valent form of MIOX was investigated by near IR CD and MCD spectroscopy. MIOX(II,III) samples were formed via the comporportionation of equal quantities of biferric and biferrous MIOX upon mixing them in the absence of O2 to give equal concentrations. The final product was a mixture of mixed-valent (60-70%) and equal quantities (15-20%) of the biferric and biferrous forms (quantification based on Mössbauer data taken after MI addition, see Figure S13 in supporting information). Figure 7a shows the CD spectrum of this mixture (in black) overlaid with the spectra of the pure biferrous (in red) and biferric (in green) forms, all collected at 5 °C. Intense negative ~8,000 cm−1 and positive ~11,000 cm−1 features are present in the spectrum of the sample containing the mixed-valent form. These features do not appear in the spectrum of either the biferrous or biferric form, and are, therefore, associated with the MIOX(II,III) species present in the mixture. Quantitative subtraction of the biferric and biferrous components from the spectrum and renormalization (Figure 7c) leads to little difference. Sucrose does not perturb the CD spectrum (Figure S5), which could be Gaussian resolved into two bands at 8,200 cm−1 and 11,200 cm−1 (Figure 7c).
Figure 7.
The CD and MCD of MIOX(II,III). The spectra of the mixed-valent MIOX mixture (black), MIOX(II,II) (red) and MIOX(III,III) (green) spectra are overlaid for (a) CD and (b) MCD. Subtraction of biferric and biferrous contaminants gives the (c) CD and (d) MCD of MIOX(II,III), which are Guassian resolved (grey). Protein concentrations were 1-3 mM.
The NIR MCD spectrum of the mixed-valent mixture was taken at 7 T and 2 K (Figure 7b, black). The mixed-valent mixture exhibits two negative features near ~8,000 cm−1 and ~11,000 cm−1 that do not appear in the spectrum of either the biferrous (Figure 7b, red) or biferric (Figure 7b, green) form. These features, therefore, belong to MIOX(II,III). Quantitative subtraction of the biferrous and biferric MCD components and renormalization shows that the two negative bands are the only features present in the MCD spectrum of MIOX(II,III) (Figure 7d). These features resolve into Gaussian peaks at 8,400 cm−1 and 11,000 cm−1, which correlate with those in the CD spectrum. The decrease in the width and small shift in energy are associated with the lower temperature of the MCD experiment. Previous EPR studies on mouse MIOX indicate the presence of only one mixed-valent species and thus, both bands are associated with the same species. 14 Possible near IR transitions for binuclear mixed-valent iron include ferrous and ferric d → d and intervalence charge transfer (IT) transitions. However, ferrous d → d transitions are expected to dominate the MCD spectrum as ferric d → d transitions are spin-forbidden and IT transitions have low MCD intensity. Both the ~8,000 cm−1 and ~11,000 cm−1 bands are observed in the CD and MCD spectra with significant intensity and are thus assigned as Fe(II) d → d transitions. Any IT or Fe(III) d → d transition present in this region be would be obscured by these intense Fe(II) d → d bands. The band of lowest energy is observed at ~8,000 cm−1, eliminating the possibility of 4C or 5C geometries. 1,53 The transitions are centered ~10,000 cm−1, which is consistent with a 6C site. Their larger than expected splitting of ~2,600-3,000 cm−1 indicates the presence of a weakly bound (likely H2O) ligand.
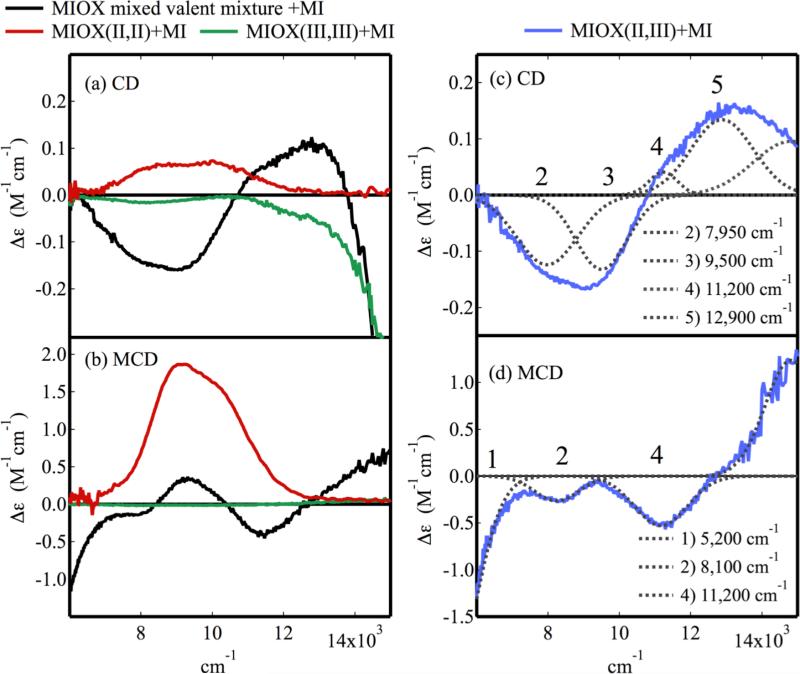
Figure 8a shows the effects of MI addition on the NIR CD spectrum (at 4°C) of the mixed-valent mixture (black). At least four bands are observed, one negative feature with a shoulder and one positive feature also with a shoulder. Given the intensities of these features, none appear to be present in the overlaid spectrum of either MIOX(II,II)•MI (Figure 8a, red) or MIOX(III,III)•MI (Figure 8a, green) spectra, indicating that they may arise from only the mixed-valent form. Subtraction of the biferrous and biferric components and renormalization gives the spectrum of MIOX(II,III)•MI in Figure 8c that resolves into 4 Gaussian bands labeled 2-5 (band 1 is observed at lower energy in the MCD spectrum, vide infra). The value of MI (0.7 ± 0.3 mM)17 would suggest full conversion to the bound form under the experimental conditions (51 mM MI concentration), and a higher MI concentration does not alter the CD spectrum (Figure S9). As the previous EPR study also does not indicate the presence of more than one mixed-valent species for MI-bound MIOX, bands 2-5 in the CD spectrum in Figure 8c are attributed to a single MI-bound MIOX(II,III) species. 14
Figure 8.
The CD and MCD of MIOX(II,III)•MI. The spectra of the mixed-valent MIOX mixture (black), biferrous (red) and biferric (green) MIOX taken after addition of MI are overlaid for (a) CD and (b) MCD. Subtraction of the biferric and biferrous contaminants gives the (c) CD and (d) MCD of MIOX(II,III)•MI, which are Guassian resolved (grey). Protein concentrations were 1-3 mM with 25-fold excess MI.
The MCD spectrum of the mixed-valent mixture with added MI taken at 7 T and 2 K is shown in Figure 8b (black). Three negative features at ~5,500 cm−1, ~8,000 cm−1, and ~11,000 cm−1 in the mixed-valent mixture are not present in the MCD spectra of either MIOX(II,II)•MI or MIOX(III,III)•MI (red and green overlay). Thus, these features are attributed to the MIOX(II,III)•MI species. Subtraction of the biferrous and biferric components and renormalization give the MCD spectrum of MIOX(II,III)•MI (Figure 8d). Gaussian fits show that these bands (labeled 1, 2 and 4) are positioned at 5,200 cm−1, 8,100 cm−1, and 11,200 cm−1. Thus, MIOX(II,III)•MI has a total of five bands in the combined NIR CD and MCD spectra (Figure 8c and d, bands 1-5). Two LF bands are associated with Fe(II), and thus, the other 3 transitions must be either spin-forbidden d → d (which gain intensity via exchange coupling and mixing with nearby CT bands) or IT transitions. Band 1 is assigned to a Fe(II) d → d transition as it is intense in the MCD and at < 7,000 cm−1 (inconsistent with Fe(III) LF transitions). 54,62-64 This assignment requires that Fe(II) is either 4C or 5C square pyramidal. 1,70 Band 2 at 7,950 cm−1 is assigned as a 6A1 → 4T1 Fe(III) spin forbidden d → d transition as it correlates to an ~8,000 cm−1 band in the NIR CD of MIOX(III,III)•MI (Figure S10) which has only spin forbidden d → d transitions in this region. The low energy of this high-spin Fe(III) 6A1 → 4T1 transition indicates a strong ligand field, and thus a 6C Fe(III) site. 54,62-64 These assignments leave band 4, the only other NIR MCD feature, to be assigned as the other Fe(II) d → d transition. Thus, the Fe(II) site in MIOX(II,III)•MI has ligand field transitions at 5,200 cm−1 and 11,200 cm−1 and has a 5C square pyramidal geometry. Band 3 in the CD spectrum has no MCD intensity and no corresponding band in the biferric form. Thus, it likely arises from an IT transition.
Band 5 may arise from either an IT transition or another component of a Fe(III) spin forbidden LF transition. In addition to the lower-energy bands, there is also a shoulder at ~14,500 cm−1 in the extended MCD spectrum of MIOX(II,III)•MI (Figure S11). It is unlikely to arise from an IT transition (as it appears in the MCD); its intensity is comparable to LF transitions, but its energy is too high for an Fe(II) LF transition. Its energy and intensity are consistent with a 6C Fe(III) 6A1 → 4T2 transition (5C Fe(III) 6A1 → 4T2 transitions are at > 16,100 cm−1.54,62-64 It is likely that IT and Fe(III) LF transitions are also present in the MIOX(II,III) spectra in Figure 7 but are obscured by the intense Fe(II) LF transitions of the 6C site. A summary of band assignments is given in Table 2. The CD and MCD spectra of MIOX(II,III) and MIOX(II,III)•MI show that the ferrous site converts from a 6C to a 5C square pyramidal geometry upon the addition of MI.
Table 2.
Summary of CD and MCD Gaussian bands for the CD and MCD of MIOX(II,III)•MI
| Bands | Assignment | Energy in CD (cm−1) | Energy in MCD (cm−1) |
|---|---|---|---|
| 1 | Fe(II) d→d(z2) | -- | 5,200 |
| 2 | Fe(III) d→d (6A1→4T1) | 8,100 | 7,950 |
| 3 | IT | 9,500 | -- |
| 4 | Fe(II) d→d (x2-y2) | 11,200 | 11,200 |
| 5 | IT or Fe(III) d→d | 12,900 | -- |
MIOX(II,III) VTVH MCD
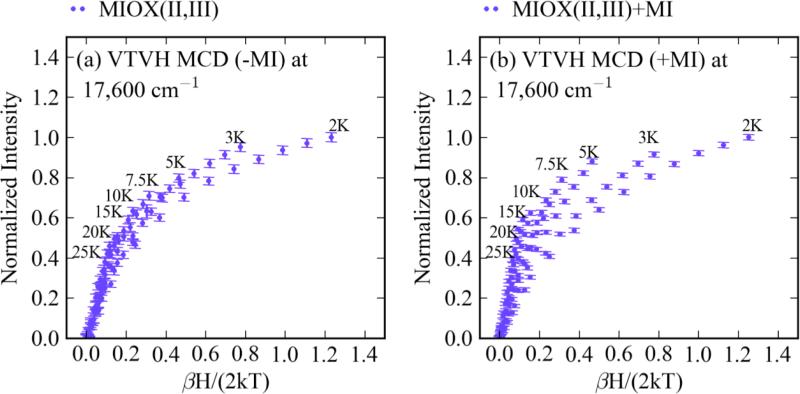
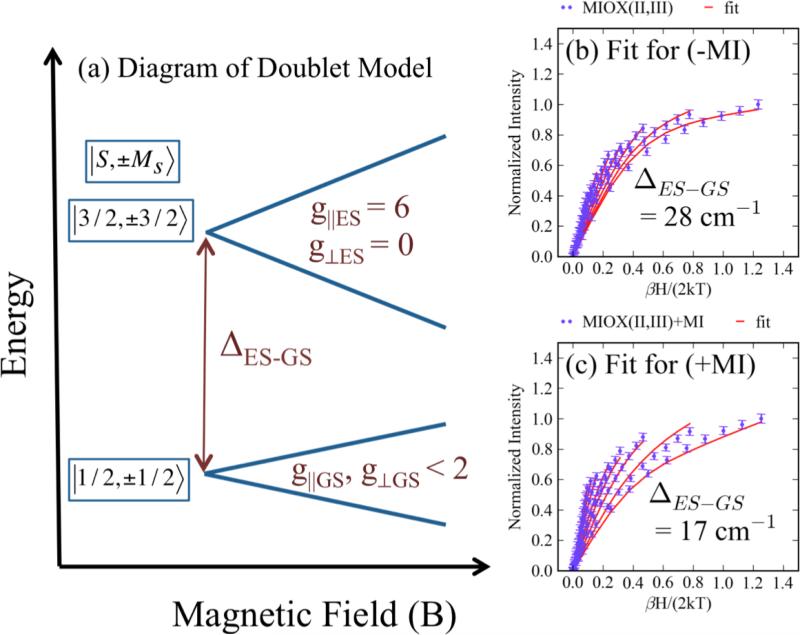
Obtaining VTVH MCD on the LF transitions of MIOX(II,III) forms is precluded by the presence of the overlaying bands from the biferrous contaminant. VTVH MCD data were therefore taken without and with MI bound on a band in the charge-transfer region (a ligand → Fe(III) CT) at 17,600 cm−1 (Figure S11) where the biferrous and biferric species do not contribute (Figure 9). The VTVH MCD data of the mixed-valent MIOX forms were fit using eq. 1 applied to an Fe(II)Fe(III) site. The antiferromagnetic coupling of the Fe(III) ion with S = 5/2 and the Fe(II) ion with S = 2 results in an Stot = 1/2 Kramer’s doublet ground state (thus, δi = 0 in eq. 1). The lowest-temperature isotherm was fit with the ground state g∥ (1.95 for MIOX(II,III) and MIOX(II,III)•MI) and g⊥ (1.66 for MIOX(II,III); 1.81 for MIOX(II,III)•MI) taken from EPR data. 14Mz/Mx,y, (Asat)0, and B0 and were adjustable parameters. Fitting the also isotherms also required the inclusion of the excited doublet state with g∥ = 6.00 and g⊥ = 0.00 (Figure 10a) for both MIOX(II,III) and MIOX(II,III)•MI forms. The best fits are shown in Figure 10b (for MIOX(II,III)) and c (for MIOX(II,III)•MI) with fit parameters listed in Table 3. The optimized fits showed the presence of an excited state at ~28 cm−1 for MIOX(II,III) and at ~17 cm−1 for MIOX(II,III)•MI. Inclusion of a third excited doublet did not significantly improve either fit. These data indicate that the excited state for both MIOX(II,III) and MIOX(II,III)•MI is an Ms = ±3/2 doublet.
Figure 9.
The VTVH MCD of MIOX(II,III) and MIOX(II,III)•MI. The VTVH MCD was taken at 17,600 cm−1 for MIOX(II,III) (1-2 mM) (a) without MI and (b) with MI (25 fold excess).
Figure 10.
Doublet fits for the VTVH MCD of MIOX(II,III) and MIOX(II,III)•MI. The (a) diagram of the doublet model used for fitting the VTVH MCD taken at 17,600 cm−1 for MIOX(II,III) (1-2 mM) (b) without MI and (c) with MI (25 fold excess) is shown.
Table 3.
Summary of the doublet fit parameters for MIOX(II,III) without and with MI
| Spin Wavefunction | Doublet Parameters | -MI | +MI |
|---|---|---|---|
| Ms = ±3/2 | g∥es | 6.0 | 6.0 |
| g⟂es | 0 | 0 | |
| Asat | 15.8 | 1.7 | |
| MZ/Mx,y | 0.33 | 0.35 | |
| B-term (%Asat) | −2.8 | 0.2 | |
| Energy (cm−1) | 28 | 17 | |
| Ms = ±1/2 | g∥es | 1.95 | 1.95 |
| g⟂es | 1.66 | 1.81 | |
| Asat | 13.8 | 24.0 | |
| MZ/Mx,y | 0.33 | 0.35 | |
| B-term (%Asat) | 0.2 | 0.3 | |
| Energy (cm−1) | 0 | 0 | |
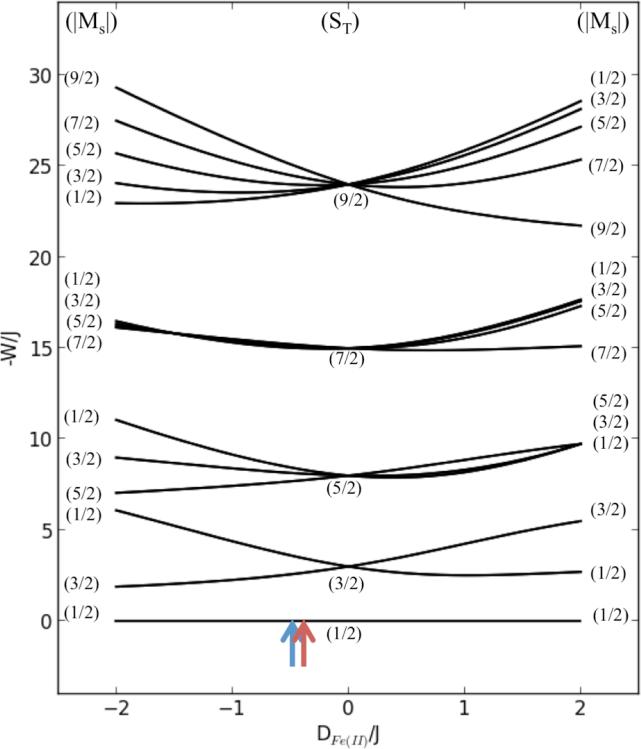
A high-spin ferric center has a 6A1 ground state with S = 5/2. Coupling this center to a high-spin ferrous (S = 2) center results in Stot = 9/2, 7/2, 5/2, 3/2, and 1/2 states. The exchange interaction splits these levels by 9J, 7J, 5J, and 3J. All but the Stot = 1/2 split due to ZFS with a magnitude and dictated by the ferrous site (the ferric contribution is small, i.e. |DFe(II| >> |DFe(III)|).1 Applying Equation 2 to the uncoupled |S1, M1, S2, M2〉 Fe(II)Fe(III) system produces a 30 × 30 matrix, with eigenvectors and eigenvalues giving the sublevel wave functions and their energies. The energy level diagram for this system is given in Figure 11, where W is the energy of the states and the ZFS of the ferric center is neglected (DFe(III) = 0). The doublet fits for both MIOX(II,III) and MIOX(II,III)•MI indicate an Stot = 3/2 excited state with its Ms = ±3/2 component lowest in energy. This occurs only when DFe(II)/J < 0. Given that Fe(II) and Fe(III) are antiferromagnetically coupled (Stot = 1/2, thus J < 0) in both MIOX(II,III) and MIOX(II,III)•MI, DFe(II) is positive for both species. Values of |DFe(II)/J| of ~0.40 and ~0.34 are estimated for MIOX(II,III) and MIOX(II,III)•MI, respectively using Figure 11 and the excited state energies from the doublet fits. Estimates of the values of DFe(II) can be obtained from eq. 3a with the values of gFe(II) calculated from the EPR-determined dimer g-values using vector coupling , where values of gFe(III) are assumed be 2.0023 and with k2 = 0.8 and λ = −100 cm−1. 54,62,71 This analysis gives values of DFe(II) of of 4.2 cm−1 and 2.2 cm−1 for MIOX(II,III) and MIOX(II,III)•MI, respectively. From these values, one can calculate values of J of −10.5 and −6.5 cm−1 for MIOX(II,III) and MIOX(II,III)•MI, respectively.
Figure 11.
The correlation diagram for a Fe(II)Fe(III) system. The energy correlation diagram is for a coupled S1 = 2 and S2 = 5/2 system at zero field (Eq. 3). DFe(III) and E/D values were set to zero. The relative positions for MIOX without and with MI are indicated by the blue and red arrows, respectively.
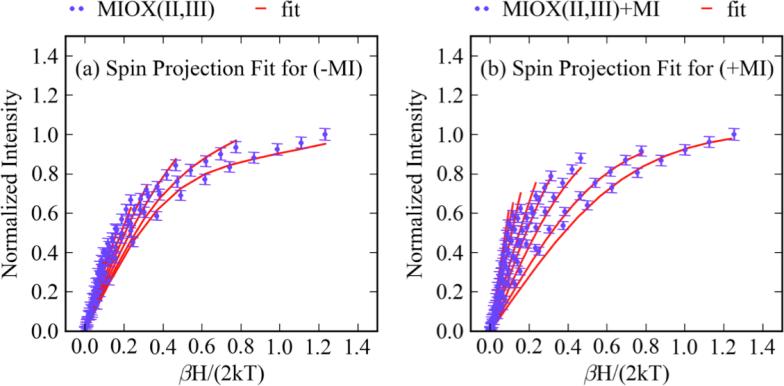
These spin-Hamiltonian parameters can be more accurately determined (without the assumption of eq. 3 which considers only the contributions of ΔS = 0 excited states to the ZFS) by directly fitting eq. 2 to the VTVH MCD data using a spin projection model (spin projection of the Fe(III) in the Fe(II)Fe(III) site). 66 Equation 4 uses the spin-expectation values of the different spin sublevels defined by eq. 2 to compute MCD intensities (Δε):
| (Eq. 4) |
where S is the spin of the system, E is the energy of the source, γ is a collection of constants, 〈Sx〉i, 〈Sy〉i, and 〈Sz〉i are spin expectation values for the ith spin sublevel in the indicated direction with Boltzmann population Ni, lx, ly, and lz are directional vectors associated with the propagation of light relative to the molecular axis, and , , and are the effective transition-moment products. Previous VTVH MCD fitting to equation 4 utilized a simplex routine to sample solution space. This routine is inefficient and may find a local, rather than global, minimum. To improve sampling of solution space and ensure a global search, a genetic algorithmic approach was developed (Section 2 in Supporting Information). Optimized spin-Hamiltonian parameters for MIOX(II,III) and MIOX(II,III)•MI are provided in Table 4, and the best fits are shown in Figure 12 a and b. It should be noted that all parameters were allowed to vary in the fitting routine, except for the principal g-values of the Fe(III) site, which were fixed at 2.0023. Initial fitting attempts assumed an axial Fe(II) center (i.e. E/D = 0 and gx = gy), as previously indicated by EPR studies. While the VTVH MCD data of MIOX(II,III)•MI were fit satisfactorily with an axial model, those for MIOX(II,III) required some rhombic character. For MIOX(II,III), the fit gives J = −12.3 cm−1, DFe(III) = 0.01 cm−1, DFe(II) = 5.9 cm−1 and (E/D)Fe(II) = 0.11 with gxFe(III) = 2.27 gyFe(II) = 2.15 and gzFe(II) = 2.07. Values of g were calculated for the ground state doublet of the Fe(II)Fe(III) site with these spin-Hamiltonian parameters and found to be gz = 1.94, gy = 1.71, and gy = 1.55. The EPR spectrum for mouse MIOX(II,III) shows a sharp g∥ = 1.95 signal and a broad g⊥ = 1.66 signal. 14 The breadth of the g⊥ signal had previously been attributed to g-strain. The gx and gy values obtained from this spin projection fit are positioned well within the EPR spectral envelope (Figure S12). For MIOX(II,III)•MI, J = −8.6 cm−1, DFe(III) = 0.21 cm−1, and DFe(II) = 3.9 cm−1 with g⊥Fe(II) = 2.10 and g∥Fe(II) = 2.05. Doublet dimer g-values were calculated to be g⊥ = 1.96 and g⊥ = 1.80, consistent with experiment (g∥ = 1.95 and g⊥ = 1.81). 14 Thus, upon MI binding, the magnitudes of both J and DFe(II) decrease.
Table 4.
Summary of the spin Hamiltonian parameters from the spin projection fits of MIOX(II,III) without and with MI.
| Spin Hamiltonian Parameters | -MI | +MI | |
|---|---|---|---|
| J (cm−1) | −12.3 | −8.6 | |
| Fe(II) ZFS and Zeeman Parameters | D (cm−1) | 5.9 | 3.9 |
| E/D | 0.11 | 0.02 | |
| gx | 2.27 | 2.10 | |
| gy | 2.15 | 2.10 | |
| gz | 2.07 | 2.05 | |
| Fe(III) ZFS and Zeeman Parameters | D (cm−1) | 0.01 | 0.21 |
| E/D | 0.01 | 0.04 | |
| gx | 2.00 | 2.00 | |
| gy | 2.00 | 2.00 | |
| gz | 2.00 | 2.00 | |
Figure 12.
Spin projection fits for the VTVH MCD of MIOX(II,III) and MIOX(II,III)•MI. The fits are shown in red and are for the VTVH MCD taken at 17,600 cm−1 for MIOX(II,III) (1-2 mM) (a) without and (b) with MI (25 fold excess).
Upon MI addition, the DFe(II) of MIOX(II,III) decreases from 5.9 to 3.9 cm−1 and -J decreases from 12.3 to 8.6 cm−1. The values of J indicate that the Fe(II) and Fe(III) are bridged by a μ-OH− in both forms. 1 The decrease in -J suggests that the OH− bridge is weakened upon MI binding. The decrease in DFe(II) is related to the geometry change of the Fe(II) center. 53 Axial distortions will split the t2g set of d-orbitals into the the dxz,yz and the dxy levels. For the positive DFe(II) found experimentally, the dxy orbital is lower in energy, and DFe(II) is inversely proportional to the energy difference between the dxy and the dxz,yz levels. Removing a ligand from the 6C Fe(II) would increase this energy splitting and decrease DFe(II). Thus, the decrease in DFe(II) observed experimentally is consistent with the results from the MCD spectra that the Fe(II) site undergoes a change from 6C to 5C geometry upon binding of MI.
The CD- and MCD-derived excited-state splittings and the VTVH MCD derived ground-state splittings show that upon the addition of MI, the 6C Fe(II) in MIOX(II,III) loses a weak (water) ligand to become 5C. The exchange coupling, J, also decreases, indicating the MI binding weakens the hydroxo bridge.
Discussion
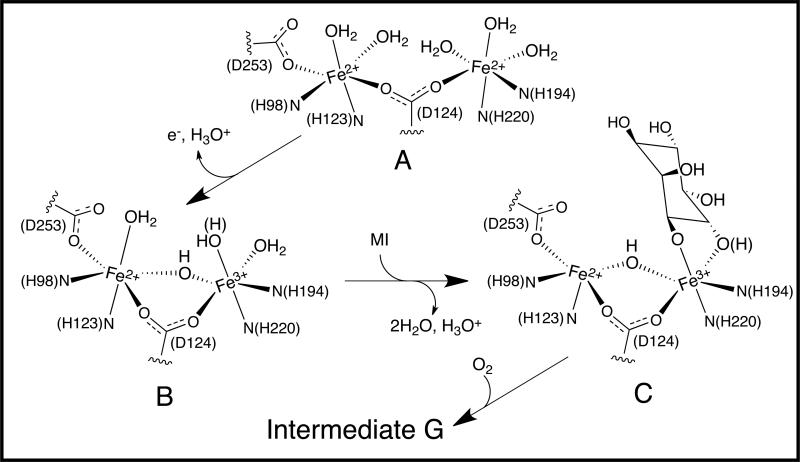
The CD, MCD and VTVH MCD data show that biferrous MIOX has two Fe(II) centers with ligand field transitions at ~10,000 cm−1 split by ~2,000 cm−1 and similar values of ZFS. Thus, both Fe(II) sites are 6C. The VTVH MCD analysis also shows weak antiferromagnetic coupling (−0.1 cm−1), which indicates the presence of only μ-1,3-bridging carboxylates. MI addition does not perturb the spectra of MIOX(II,II), indicating that it does not bind. The crystallographic data for oxidized (biferric or mixed-valent) MIOX show that the protein contributes 2His ligands to each Fe, a monodentate carboxylate ligand to one of the Fe ions, and a μ-1,3 carboxylate bridge.16,18 The spectroscopic and crystallographic data indicate that biferrous MIOX has the structure illustrated in Figure 13A with solvent completing the coordination spheres of both ferrous centers. Most biferrous proteins have weak μ-1,3 carboxylate bridges that are inefficient superexchange pathways for electron transfer between the Fe(II) sites. O2 thus must bridge the two irons in order to be activated by an inner-sphere 2e− reduction. This mechanism requires open coordination sites on each Fe(II) center. While the biferrous species of MIOX has the weak μ-1,3 carboxylate bridge, it is coordinatively saturated with no open positions for O2 to bridge. These structural aspects account for its modest reactivity toward O2. This reaction has an associated rate constant (k~2×10³ M−1s−1) 50-fold less than the rate constant for the productive combination of MIOX(II,III)•MI with O2 (k~105 M−1s−1) and generates only the inactive biferric state, possibly by an outer-sphere process.
Figure 13.
Proposed structural models for (A) MIOX(II,II), (B) MIOX(II,III) and (C) MIOX(II,III)•MI.
The CD and MCD spectra of mixed-valent MIOX show two features (at ~8,000 cm−1 and ~11,000 cm−1) with VTVH MCD analysis showing a DFe(II) ~ 6 cm−1 with some rhombicity (E/D ~ 0.11). These data are consistent with a 6C Fe(II) site with a weakly bound water ligand. The VTVH MCD analysis also gives a -J of 12 cm−1, which requires a hydroxo-bridge between the Fe(II) and Fe(III) centers. These spectroscopic data (and crystallographic data for protein ligation) 16,18 suggest that MIOX(II,III) has the structure in Figure 13B. MIOX(II,III) in the absence of substrate is also slow to react with dioxygen and is oxidized to the biferric state without O2 activation. These spectroscopic results suggest that the unreactive nature of MIOX(II,III) can also be attributed to the saturated coordination (6C) of the Fe(II) center, preventing its inner-sphere activation of O2.
Upon MI addition, the Fe(II) LF features are strongly perturbed. In MIOX(II,III)•MI, there is an intense (in MCD) low energy LF band (~5,200 cm−1) and a higher energy LF band (~11,200 cm−1) indicating that the Fe(II) site has become 5C square pyramidal upon MI binding. The VTVH MCD analysis also shows that DFe(II) decreases from ~6 to ~4 cm−1 upon MI addition, consistent with this 6C to 5C conversion. The increased splitting of the Fe(II) LF transitions upon decreased coordination allows the observation of a weak ferric spin forbidden LF transition at ~8,000 cm−1. The low energy of this 6A1 → 4T1 transition indicates a 6C ferric site. The VTVH MCD analysis shows that -J also decreases upon MI addition (from ~12 to ~9 cm−1) suggesting a weakened hydroxo-bridge. It should be noted that a previous analysis of the power saturation of the EPR intensity (Orbach relaxation), which measures the energy difference between the ground and excited state, showed a decrease in -J from 20 to 10 cm−1 upon MI addition to MIOX(II,III). 16 The study overestimated the magnitude and change in J for two reasons: (1) ZFS was neglected, and (2) a conversion factor of ~0.7 cm−1K−1 (Boltzmann’s constant) was not included in the Orbach analysis. The decrease in the energy of the excited state upon MI binding is thus the result of both a decrease in the exchange coupling associated with a weakened hydroxo-bridge and a decrease in the ZFS of the Fe(II) reflecting the 6C to 5C Fe(II) structural change. Crystal structures have shown bidentate binding of MI to only one Fe. 16,18 It has been proposed that MI binds to the ferric site because it is a stronger Lewis acid and able to deprotonate the oxygen donor(s) of MI and activate the aliphatic group for H-atom abstraction and ring cleavage. 17,18 MI coordination to the Fe(III) is consistent with its 6C nature based on the 4T1 LF transition energy. It should be noted that the two available crystal structures for MIOX have MI bound with both Fe sites 6C. 16,18 However, in one crystal structure, inosose-1 rather than inositol is bound, and in both structures, the oxidation state of the active site in the crystals was most likely biferric rather than the active Fe(II)Fe(III) species. Correlating the CD, MCD/VTVH MCD data with the results of crystallography gives the structural model for MIOX(II,III)•MI shown in Figure 13C.
These structural models provide insight into the mechanism of MI binding and its activation of the O2 reaction. The His-rich ligand field of MIOX results in a coordinatively saturated biferrous site that must be oxidized to the Fe(II)Fe(III) state to bind MI. The increased acidity of the Fe(III) leads to the formation of the μ-OH− bridge and allows MI to bind (bidentate). The alkoxo groups on MI provide more electron donation and stronger binding to the Fe(III) than the replaced solvent due to increased basicity. This increased donation in turn weakens the Fe(III)-(μ-OH) bond. This change in bonding allows the bridging hydroxo to increase its electron donation to the Fe(II), which weakens the Fe(II)-OH2 bond and leads to water loss, producing the observed 5C Fe(II) site that can react with O2 by an inner-sphere mechanism. In addition to the structural change at the ferrous center, the increased charge donation from the bridged hydroxo to the Fe(II) would increase its oxidation potential and favor the one-electron reduction of O2 to form the superoxide bound intermediate G that abstracts the C1-H from the substrate. Thus, rather than the more generally observed 2e− reduction of O2 by 2Fe(II) to form a peroxo intermediate for 2e− electrophilic attack on a substrate, MIOX uses an Fe(II)Fe(III) site for 1e− reduction of O2 to form a superoxo intermediate for 1e− H-atom abstraction.
Supplementary Material
Acknowledgements
The NSF Biochemistry Program Grant (MCB-0919027 to E.I.S.) and the National Institutes of Health (DK-074641 to J.M.B. and C.K.) provided financial support for this research.
Footnotes
Supporting Information Available
The CD Fe(II) titration of MIOX; The overlay of the VTVH MCD of MIOX(II,II) with and without MI addition; The CD of MIOX(II,II), MIOX(II,III), and MIOX(II,III)•MI with and without sucrose addition; MCD spectra of MIOX(II,II), MIOX(II,III) and MIOX(II,III)•MI at different temperatures and magnetic fields showing C-term behavior; The CD of MIOX(II,III)•MI with different MI concentrations; Close up of the CD of MIOX(III,III)•MI; The extended MCD spectra of MIOX(II,III) and MIOX(II,III)•MI; Effective g-values of MIOX(II,III) determined from the VTVH MCD shown on the EPR of MIOX(II,III); Mössbauer spectra of MIOX(II,II), MIOX(III,III)•MI, and MIOX(II,III)•MI; Genetic Algorithmic approach to fitting VTVH MCD data to Equation 4. This information is available free of charge via the internet at http://pubs.acs.org/.
References
- 1.Solomon EI, Brunold TC, Davis MI, Kemsley JN, Lee SK, Lehnert N, Neese F, Skulan AJ, Yang YS, Zhou J. Chem. Rev. 2000;100:235–349. doi: 10.1021/cr9900275. [DOI] [PubMed] [Google Scholar]
- 2.Andrews SC. Biochimica et Biophysica Acta (BBA) - General Subjects. 2010;1800:691–705. doi: 10.1016/j.bbagen.2010.05.010. [DOI] [PubMed] [Google Scholar]
- 3.Theil EC. J. Nutr. 2003;133:1549S–1553S. doi: 10.1093/jn/133.5.1549S. [DOI] [PubMed] [Google Scholar]
- 4.Shao J, Zhou B, Chu B, Yen Y. Curr. Cancer Drug Targets. 2006;6:409–431. doi: 10.2174/156800906777723949. [DOI] [PubMed] [Google Scholar]
- 5.Stubbe J. Curr. Opin. Chem. Biol. 2003;7:183–188. doi: 10.1016/s1367-5931(03)00025-5. [DOI] [PubMed] [Google Scholar]
- 6.Kokatnur MG, Oalmann MC, Johnson WD, Malcom GT, Strong JP. Am. J. Clin. Nutr. 1979;32:2198–2205. doi: 10.1093/ajcn/32.11.2198. [DOI] [PubMed] [Google Scholar]
- 7.Yang YS, Broadwater JA, Pulver SC, Fox BG, Solomon EI. J. Am. Chem. Soc. 1999;121:2770–2783. [Google Scholar]
- 8.Lindqvist Y, Huang W, Schneider G, Shanklin J. Embo J. 1996;15:4081–4092. [PMC free article] [PubMed] [Google Scholar]
- 9.Howarth RW, Santoro R, Ingraffea A. Clim. Change. 2011;106:679–690. [Google Scholar]
- 10.Surampudi S, Narayanan SR, Vamos E, Frank H, Halpert G, LaConti A, Kosek J, Prakash GKS, Olah GA. J. Power Sources. 1994;47:377–385. [Google Scholar]
- 11.Whittington DA, Lippard SJ. J. Am. Chem. Soc. 2001;123:827–838. doi: 10.1021/ja003240n. [DOI] [PubMed] [Google Scholar]
- 12.Mitic N, Schwartz JK, Brazeau BJ, Lipscomb JD, Solomon EI. Biochem. 2008;47:8386–8397. doi: 10.1021/bi800818w. [DOI] [PMC free article] [PubMed] [Google Scholar]
- 13.Lipscomb JD. Annu Rev Microbiol. 1994;48:371–99. doi: 10.1146/annurev.mi.48.100194.002103. [DOI] [PubMed] [Google Scholar]
- 14.Xing G, Hoffart LM, Diao Y, Prabhu KS, Arner RJ, Reddy CC, Krebs C, Bollinger JM., Jr. Biochemistry. 2006;45:5393–5401. doi: 10.1021/bi0519607. [DOI] [PubMed] [Google Scholar]
- 15.Brown PM, Caradoc-Davies TT, Dickson JM, Cooper GJ, Loomes KM, Baker EN. Acta Crystallograph Sect. F Struct. Biol. Cryst. Commun. 2006;62:811–813. doi: 10.1107/S1744309106028144. [DOI] [PMC free article] [PubMed] [Google Scholar]
- 16.Thorsell AG, Persson C, Voevodskaya N, Busam RD, Hammarstrom M, Graslund S, Graslund A, Hallberg BM. J. Biol. Chem. 2008;283:15209–15216. doi: 10.1074/jbc.M800348200. [DOI] [PMC free article] [PubMed] [Google Scholar]
- 17.Bollinger JM, Jr., Diao Y, Matthews ML, Xing G, Krebs C. Dalton Trans. 2009;0:905–914. doi: 10.1039/b811885j. [DOI] [PMC free article] [PubMed] [Google Scholar]
- 18.Brown PM, Caradoc-Davies TT, Dickson JM, Cooper GJ, Loomes KM, Baker EN. Proc. Natl. Acad. Sci. U.S.A. 2006;103:15032–15037. doi: 10.1073/pnas.0605143103. [DOI] [PMC free article] [PubMed] [Google Scholar]
- 19.Arner RJ, Prabhu KS, Thompson JT, Hildenbrandt GR, Liken AD, Reddy CC. Biochem. J. 2001;360:313–320. doi: 10.1042/0264-6021:3600313. [DOI] [PMC free article] [PubMed] [Google Scholar]
- 20.Bustamante E, Pedersen PL. Proc. Natl. Acad. Sci. U. S. A. 1977;74:3735–3739. doi: 10.1073/pnas.74.9.3735. [DOI] [PMC free article] [PubMed] [Google Scholar]
- 21.Eisenberg F., Jr J. Biol. Chem. 1967;242:1375–1382. [PubMed] [Google Scholar]
- 22.Naccarato WF, Ray RE, Wells WW. Arch. Biochem. Biophys. 1974;164:194–201. doi: 10.1016/0003-9861(74)90022-8. [DOI] [PubMed] [Google Scholar]
- 23.Holub BJ. Annu. Rev. Nutr. 1986;6:563–597. doi: 10.1146/annurev.nu.06.070186.003023. [DOI] [PubMed] [Google Scholar]
- 24.Berridge MJ, Irvine RF. Nature. 1989;341:197–205. doi: 10.1038/341197a0. [DOI] [PubMed] [Google Scholar]
- 25.Zhang X, Majerus PW. Semin. Cell Dev. Biol. 1998;9:153–160. doi: 10.1006/scdb.1997.0220. [DOI] [PubMed] [Google Scholar]
- 26.Dutton G, editor. Glucuronic acid Free and Combined: Chemistry, Biochemistry, Pharmacology, and Medicine. Elsevier; 1966. [Google Scholar]
- 27.Xing G, Diao Y, Hoffart LM, Barr EW, Prabhu KS, Arner RJ, Reddy CC, Krebs C, Bollinger JM., Jr. Proc. Natl. Acad. Sci. USA. 2006;103:6130–6135. doi: 10.1073/pnas.0508473103. [DOI] [PMC free article] [PubMed] [Google Scholar]
- 28.Xing G, Barr EW, Diao Y, Hoffart LM, Prabhu KS, Arner RJ, Reddy CC, Krebs C, Bollinger JM., Jr. Biochem. 2006;45:5402–5412. doi: 10.1021/bi0526276. [DOI] [PubMed] [Google Scholar]
- 29.Charalampous FC, Lyras C. J. Biol. Chem. 1957;228:1–13. [PubMed] [Google Scholar]
- 30.Charalampous FC. J. Biol. Chem. 1959;234:220–227. [PubMed] [Google Scholar]
- 31.Yang B, Hodgkinson A, Millward BA, Demaine AG. Int J Diabetes Mellitus. 2010;2:169–174. [Google Scholar]
- 32.Moskala R, Reddy CC, Minard RD, Hamilton GA. Biochem. Biophys. Res. Commun. 1981;99:107–113. doi: 10.1016/0006-291x(81)91719-8. [DOI] [PubMed] [Google Scholar]
- 33.Deranieh RM, He Q, Caruso JA, Greenberg ML. J. Biol. Chem. 2013;288:26822–26833. doi: 10.1074/jbc.M113.479121. [DOI] [PMC free article] [PubMed] [Google Scholar]
- 34.Di Paolo G, De Camilli P. Nature. 2006;443:651–657. doi: 10.1038/nature05185. [DOI] [PubMed] [Google Scholar]
- 35.Croze ML, Soulage CO. Biochimie. 2013;95:1811–1827. doi: 10.1016/j.biochi.2013.05.011. [DOI] [PubMed] [Google Scholar]
- 36.Vucenik I, Shamsuddin AM. J. Nutr. 2003;133:3778S–3784S. doi: 10.1093/jn/133.11.3778S. [DOI] [PubMed] [Google Scholar]
- 37.Brand A, Richter-Landsberg C, Leibfritz D. Dev. Neurosci. 1993;15:289–298. doi: 10.1159/000111347. [DOI] [PubMed] [Google Scholar]
- 38.Haris M, Cai K, Singh A, Hariharan H, Reddy R. Neuroimage. 2011;54:2079–2085. doi: 10.1016/j.neuroimage.2010.10.017. [DOI] [PMC free article] [PubMed] [Google Scholar]
- 39.Cimini D, De Rosa M, Schiraldi C. Biotechnol. J. 2012;7:237–250. doi: 10.1002/biot.201100242. [DOI] [PubMed] [Google Scholar]
- 40.Wei PP, Skulan AJ, Mitic N, Yang YS, Saleh L, Bollinger JM, Jr., Solomon EI. J. Am. Chem. Soc. 2004;126:3777–3788. doi: 10.1021/ja0374731. [DOI] [PubMed] [Google Scholar]
- 41.Liu KE, Wang D, Huynh BH, Edmondson DE, Salifoglou A, Lippard SJ. J. Am. Chem. Soc. 1994;116:7465–7466. [Google Scholar]
- 42.Tong WH, Chen S, Lloyd SG, Edmondson DE, Huynh BH, Stubbe J. J. Am. Chem. Soc. 1996;118:2107–2108. [Google Scholar]
- 43.Bollinger JM, Jr., Krebs C, Vicol A, Chen S, Ley BA, Edmondson DE, Huynh BH. J. Am. Chem. Soc. 1998;120:1094–1095. [Google Scholar]
- 44.Yun D, Garcia-Serres R, Chicalese BM, An YH, Huynh BH, Bollinger JM., Jr. Biochem. 2007;46:1925–1932. doi: 10.1021/bi061717n. [DOI] [PubMed] [Google Scholar]
- 45.Broadwater JA, Ai J, Loehr TM, Sanders-Loehr J, Fox BG. Biochemistry. 1998;37:14664–71. doi: 10.1021/bi981839i. [DOI] [PubMed] [Google Scholar]
- 46.Pereira AS, Small W, Krebs C, Tavares P, Edmondson DE, Theil EC, Huynh BH. Biochemistry. 1998;37:9871–9876. doi: 10.1021/bi980847w. [DOI] [PubMed] [Google Scholar]
- 47.Korboukh VK, Li N, Barr EW, Bollinger JM, Jr., Krebs C. J. Am. Chem. Soc. 2009;131:13608–13609. doi: 10.1021/ja9064969. [DOI] [PMC free article] [PubMed] [Google Scholar]
- 48.Murray LJ, Garcia-Serres R, Naik S, Huynh BH, Lippard SJ. J. Am. Chem. Soc. 2006;128:7458–7459. doi: 10.1021/ja062762l. [DOI] [PMC free article] [PubMed] [Google Scholar]
- 49.McSorley FR, Wyatt PB, Martinez A, DeLong EF, Hove-Jensen B, Zechel DL. J. Am. Chem. Soc. 2012;134:8364–8367. doi: 10.1021/ja302072f. [DOI] [PubMed] [Google Scholar]
- 50.Sawyer DT. Oxygen chemistry. Oxford University Press; New York: 1991. p. 21. [Google Scholar]
- 51.Hirao H, Morokuma K. J. Am. Chem. Soc. 2009;131:17206–17214. doi: 10.1021/ja905296w. [DOI] [PubMed] [Google Scholar]
- 52.Diao Y. Ph. D. The Pennsylvania State University; University Park, Pennsylvania: 2011. Mechanistic Study of myo-Inositol Oxygenase. [Google Scholar]
- 53.Solomon EI, Pavel EG, Loeb KE, Campochiaro C. Coord. Chem. Rev. 1995;144:369–460. [Google Scholar]
- 54.Yang YS, McCormick JM, Solomon EI. J. Am. Chem. Soc. 1997;119:11832–11842. [Google Scholar]
- 55.Kato H, Taniguchi M, Kato T. Chem. Phys. Letters. 1972;14:231–233. [Google Scholar]
- 56.Kato H. J. Chem. Phys. 1973;59:1732–1737. [Google Scholar]
- 57.Holt S, Dingle R. Acta Chem. Scand. 1968;22:1091–1096. [Google Scholar]
- 58.Hatfield WE. Inorg. Chem. 1964;3:605–606. [Google Scholar]
- 59.Drummond J, Wood JS. J. Chem. Soc. D: Chem. Commun. 1969;23:1373–1373. [Google Scholar]
- 60.Zhang Y, Gebhard MS, Solomon EI. J. Am. Chem. Soc. 1991;113:5162–5175. [Google Scholar]
- 61.Deaton JC, Gebhard M, Solomon EI. Inorg. Chem. 1988;28:877–889. [Google Scholar]
- 62.McCormick JM, Reem RC, Solomon EI. J. Am. Chem. Soc. 1991;113:9066–9079. [Google Scholar]
- 63.Westmoreland TD, Wilcox DE, Baldwin MJ, Mims WB, Solomon EI. J. Am. Chem. Soc. 1989;111:6106–6123. [Google Scholar]
- 64.Creutz C. Mixed Valence Complexes of d5-d6 Metal Centers. In: Lippard SJ, editor. Progress in Inorganic Chemistry: An Appreciation of Henry Taube. Vol. 30. John Wiley & Sons, Inc.; Hoboken, NJ, USA: 1983. pp. 1–73. [Google Scholar]
- 65.Truesdale GA, Downing AL, Lowden GF. J. Appl. Chem. 1955;5:53–62. [Google Scholar]
- 66.Neese F, Solomon E. Inorg. Chem. 1999;38:1847–1865. doi: 10.1021/ic981264d. [DOI] [PubMed] [Google Scholar]
- 67.Piepho S, Schatz PN. Group Theory in Spectroscopy: With Applications to Magnetic Circular Dichroism. John Wiley & Sons, Inc.; New York: 1983. [Google Scholar]
- 68.Stephens P. Annu. Rev. Phys. Chem. 1974;25:201–232. [Google Scholar]
- 69.Bennett DE, Johnson MK. Bba-Protein Struct. M. 1987;911:71–80. doi: 10.1016/0167-4838(87)90272-x. [DOI] [PubMed] [Google Scholar]
- 70.Solomon EI, Kirk ML, Gamelin DR, Pulver S. Methods Enzymol. 1995;246:71–110. doi: 10.1016/0076-6879(95)46007-1. [DOI] [PubMed] [Google Scholar]
- 71.Guigliarelli B, Bertrand P, Gayda JP. J. Chem. Phys. 1986;85:1689–1692. [Google Scholar]
Associated Data
This section collects any data citations, data availability statements, or supplementary materials included in this article.


