Abstract
Caveolin (Cav)1 is expressed in the basolateral membrane domain of renal collecting duct (CD) principal cells (PCs), where it is associated with caveolae. To reveal any potential involvement of Cav1 in vasopressin signaling, we used specific monoclonal and polyclonal antibodies to examine its localization in CD PCs of Brattleboro (BB) rats treated with vasopressin (DDAVP). Compared with controls, immunofluorescence revealed a time-dependent increase in Cav1 expression in the apical membrane domain of PCs, where it overlapped with aquaporin-2 (AQP2). After 24 h of DDAVP treatment, Cav1 was visible as an increased number of small apical spots. The staining gradually became more extensive, and, after 2 wk of DDAVP, it occupied the majority of the apical membrane domain of many PCs. Cav1 also assumed an apical localization in PCs of DDAVP-treated Sprague-Dawley and Long-Evans rats. Similarly, Cav2 appeared at the apical pole of PCs after DDAVP treatment of BB, Sprague-Dawley, and Long-Evans rats. Immunogold electron microscopy confirmed bipolar Cav1 membrane expression in DDAVP-treated BB rats, whereas caveolae were only detected on the basolateral membrane. Immunoblot analysis of BB rat whole kidney homogenates revealed no significant increase in Cav1 levels in DDAVP-treated rats, suggesting that DDAVP induces Cav1 relocalization or modifies its targeting. We conclude that Cav1 and Cav2 trafficking and membrane localization are dramatically altered by the action of DDAVP. Importantly, the absence of apical caveolae indicates that while Cavs may have an as yet undetermined role in vasopressin-regulated signaling processes, this is probably unrelated to AQP2 internalization by caveolae.
Keywords: renal epithelia, caveolae, Brattleboro rats, aquaporin-2 trafficking, immunofluorescence, water transport
caveolae are plasma membrane microdomains that were first described about 60 yr ago as 50- to 100-nm invaginations (42, 74) and later found to be enriched in cholesterol and sphingolipids (1, 61). Caveolae have been detected in most cell types, including endothelial cells, smooth muscle cells, and various types of epithelial cells (32, 53). The functional relevance of caveolae has been proposed to be related to transcytosis in endothelial cells (50, 60, 69) and to nonclathrin-mediated endocytosis, e.g., for alkaline phosphatase, cholera and tetanus toxins, and the folate receptor (2, 37, 43). The first identified marker of caveolae was a component of their filamentous cytoplasmic coat, a 21- to 24-kDa protein called caveolin (Cav)1 (53), which was cloned from Madin-Darby canine kidney (MDCK) cells and initially named VIP-21 (26). Cav1 is a ubiquitous transmembrane cholesterol-binding protein (30, 39) and is highly expressed in endothelial and smooth muscle cells, adipocytes, pneumocytes, fibroblasts, and epithelial cells (52, 73), where it is also expressed in the trans-Golgi network (TGN) (12). Whereas the main subcellular localization of Cav1 is plasma membrane associated (73), it has also been detected on transport vesicles originating from the TGN (12, 26, 53), early (31) and recycling endosomes (17), and in the endoplasmic reticulum (73). In fibroblasts and muscle cells, cholesterol disruption induced Cav1 relocalization to early and late endosomes (8). The Cav family contains two other members beside Cav1, named Cav2 and Cav3, which also localized specifically to caveolae (59, 68). Cav2, whose sequence exhibits 38% identity and 58% similarity with Cav1 (57–59), has a similar expression pattern to that of Cav1, whereas Cav3 is expressed specifically in muscle cells, such as cardiac, skeletal, and smooth muscle cells (66, 68, 73).
The idea that caveolae can transport molecules into the cell is three decades old (62). We now know that, since Cav1 is a component of both plasma membrane caveolae and transport vesicles derived from the TGN, it plays an important role in molecular trafficking processes (73). Cav1 seems to mediate caveolae formation: its production or transfection, whether stable or transient, has been found to induce the appearance of caveolae (13, 15, 71), and a reduction in its expression causes a downregulation of caveolae (18). Results from the Anderson laboratory (64, 65) indicated that a functional role for Cavs and caveolae may be in cholesterol transport and in the regulation of intracellular levels of cholesterol. This relationship is mutual: in MDCK cells, cholesterol regulates Cavs and caveolae, and they, in turn, may be important in cholesterol homeostasis (21). They have also been implicated in triglyceride homeostasis (36, 51), tumorigenesis/tumor supression (13, 18, 28), apoptosis (33) and cell cycle regulation (19, 24) as well as in signal transduction, as Cav1 has been reported to interact with and affect proteins that are crucial for various signaling pathways, such as heterotrimeric G proteins, protein kinases, integrins, and a number of receptors (EGF, insulin, platelet-derived growth factor, p75 nerve growth factor, and transforming growth factor-β) (11, 29, 52, 63). Caveolae and Cav1, thus, constitute a major endocytotic mechanism, the main alternative to clathrin-mediated endocytosis (20, 37, 70, 76).
In the kidney, Cav1 is expressed on the basolateral but not apical membrane of renal collecting duct (CD) principal cells (PCs), distal tubule, and connecting tubule cells (5), where it colocalizes with Cav2. As previously reported, there is a relationship between Cav1 and Cav2, given that the latter was found to undergo degradation in the absence of Cav1 (52). Cav1 was not detected in intercalated cells of the renal CD or in proximal tubules, where caveolae do not occur either (5, 76). Several proposed functions of Cav1 and caveolae in the proximal tubule may need to be reassessed, because they are based almost exclusively on data from proximal tubule cells in culture, which, in contrast to normal PT cells in situ, do show Cav1 expression (76). Cav3 is not expressed at detectable levels in renal epithelia (5). Bipolar expression of Cav1, but not Cav2, has been previously reported in MDCK cells but not in renal epithelial cells in vivo (12, 38, 57, 72). On the other hand, in the same cultured cell model, Cav2 localization is predominantly basolateral, and, moreover, Cav1 and Cav2 have been found in the same basolateral vesicles (57). In fibroblastic 3T3-L1 cells, endogenous and transfected Cav2 localization is restricted to loci where endogenous Cav1 is detected (58, 59). Mechanistically, it has been proposed that Cav2 recruitment to the membrane domain requires Cav1 (38). The apical expression of Cav1 in the absence of apical caveolae has also been described exclusively in cultured cells (70, 71). It has been previously recognized that the properties of caveolae-associated and noncaveolar Cav1 differ significantly, given that a number of studies have reported noncaveolar Cav1 trafficking and distinct roles (23, 35, 56).
Our present study shows that Cav1 assumes the expected localization to the basolateral membrane domain in renal CD PCs from Brattleboro (BB), Sprague-Dawley (SD), and Long-Evans (LE) rats under control conditions. However, after vasopressin treatment of all three strains, Cav1 undergoes a localization shift, being expressed predominantly in the apical membrane domain of CD PCs, but in the absence of caveolae. The increase in apical Cav1 expression is time dependent over the range of 1–14 days. Moreover, Cav2 localization also shifts toward the apical pole of the same cells upon exposure to vasopressin.
MATERIALS AND METHODS
Antibodies.
For immunocytochemical experiments, mouse monoclonal and rabbit polyclonal Cav1 antibodies and a monoclonal Cav2 antibody were purchased from BD Biosciences (San Jose, CA). The goat aquaporin-2 (AQP2) antibody was purchased from Santa Cruz Biotechnology (Santa Cruz, CA). An affinity-purified chicken antibody against the V-ATPase 31-kDa E1 subunit isoform was raised against a peptide corresponding to the COOH-terminal region of this subunit (6). The secondary antibodies used were affinity-purified Cy3-conjugated donkey anti-chicken IgY, anti-goat IgG, and anti-mouse IgG, and FITC-conjugated donkey anti-rabbit IgG (Jackson ImmunoResearch Laboratories, West Grove, PA).
For immunoblot analysis, Cav1 expression was assessed using the rabbit antibody described above, whereas a purified mouse anti-actin monoclonal antibody (EMD Millipore, Billerica, MA) was used for loading controls. The secondary antibodies used were affinity-purified horseradish peroxidase (HRP)-conjugated donkey anti-rabbit (Santa Cruz Biotechnology) and goat anti-mouse (Pierce Protein Biology Products, Thermo Fisher Scientific, Rockford, IL) antibodies.
Tissue preparation.
Adult male BB rats (Rat Resource and Research Center, Columbia, MO) were housed under standard conditions and had free access to water and a standard rodent diet. All animal experiments were approved by the Massachusetts General Hospital Subcommittee on Research Animal Care, in accordance with National Institutes of Health, Department of Agriculture, and American Association for Accreditation of Laboratory Animal Care requirements. Rats were infused with the vasopressin analog DDAVP (Sigma-Aldrich, St. Louis, MO) at 1.2 μg/day for 1, 3, or 14 days by subcutaneous Alzet osmotic pumps (model nos. 2002 or 2ML4, Durect, Cupertino, CA). Adult male LE and SD rats (Charles River Laboratories, Wilmington, MA) were similarly treated with DDAVP for 14 days. Osmotic pumps were implanted under anesthesia with pentobarbital sodium (40 mg/kg body wt ip, Nembutal, Abbott Laboratories, Abbott Park, IL) under the neck skin, as previously described (4, 44). The effect of DDAVP treatment was assessed by measuring urine osmolality with a Vapro 5520 vapor pressure osmometer (Wescor, Logan, UT).
For immunofluorescence experiments, animals were anesthetized with pentobarbital sodium (50 mg/kg body wt ip) and perfused through the left ventricle for 2 min with PBS (0.9% NaCl in 10 mM phosphate buffer, pH 7.4) and subsequently with modified paraformaldehyde-lysine-periodate fixative (PLP; 4% paraformaldehyde, 75 mM lysine-HCl, 10 mM sodium periodate, and 0.15 M sucrose in 37.5 mM sodium phosphate) for 5 min, as previously described (45). Kidneys were harvested, sliced, and fixed by immersion in PLP for an additional 4 h at room temperature and then overnight at 4°C. The osmotic pumps were removed and inspected to confirm the drug delivery.
Immunofluorescence.
PLP-fixed kidney slices (1–2 mm thick) were cryoprotected in PBS with 0.9 M sucrose overnight at 4°C, embedded in Tissue-Tek OCT compound 4583 (Sakura Finetek USA, Torrance, CA), and frozen at −20°C. Sections (4 μm) were cut on a CM3050S cryostat (Leica Microsystems, Bannockburn, IL), collected onto Superfrost Plus microscope slides (Fisher Scientific, Pittsburgh, PA), air dried, and stored at 4°C (46, 49).
Cryostat sections of PLP-fixed kidney were rehydrated, treated with 1% SDS for 4 min for the retrieval of antigenic sites (7), washed 3 × 5 min in PBS, incubated for 10 min in 1% BSA and for 90 min with the primary antibody diluted in Dako antibody diluent (Dako, Carpinteria, CA) at room temperature, rinsed in PBS, and then incubated with the secondary antibody for 1 h, also at room temperature (45–47). Primary antibodies were used at the following concentrations: 6.25 μg/ml (mouse and rabbit Cav1), 12.5 μg/ml (mouse Cav2), and 0.4 μg/ml (goat AQP2). Cy3-conjugated secondary antibodies were used at 2 μg/ml and the FITC-conjugated secondary antibody at 25 μg/ml. Primary antibodies raised in different species were used for dual immunostaining.
Digital images were acquired using a Nikon 80i epifluorescence microscope (Nikon Instruments, Melville, NY) with an Orca 100 charge-coupled device camera (Hamamatsu, Bridgewater, NJ). Epifluorescence images were analyzed with IPLab (version 3.9.5 r2) image-processing software (BD Biosciences) imported into and then printed from Adobe Photoshop (version 9.0.2) image-editing software (Adobe Systems, San Jose, CA) (45, 47). To better represent the raw high-magnification images visualized under the microscope, the levels command and the high-pass filter in Adobe Photoshop were used to adjust entire images that are presented here.
Quantification of fluorescence intensity.
Quantification of mean pixel intensity (MPI) of apical and basolateral Cav1 immunostaining in control and 14-day DDAVP-treated BB rats was performed as previously described (48, 49) on raw images. Sections from three control rats and three DDAVP-treated rats were immunostained concurrently under identical conditions. All digital images were acquired using identical exposure parameters, including exposure time (150 ms). Regions corresponding to the Cav1-associated fluorescence in the apical and basolateral poles of the cells were selected using the segmentation function in IPLab software. The MPI of every such region was measured blindly, and all MPIs were corrected for a background value determined for each image taken by measuring the pixel intensity in several locations of the 5–10 darkest cells and selecting the lowest value. Data were analyzed using Microsoft Excel (version 10, Microsoft, Redmond, WA). The calculation was performed on an average of 100 inner medullary CD (IMCD) PCs per control BB rat and IMCD PCs per DDAVP-treated BB rat from at least 21 different tubules (31 tubules on average) for each animal. A similar quantification was performed in the inner stripe of the outer medulla (ISOM), including an average of 66 PCs per control BB rat and 100 PCs per DDAVP-treated BB rat from at least 16 different tubules (23 tubules on average) for each animal. Summary data were expressed for each group as means ± SE. Statistical significance was tested with an unpaired Student's t-test, and results with P values of <0.05 were considered significant.
Immunogold electron microscopy.
Small pieces of PLP-fixed kidneys were dehydrated through a graded ethanol series, infiltrated, and embedded and polymerized in LR White resin (Electron Microscopy Sciences, Hatfield, PA) at 50°C as previously described (48, 54).
Thin (90 nm) kidney sections were cut using a Leica EM UC7 ultramicrotome (Leica Microsystems) and incubated on drops of primary rabbit anti-Cav1 (at a final concentration of 2.5 μg/ml) and goat anti-AQP2 (at 2 μg/ml) antibodies as described above diluted together in Dako diluent for 1 h at room temperature. Grids were then rinsed in PBS and incubated on drops of a mixture of anti-rabbit IgG antibody coupled to 15-nm gold particles and anti-goat IgG antibody coupled to 10-nm gold particles (Ted Pella, Redding, CA) diluted 1:20 in Dako diluent for 1 h at room temperature. Grids were then rinsed several times with distilled water, poststained with 2% uranyl acetate for 10 min, rinsed again, and dried. Sections were examined in a JEM-1011 transmission electron microscope (JEOL, Tokyo, Japan) at 80 kV. Images were acquired using an AMT XR60 digital imaging system (Advanced Microscopy Techniques, Danvers, MA) and subsequently imported into Adobe Photoshop.
To investigate renal cell morphology by electron microscopy, tissues were fixed as previously reported (34) in 2% glutaraldehyde in 0.1 M sodium cacodylate buffer (pH 7.4, Electron Microscopy Sciences) overnight at 4°C. After being rinsed in buffer, tissues were postfixed in 1% osmium tetroxide in 0.1 M cacodylate buffer for 1 h at room temperature, rinsed again, and then dehydrated through a graded series of ethanol solutions to 100%. Subsequently, tissues were infiltrated with Epon resin (Ted Pella) in a 1:1 Epon-ethanol solution. They were placed in fresh Epon the following day for several hours and then embedded in Epon overnight at 60°C. Thin sections were cut as described above, collected on formvar-coated grids, poststained with uranyl acetate and lead citrate, and examined as described above.
Protein extraction and immunoblot analysis.
Control and DDAVP-treated BB rat kidneys were cut into small pieces and disrupted with a Kontes tissue grinder (Fisher Scientific) in 3 ml of homogenization buffer [10 mM Tris·HCl (pH 7.4), 160 mM NaCl, 1 mM EGTA, 1 mM EDTA, 1% Triton X-100, 0.05% Igepal CA-630, and Complete protease inhibitors from Roche Diagnostics (Indianapolis, IN)] (49). Homogenates were centrifuged for 15 min at 15,000 g at 4°C. The supernatant was collected, aliquoted, and stored at −80°C. Protein concentration was determined using the bicinchoninic acid protein assay (Pierce Biotechnology, Rockford, IL) with albumin as the standard. Kidney extract (175 μg) was diluted in Laemmli reducing sample buffer, boiled for 5 min, and loaded onto Tris-glycine polyacrylamide 4–20% gradient gels (Bio-Rad Laboratories, Hercules, CA). After SDS-PAGE separation, proteins were transferred onto an Immun-Blot polyvinylidene difluoride membrane (Bio-Rad Laboratories), and the membrane was blocked and incubated overnight at 4°C with the primary anti-Cav1 antibody diluted to a final concentration of 0.025 μg/ml in Tris-buffered saline containing 2.5% milk. The membrane was subsequently washed and incubated with an HRP-conjugated secondary antibody at 0.16 μg/ml for 1 h at room temperature as previously described (45, 46, 49). The loading control was performed with an anti-actin antibody at 0.04 μg/ml and an HRP-conjugated secondary antibody at 0.08 μg/ml. For quantitative analysis of protein bands detected with the Western Lightning chemiluminescence reagent (Perkin-Elmer Life Sciences, Boston, MA), digital images of the membranes were acquired with the EpiChemi3 imaging system (UVP, Upland, CA) and analyzed with LabWorks 4.6 software (UVP) (49).
Total RNA extraction, reverse transcription, and quantitative PCR.
Kidneys from control and DDAVP-treated BB rats were dissected and disrupted in RLT lysis buffer (Qiagen, Valencia, CA) with 10 μl/ml β-mercaptoethanol. Total RNA was extracted using the RNeasy Midi kit (Qiagen) as previously reported (9, 49). Genomic DNA contamination was removed using the RNase-free DNase set from Qiagen. The isolated RNA was reverse transcribed, and quantitative real-time PCR was performed for 40 cycles with 2 μl of reverse transcription product as the template using SYBR green PCR Master Mix and the 7300 Real-Time PCR System (Applied Biosystems, Foster City, CA) (9, 49). The oligonucleotide primers designed to amplify short sequences of rat Cav1 and Gapd (encoding for GAPDH) were as follows: 5′-AGTTGATCTCTGCGCTTGGT-3′ (Cav1 forward primer), 5′-CCCGTTTGTCTGCTTTGAAT-3′ (Cav1 reverse primer), 5′-AGAGAGAGGCCCTCAGTTGCT-3′ (Gapd forward primer), and 5′-TGGAATTGTGAGGGAGATGCT-3′ (Gapd reverse primer) (Invitrogen, Carlsbad, CA). Each reaction was performed in triplicate.
RESULTS
Caveolin localization in BB rat kidney CDs.
In the SD rat kidney, we showed that Cav1 is expressed at the basolateral but not apical membrane of CD PCs, distal convoluted tubule, and connecting segment cells. Cav1 was not detected in intercalated cells of the renal CD or in proximal tubules (5, 76). Our present results confirmed our previously reported findings and revealed a similar localization pattern in BB rats (Fig. 1) and LE rats (data not shown). This subcellular localization pattern was found throughout the CD, regardless of which kidney region was examined. Thick ascending limbs (Fig. 1B) did not exhibit detectable amounts of Cav1 expression.
Fig. 1.
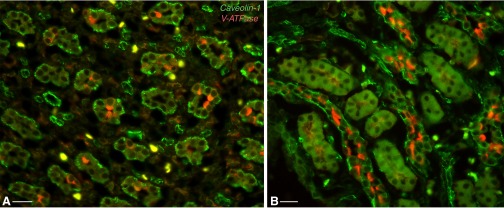
Dual immunofluorescence staining for caveolin (Cav)1 (green) and the V-ATPase E1 subunit (red) in the Brattleboro (BB) rat kidney inner medulla (IM; A) and inner stripe (IS) of the outer medulla (ISOM; B). Cav1 is expressed predominantly in non-V-ATPase-expressing collecting duct (CD) principal cells (PCs), where it assumes a basolateral localization. The yellow cells in the interstitium are probably of the macrophage/monocyte lineage, which express both Cav and V-ATPase. Bars = 20 μm.
Effects of vasopressin treatment on AQP2 localization in BB rats.
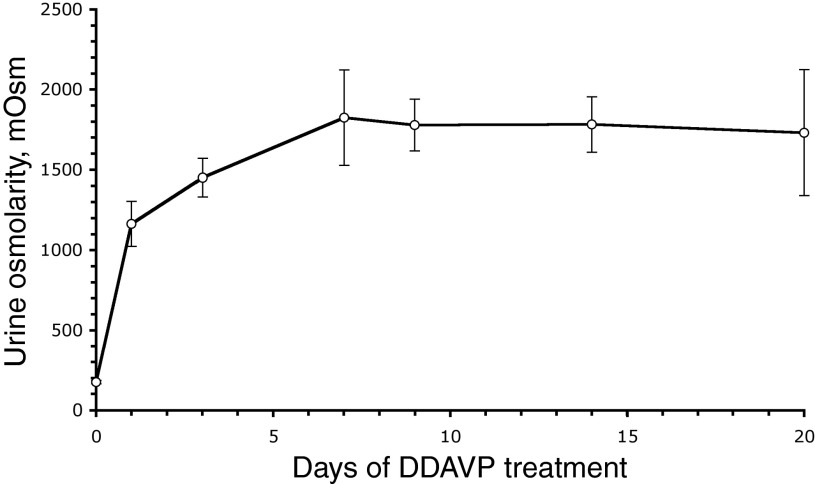
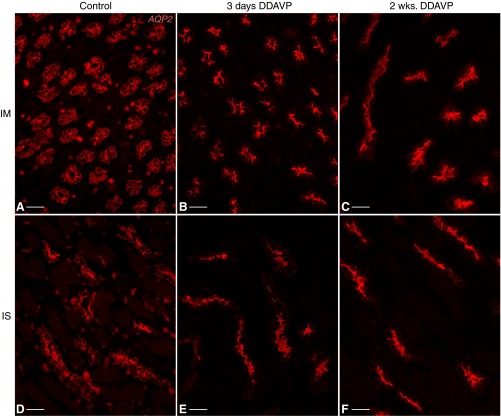
Experiments on AQP2 localization and urine concentration were performed to confirm that the BB rats used in our experiments indeed responded appropriately to DDAVP treatment (27, 55). As expected, DDAVP induced a sustained, time-dependent increase in urine osmolality in BB rats (Fig. 2). This increase was already statistically significant 24 h after pump implantation, reached a maximum level after 7 days, and was maintained significantly above baseline values throughout the 3-wk experiment. Under control conditions, AQP2 localization in PCs is predominantly diffuse in both the inner medulla (IM; Fig. 3A) and ISOM (Fig. 3D). After DDAVP treatment, AQP2 localization became polarized to the apical membrane of PCs, as seen in IMCDs after 3 days (Fig. 3B) or 2 wk (Fig. 3C), as well as in the ISOM (Fig. 3, E and F), as previously described (55).
Fig. 2.
Time-dependent urine osmolality increase after vasopressin (DDAVP) treatment of BB rats (1.2 μg/day via osmotic pumps). Urine osmolality was significantly increased at 24 h postimplantation of the pumps, peaked after 7 days, and was maintained at these elevated levels for the 3-wk duration of the treatment. Values are shown as means ± SE.
Fig. 3.
Subcellular localization of aquaporin-2 (AQP2; red) in control and DDAVP-treated BB rats. AQP2 had a diffuse localization in inner medullary CD (IMCD) PCs of control BB rats (A), which became polarized to the apical membrane of these cells after treatment with DDAVP for 3 days (B) or 2 wk (C). Similarly, ISCD PCs exhibited cytosolic diffuse AQP2 in control animals (D) but sharp apical AQP2 localization after 3 days (E) or 2 wk (F) of DDAVP treatment. Bars = 25 μm.
Effects of vasopressin treatment on Cav1 localization.
We then examined subcellular Cav1 localization and unexpectedly found that DDAVP treatment profoundly affects Cav1 localization in PCs from BB rats. In untreated animals, Cav1 localization was exclusively associated with the basolateral plasma membrane of PCs, as previously described for SD rats (5, 76). However, acute (1 day) exposure to DDAVP induced the appearance of small, scattered spots of Cav1 staining associated with the apical membrane in a number of PCs in CDs from both the IM (Fig. 4, A and A′) and ISOM (Fig. 4, C and C′).
Fig. 4.
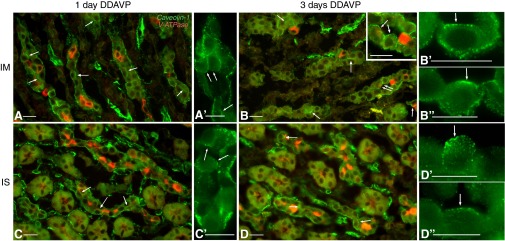
Double labeling for Cav1 (green) and V-ATPase (red) in the kidney of BB rats after short-term DDAVP treatment. After 1 day of DDAVP exposure, Cav1 was predominantly located in the basolateral membrane domain of PCs (identified by their negative labeling for V-ATPase) in both the IMCD (A and A′) and ISCD (C and C′). At this time point, spots of apical Cav1 staining started appearing in a few cells (arrows). After 3 days, PCs with significant apical staining for Cav1 were readily found in both the IMCD (B) and ISCD (D). The inset in B shows a higher-magnification image of the region indicated by the double arrow, emphasizing apical staining (arrows) facing the open lumen of the tubule. In even higher-magnification panels (B′ and B″ for the IMCD; D′ and D″ for the ISCD), PCs in open tubules from BB rats treated with DDAVP for 3 days showed apical Cav1 staining (arrows). Bars = 15 μm.
As the treatment duration increased, the apical staining gradually became more extensive. After 3 days of treatment, PCs with significant apical Cav1 staining were readily found in both IMCDs (Fig. 4B, see also inset, B′, and B″) and CDs from the ISOM (ISCDs; Fig. 4, D, D′, and D″). In certain PCs, Cav1 staining appeared at this time point to occupy a majority of the apical membrane domain (as indicated by arrows in Fig. 4, B and D).
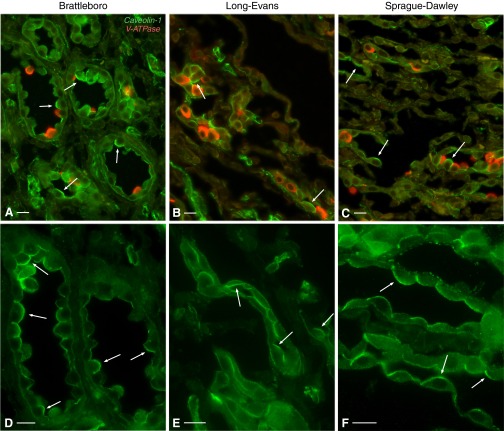
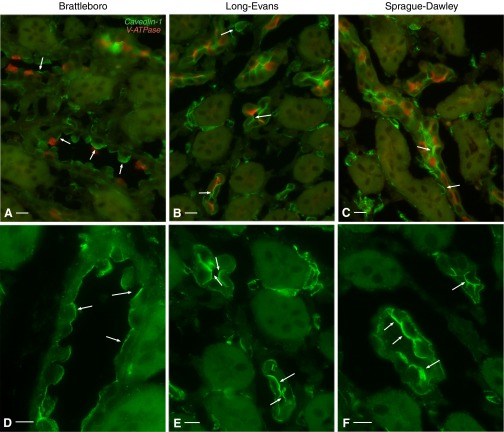
This effect was increased even further after chronic (2 wk) DDAVP treatment. Cav1 now assumed a largely apical localization in CD PCs from IM of BB rats (Fig. 5, A and D). Many PCs exhibited Cav1 staining that occupied their entire apical pole. Interestingly, this result was not strain specific, as a similar shift in subcellular Cav1 localization also occurred in LE rats (Fig. 5, B and E) and SD rats (Fig. 5, C and F). A similar localization shift was seen in the outer medulla (Fig. 6). ISCD PCs exhibited a strong apical Cav1-associated immunostaining in all three rat strains examined: BB rats (Fig. 6, A and D), LE rats (Fig. 6, B and E), and SD rats (Fig. 6, C and F). The effect is characteristic for CD PCs, as we detected no significant apical Cav1 staining in distal convoluted tubules of 2-wk DDAVP-treated BB, SD, or LE rats (data not shown), as previously reported for untreated SD rats (5). Similarly, we detected no apical Cav1 expression in thick ascending limbs (Fig. 6).
Fig. 5.
Apical localization of Cav1 (green) in renal IMCD PCs of rats treated with DDAVP for 2 wk. Cav1 was highly expressed in IMCD PCs, which did not stain for the V-ATPase E1 subunit (red), and assumed a largely apical localization (arrows) in BB (A), Long-Evans (LE; B), and Sprague-Dawley (SD; C) rats. Higher-magnification images show single immunostaining for Cav1 in the three rat strains: BB (D), LE (E), and SD (F). Arrows indicate cells with strong apical Cav1 localization. Bars = 15 μm.
Fig. 6.
Apical localization of Cav1 (green) in renal ISCD PCs of rats treated with DDAVP for 2 wk. In ISCD PCs characterized by the lack of V-ATPase expression (red), Cav1 localized in a predominantly apical pattern (arrows) in BB (A), LE (B), and SD (C) rats. Shown at higher magnification is single Cav1 immunostaining (green, arrows) in the three rat strains: BB (D), LE (E), and SD (F). Bars = 15 μm.
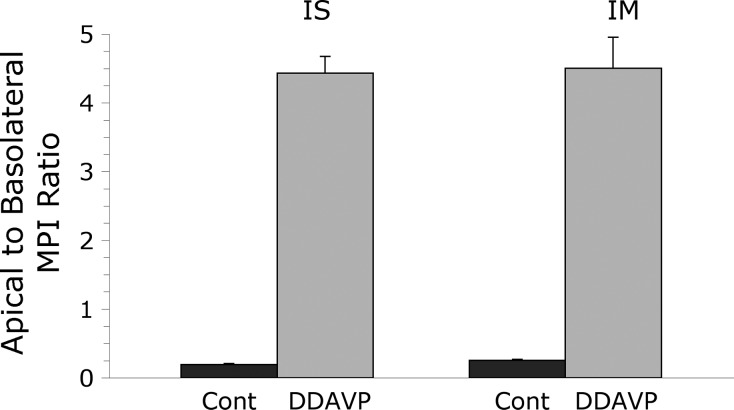
The MPI of apical and basolateral Cav1 immunofluorescence labeling was quantified in PCs from control and 2-wk DDAVP-treated BB rats as described in materials and methods. The apical-to-basolateral MPI ratio averaged 0.20 ± 0.01 (mean ± SE, n = 3) in ISCD PCs from control rats and increased to 4.43 ± 0.24 (mean ± SE, n = 3) after DDAVP treatment. The difference between the two animal groups was highly significant (P = 0.0006). Similarly, in IMCD PCs, the apical-to-basolateral MPI ratio increased from 0.26 ± 0.01 (mean ± SE, n = 3) to 4.50 ± 0.45 (mean ± SE, n = 3) after DDAVP treatment (P = 0.0007; Fig. 7).
Fig. 7.
The ratio between apical and basolateral mean pixel intensity (MPI) of Cav1-associated immunofluorescence in BB rat CD PCs is shown here as mean ± SE (n = 3 animals in each group). The low apical-to-basolateral MPI ratio in control BB rats (Cont) reflects the predominantly basolateral Cav1 localization in PCs from both IS and IM CDs. In both regions, DDAVP treatment induced a shift in Cav1 localization, which was reflected by the significantly higher apical-to-basolateral MPI ratio.
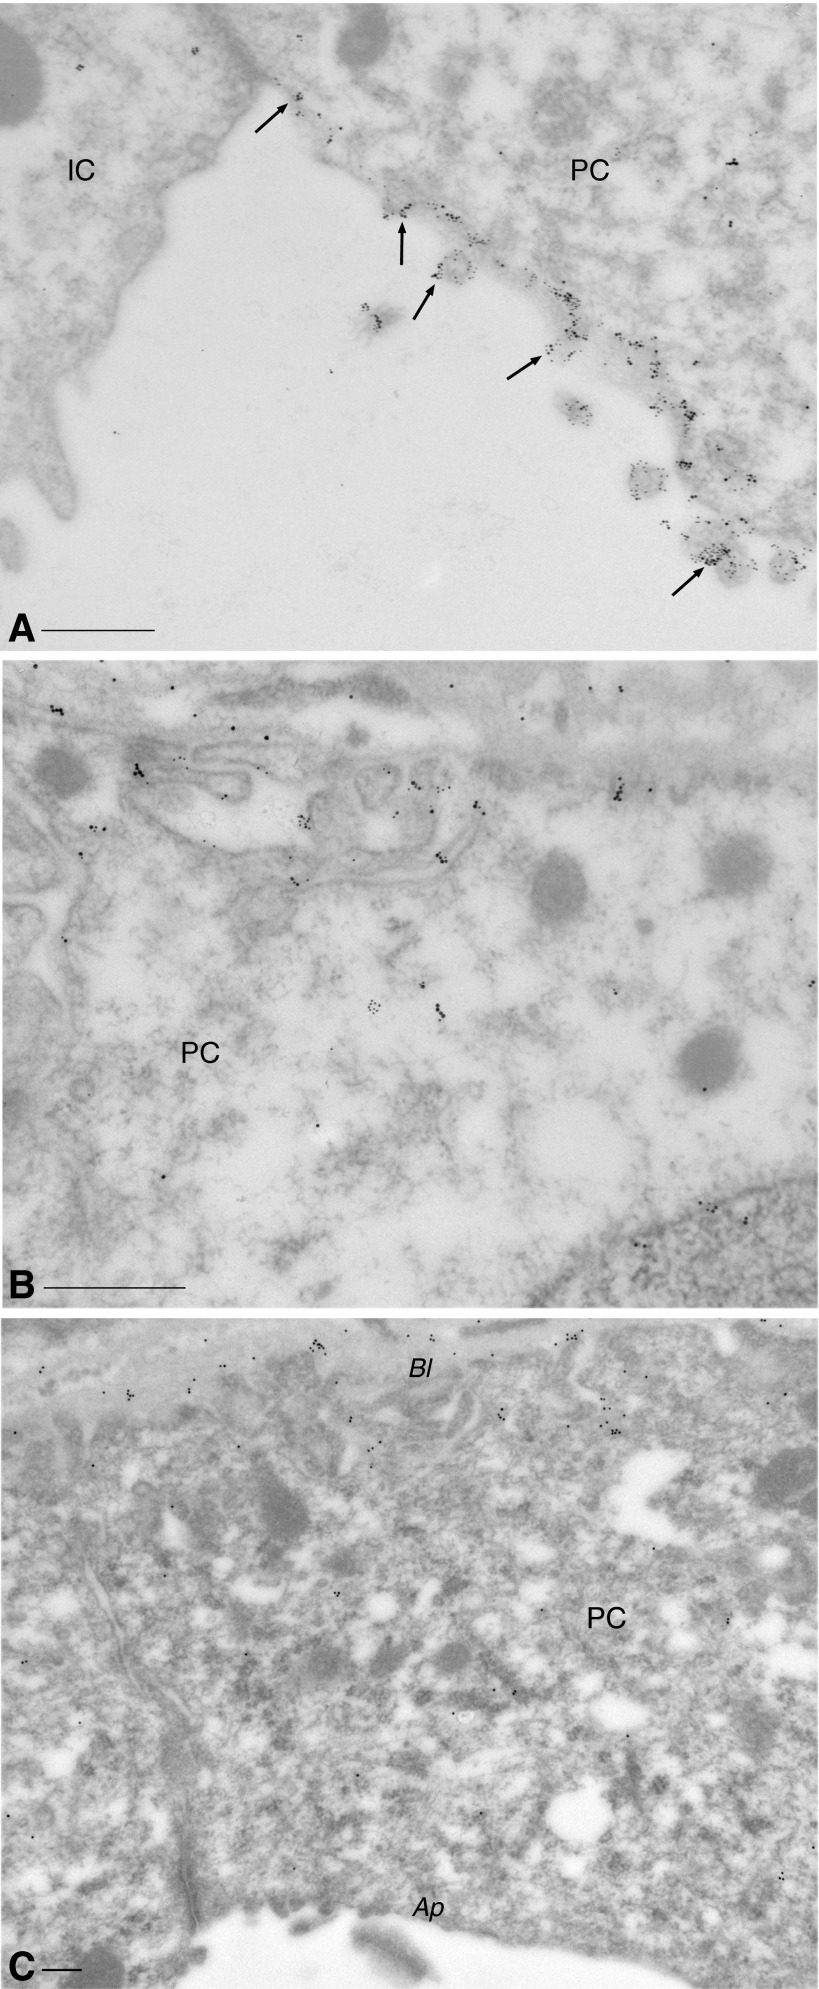
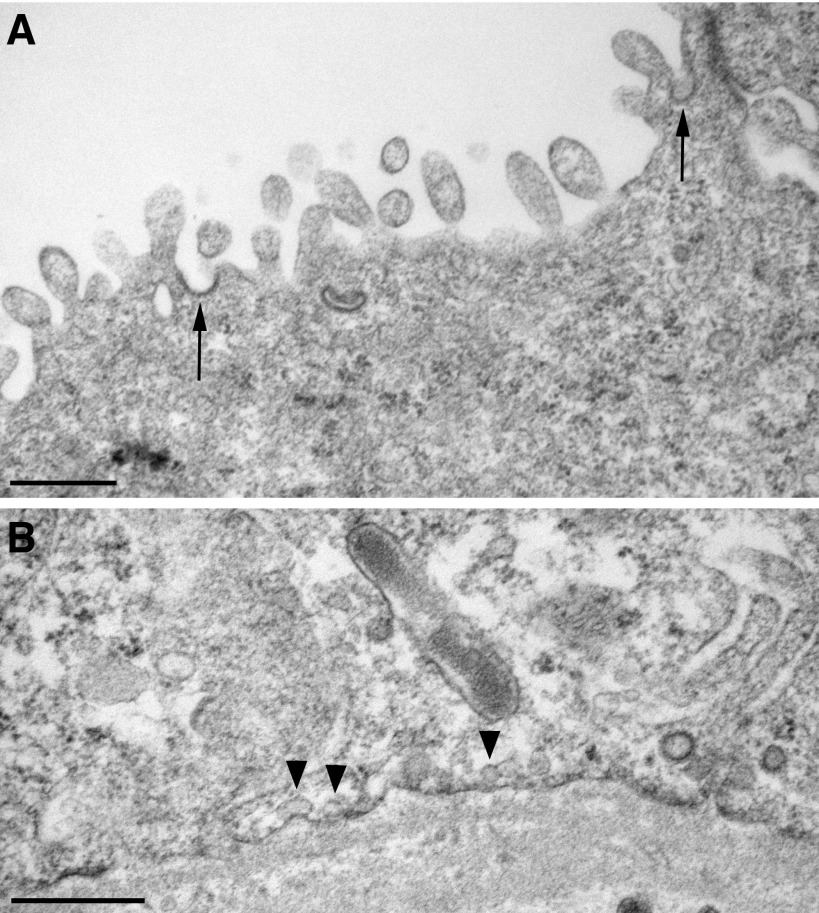
These immunofluorescence results were confirmed by immunogold electron microscopy. After 1-wk DDAVP treatment of BB rats, both AQP2 and Cav1 were detected at high levels in the apical membrane domain of PCs, in a partially overlapping localization pattern (Fig. 8A). The basolateral membrane domain is, however, not devoid of Cav1 (Fig. 8B), as also seen by immunofluorescence (Figs. 5 and 6). The localization of Cav1 to the apical membrane is characteristic of DDAVP-treated tissues, as apical expression of Cav1 was not detectable in electron micrographs from control BB rat kidneys (Fig. 8C). Interestingly, despite the extensive expression of apical Cav1, caveolae were not found by electron microscopy on the apical plasma membrane. They were detected only on the basolateral membrane, i.e., Cav1 localizes to the apical membrane despite the absence of caveolae (Fig. 9), and this high level of Cav1 expression does not induce the formation of caveolae in the apical membrane domain.
Fig. 8.
Immunogold electron microscopy of ISCD PCs. Dual immunostaining of a BB rat treated with DDAVP for 1 wk showed that both Cav1 (15-nm gold particles) and AQP2 (10-nm particles) were highly expressed in the apical membrane domain of the PC (A), exhibiting a partial overlap in localization (arrows). The neighboring intercalated cell (IC) expressed no detectable Cav1 and no AQP2. Cav1 also localized to the basal pole of the PC (B). In untreated BB rats (C), the subcellular localization pattern of Cav1 in PCs was almost exclusively basolateral (Bl), and the apical membrane domain (Ap) showed no significant Cav1 expression. Bars = 0.25 μm.
Fig. 9.
Electron micrographs of the apical and basolateral membrane domains from renal CD PCs of a BB rat treated with DDAVP for 2 wk. In the PC apical membrane domain (A), clathrin-coated pits were present (arrows), but there were no caveolae. Conversely, caveolae (arrowheads) were visible on the basal membrane of the PC (B). Bars = 0.5 μm.
Effects of vasopressin treatment on Cav2 localization.
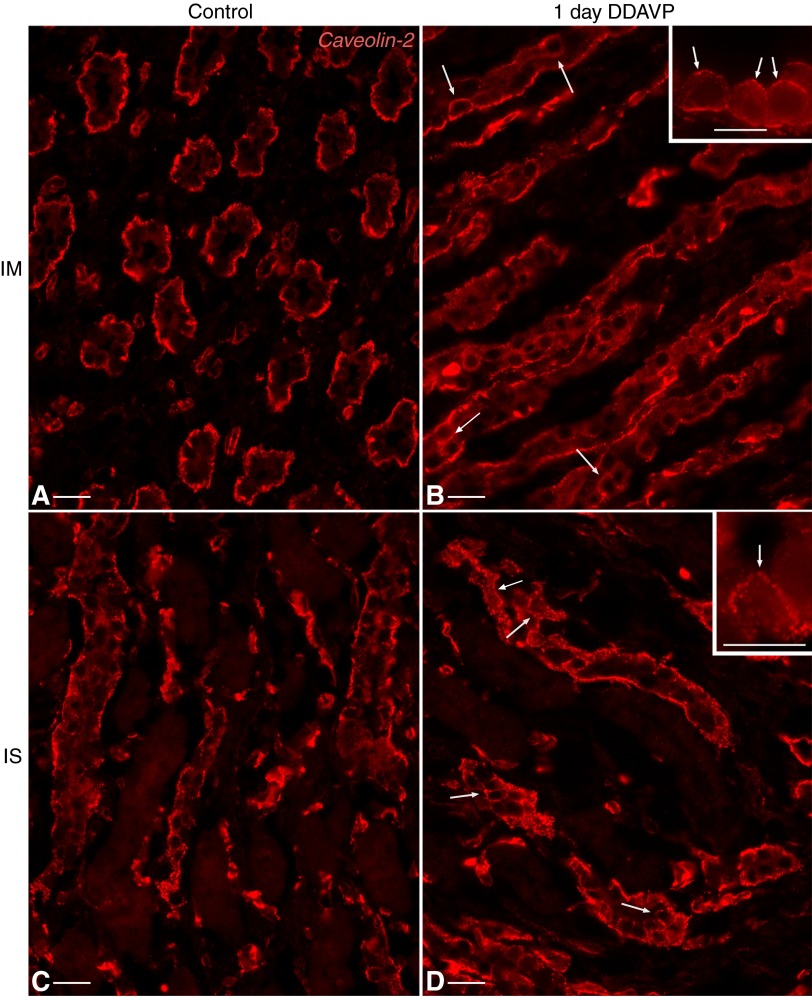
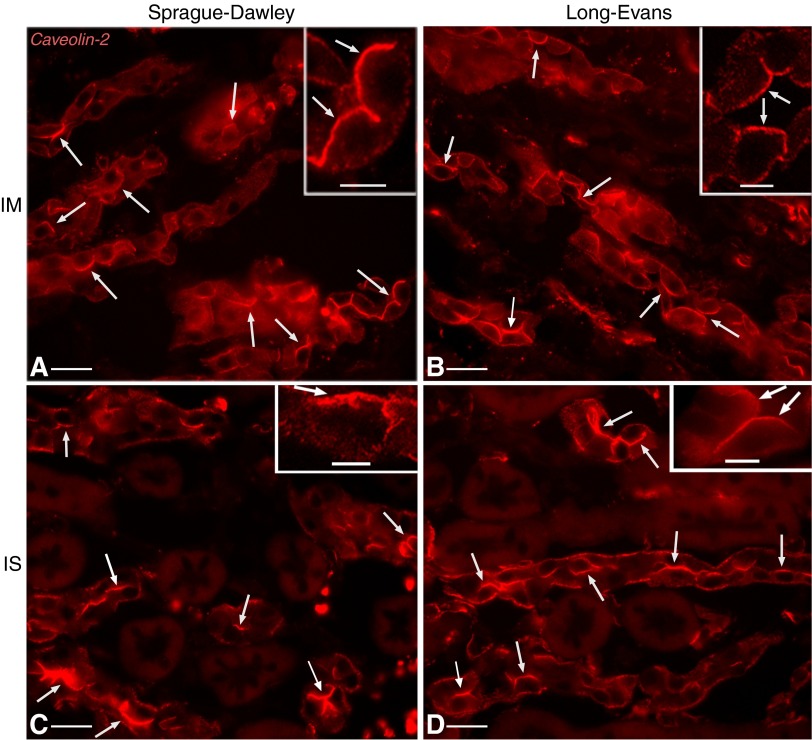
Under baseline conditions, Cav2 subcellular localization in CD PCs of BB rats is reminiscent of that of Cav1, as previously reported for cultured cells of renal origin (12, 38, 57, 72). As described above for Cav1, Cav2 also localized primarily to the basolateral membrane domain in untreated BB rats (Fig. 10, A and C) and responded to DDAVP exposure by appearing at the apical surface of medullary CD PCs. After 24 h of DDAVP treatment, small, scattered spots of Cav2 staining were visible in the apical membrane domain of some PCs (arrows) from both the IM (Fig. 10B) and OMCD (Fig. 10D). The trend seen in the Cav1 subcellular localization shift was also exhibited by Cav2, so that after 2 wk of exposure to DDAVP, the Cav2 localization in most medullary CD PCs became mainly apical. This effect was seen not only in BB rats (not shown) but also in 2-wk DDAVP-treated SD rats (Fig. 11, A and C) and LE rats (Fig. 11, B and D) in CD PCs of both the IM and ISOM.
Fig. 10.
Distribution of Cav2 in PCs of the BB rat renal CD. Cav2 (red) localization in IMCD (A) and ISCD (C) PCs was mainly basolateral, similar to that of Cav1. After 24 h of DDAVP treatment, Cav2 appeared in the apical membrane domain of certain PCs (arrows) from both the IMCD (B) and ISCD (D) as a number of small, scattered spots. Insets show higher-magnification images of cells, demonstrating examples of apical Cav2 staining (arrows). Bars = 20 μm; bars in insets = 10 μm.
Fig. 11.
Apical localization of Cav2 (red) in renal CD PCs of rats treated with DDAVP for 2 wk. Similar to Cav1, Cav2 assumed a largely apical localization in IMCD PCs (arrows) of 2-wk DDAVP-treated SD (A), LE (B), and BB (not shown) rats. A similar Cav2 subcellular localization was found in PCs of the ISCD (arrows) in SD (C), LE (D), and BB rats. Insets show higher-magnification images of cells, demonstrating examples of apical Cav2 staining (arrows). Bars = 20 μm; bars in insets = 5 μm.
Effects of vasopressin treatment on Cav1 protein and mRNA levels in BB rats.
To address the question of whether the Cav that appears in the apical membrane domain of CD PCs after DDAVP treatment might be newly synthesized by these cells or represents previously existing protein being translocated from the basolateral membrane domain, we investigated Cav1 protein and message levels after DDAVP treatment. Immunoblot analysis of Cav1 protein levels in control and DDAVP-treated (for 3 days or 2 wk) BB rat kidneys was performed. The results did not reveal an increase in Cav1 protein in response to DDAVP. Instead, Cav1 levels in 2-wk DDAVP-treated BB rats were actually lower than in control or 3-day treated animals (Fig. 12A). Quantification of chemiluminescence intensities of Cav1 and actin (control) protein bands from untreated and DDAVP-treated BB rats revealed that the decreasing trend in Cav1 protein levels after 3 days of DDAVP treatment was not statistically significant (Fig. 12B). Significance was achieved only after 14 days of treatment (P = 0.007 compared with control animals).
Fig. 12.

Quantitative analysis of Cav1 protein and mRNA levels in the kidney of control and DDAVP-treated BB rats. A: total kidney homogenates from control and DDAVP-treated BB rats (duration of treatment: 3 days or 2 wk) were subjected to SDS-PAGE and immunoblotted with an anti-Cav1 antibody. The loading control was performed with an anti-actin antibody. B: chemiluminescence intensities of Cav1 and actin protein bands from control (C) and DDAVP-treated rats (3 days and 2 wk) were quantified. The results from five different experiments were averaged and normalized to the mean of the respective control group and are shown as means ± SE; n = 3 rats/group. The results indicate a decreasing trend in Cav1 protein levels during DDAVP treatment, becoming statistically significant after 14 days (P = 0.007 compared with control rats and P = 0.026 compared with 3-day DDAVP-treated rats). C: total RNA was extracted from control and DDAVP-treated rats (3 days and 2 wk) (n = 3 rats/group), and quantitative real-time PCR analysis was performed for Cav1 and GAPDH (as a control). Cav1 mRNA data from three different experiments were normalized to their respective GAPDH mRNA values and subsequently to the average of the respective control group. Average results are plotted as means ± SE and showed no statistically significant changes.
Cav1 mRNA levels in the kidney of control and DDAVP-treated BB rats were assessed using quantitative real-time PCR analysis. Cav1 mRNA values were normalized to the respective GAPDH mRNA levels. No statistically significant differences were observed between the different groups (Fig. 12C).
DISCUSSION
Under baseline conditions, Cav1 is detected by immunofluorescence in the basolateral but not apical plasma membrane domain of kidney CD PCs in BB, LE, and SD rats. After vasopressin treatment, however, Cav1 expression was detected in the apical membrane domain of these cells, and the immunostaining intensity increased in a time-dependent manner. After the first day of treatment, apical Cav1 immunostaining was visible as small, scattered spots. The extent of the apical Cav1 staining increased gradually until, after 2 wk of DDAVP treatment, Cav1 localization became predominantly apical in all three rat strains investigated. Basolateral Cav1 staining remained readily detectable in all PCs for the duration of the treatment. The subcellular localization of Cav2 underwent a similar time-dependent change in response to DDAVP exposure, appearing at the apical border of CD PCs after 1 day of DDAVP treatment of rats from all three strains and localizing mostly apically by 14 days.
Bipolar Cav1 membrane localization and its overlap with apical AQP2 were confirmed by immunogold electron microscopy. Unexpectedly, morphologically detectable caveolae were absent from the apical membrane of principal cells, despite the presence of abundant apical Cav1 staining after DDAVP treatment.
Quantitative immunoblot results did not reveal an increase in Cav1 protein in response to DDAVP exposure. Because these experiments were performed on whole kidney homogenates, it is conceivable that a CD PC-specific response may be masked to some extent by contributions from other tubules (such as connecting segments or distal convoluted tubules) or endothelial cells–and a similar argument could be made for the mRNA data. However, even with this limitation, a change in Cav1 protein levels that would quantitatively match our immunofluorescence and immunoelectron microscopy results seems unlikely to be missed by quantitative immunoblot analysis. This issue can only be decisively solved by analyzing isolated CDs or, even better, pure populations of isolated PCs. With this caveat, our data indicate that the apical Cav1 is probably not derived from increased de novo synthesis during the hormonal treatment. In fact, Cav1 protein levels exhibited an opposite, decreasing trend after 3 days of DDAVP treatment, which became statistically significant after 14 days. Consequently, these results suggest that DDAVP causes Cav1 relocalization and/or alters the targeting of newly synthesized Cav1.
Our data suggest that Cav1 may play a role in the vasopressin signaling pathway and potentially in AQP2 trafficking. This is also supported by the finding that the Cav1 localization shift in response to DDAVP is exclusive to CD PCs and is not seen in other cell types, such as those of distal convoluted tubules. AQP2 membrane accumulation in response to vasopressin stimulation is mediated by a “shuttling” mechanism that relocates water channels from intracellular vesicles to the plasma membrane (10, 40, 55). In PCs, AQP2 localizes to clathrin-coated pits in the apical membrane domain and is endocytosed by a clathrin-mediated mechanism (67). This implies that its internalization does not involve caveolae or Cav proteins. The fact that AQP2 internalization occurs in a dynamin-sensitive manner (67) does not, however, rule out the possibility of at least some Cav1 involvement, given that dynamin has been previously implicated in Cav1-mediated endocytosis (22, 41). Interestingly, AQP2 has been reported to be distributed in comparable amounts between detergent-resistant, Cav-1-containing lipid rafts and clathrin-containing nonraft membrane fractions in freshly isolated renal IMCD cells from SD rats (14, 75). Moreover, AQP2 phosphorylated at the crucially important S256 residue, whose phosphorylation is required for AQP2 membrane insertion in response to vasopressin stimulation (16, 25), as well as at S264, associates preferentially with the detergent-resistant fraction rather than with the nondetergent-resistant fraction of the cell plasma membrane (75). Furthermore, MDCK cells transfected with human AQP2 respond to forskolin stimulation by accumulating on the apical membrane in regions in which Cav1 is also expressed. Upon forskolin washout, the two proteins are internalized in the same early endosomes (3). The likelihood of an association between AQP2 and Cav1 is further highlighted by the fact that these proteins also coimmunoprecipitated in this MDCK cell model, and this interaction appears to be even more significant after forskolin treatment (3). However, we have so far been unable to confirm AQP2/Cav1 coimmunoprecipitation in rat kidney preparations (data not shown). Our data on PCs in vivo indicate that while Cav1 and AQP2 are closely colocalized in the apical membrane after DDAVP treatment, caveolae-mediated endocytosis of AQP2 is unlikely to be involved in the internalization of AQP2, because caveolae were not detectable in the apical membrane domain at any time. In most epithelial cells so far examined, Cavs are basolateral proteins and are usually (but not always) associated with morphologically detectable caveolae. We cannot rule out a role for caveolae in the internalization of AQP2 from the basolateral cell surface, in which both caveolae and clathrin-coated pits are abundant.
In conclusion, our findings indicate that Cav1 and Cav2 respond to vasopressin treatment by localizing to the apical membrane domain of PCs from BB, LE, and SD rats in a time-dependent manner. It is interesting that normal LE and SD rats given ad libitum access to water do not exhibit apical Cav expression despite having urine concentrations much greater than vasopressin-deficient BB rats. This indicates that, as expected, vasopressin is actively stimulating PC water reabsorption in these animals without any increased apical Cav1 or Cav2 expression. The mechanism by which higher levels of circulating vasopressin trigger the Cav1 and Cav2 redistribution response remains to be determined in future studies. Finally, the absence of apical caveolae indicates that while Cavs may have an as-yet-undetermined role in vasopressin-regulated signaling processes, this is probably unrelated to AQP2 internalization by caveolae.
DISCLOSURES
No conflicts of interest, financial or otherwise, are declared by the author(s).
AUTHOR CONTRIBUTIONS
Author contributions: T.G.P., H.A.J.L., L.M.R., N.M.P.-S., and D.B. conception and design of research; T.G.P., H.A.J.L., L.M.R., N.M.P.-S., M.M., M.M.M., and B.E.B. performed experiments; T.G.P., M.M.M., and B.E.B. analyzed data; T.G.P., H.A.J.L., L.M.R., N.M.P.-S., M.M.M., S.B., and D.B. interpreted results of experiments; T.G.P. prepared figures; T.G.P. drafted manuscript; T.G.P., H.A.J.L., L.M.R., N.M.P.-S., M.M.M., S.B., and D.B. edited and revised manuscript; T.G.P., H.A.J.L., L.M.R., N.M.P.-S., M.M., M.M.M., B.E.B., S.B., and D.B. approved final version of manuscript.
ACKNOWLEDGMENTS
This work was supported by National Institutes of Health (NIH) Grants DK-73266 (to T. G. Păunescu), DK-075940 (to H. A. J. Lu), HD-045524 (to N. M. Pastor-Soler), DK-38452 (to D. Brown and S. Breton), and DK-96586 (to D. Brown). Additional support for the Program in Membrane Biology Microscopy Core comes from the Boston Area Diabetes and Endocrinology Research Center (NIH Grant DK-57521) and the MGH Center for the Study of Inflammatory Bowel Disease (NIH Grant DK-43351).
REFERENCES
- 1.Ahmed SN, Brown DA, London E. On the origin of sphingolipid/cholesterol-rich detergent-insoluble cell membranes: physiological concentrations of cholesterol and sphingolipid induce formation of a detergent-insoluble, liquid-ordered lipid phase in model membranes. Biochemistry 36: 10944–10953, 1997 [DOI] [PubMed] [Google Scholar]
- 2.Anderson RG, Kamen BA, Rothberg KG, Lacey SW. Potocytosis: sequestration and transport of small molecules by caveolae. Science 255: 410–411, 1992 [DOI] [PubMed] [Google Scholar]
- 3.Aoki T, Suzuki T, Hagiwara H, Kuwahara M, Sasaki S, Takata K, Matsuzaki T. Close association of aquaporin-2 internalization with caveolin-1. Acta Histochem Cytochem 45: 139–146, 2012 [DOI] [PMC free article] [PubMed] [Google Scholar]
- 4.Bagnis C, Marshansky V, Breton S, Brown D. Remodeling the cellular profile of collecting ducts by chronic carbonic anhydrase inhibition. Am J Physiol Renal Physiol 280: F437–F448, 2001 [DOI] [PubMed] [Google Scholar]
- 5.Breton S, Lisanti MP, Tyszkowski R, McLaughlin M, Brown D. Basolateral distribution of caveolin-1 in the kidney. Absence from H+-ATPase-coated endocytic vesicles in intercalated cells. J Histochem Cytochem 46: 205–214, 1998 [DOI] [PubMed] [Google Scholar]
- 6.Breton S, Wiederhold T, Marshansky V, Nsumu NN, Ramesh V, Brown D. The B1 subunit of the H+ATPase is a PDZ domain-binding protein. Colocalization with NHE-RF in renal B-intercalated cells. J Biol Chem 275: 18219–18224, 2000 [DOI] [PubMed] [Google Scholar]
- 7.Brown D, Lydon J, McLaughlin M, Stuart-Tilley A, Tyszkowski R, Alper S. Antigen retrieval in cryostat tissue sections and cultured cells by treatment with sodium dodecyl sulfate (SDS). Histochem Cell Biol 105: 261–267, 1996 [DOI] [PubMed] [Google Scholar]
- 8.Carozzi AJ, Ikonen E, Lindsay MR, Parton RG. Role of cholesterol in developing T-tubules: analogous mechanisms for T-tubule and caveolae biogenesis. Traffic 1: 326–341, 2000 [DOI] [PubMed] [Google Scholar]
- 9.Da Silva N, Shum WW, El-Annan J, Păunescu TG, McKee M, Smith PJ, Brown D, Breton S. Relocalization of the V-ATPase B2 subunit to the apical membrane of epididymal clear cells of mice deficient in the B1 subunit. Am J Physiol Cell Physiol 293: C199–C210, 2007 [DOI] [PubMed] [Google Scholar]
- 10.Deen PMT, Brown D. Trafficking of native and mutant mammalian MIP proteins. In: Aquaporins: Current Topics in Membranes, edited by Hohmann S, Nielsen S, Agre P. New York: Academic, 2001, p. 235–276 [Google Scholar]
- 11.del Pozo MA, Balasubramanian N, Alderson NB, Kiosses WB, Grande-Garcia A, Anderson RG, Schwartz MA. Phospho-caveolin-1 mediates integrin-regulated membrane domain internalization. Nat Cell Biol 7: 901–908, 2005 [DOI] [PMC free article] [PubMed] [Google Scholar]
- 12.Dupree P, Parton RG, Raposo G, Kurzchalia TV, Simons K. Caveolae and sorting in the trans-Golgi network of epithelial cells. EMBO J 12: 1597–1605, 1993 [DOI] [PMC free article] [PubMed] [Google Scholar]
- 13.Engelman JA, Wykoff CC, Yasuhara S, Song KS, Okamoto T, Lisanti MP. Recombinant expression of caveolin-1 in oncogenically transformed cells abrogates anchorage-independent growth. J Biol Chem 272: 16374–16381, 1997 [DOI] [PubMed] [Google Scholar]
- 14.Feng X, Huang H, Yang Y, Frohlich O, Klein JD, Sands JM, Chen G. Caveolin-1 directly interacts with UT-A1 urea transporter: the role of caveolae/lipid rafts in UT-A1 regulation at the cell membrane. Am J Physiol Renal Physiol 296: F1514–F1520, 2009 [DOI] [PMC free article] [PubMed] [Google Scholar]
- 15.Fra AM, Williamson E, Simons K, Parton RG. De novo formation of caveolae in lymphocytes by expression of VIP21-caveolin. Proc Natl Acad Sci USA 92: 8655–8659, 1995 [DOI] [PMC free article] [PubMed] [Google Scholar]
- 16.Fushimi K, Sasaki S, Marumo F. Phosphorylation of serine 256 is required for cAMP-dependent regulatory exocytosis of the aquaporin-2 water channel. J Biol Chem 272: 14800–14804, 1997 [DOI] [PubMed] [Google Scholar]
- 17.Gagescu R, Demaurex N, Parton RG, Hunziker W, Huber LA, Gruenberg J. The recycling endosome of Madin-Darby canine kidney cells is a mildly acidic compartment rich in raft components. Mol Biol Cell 11: 2775–2791, 2000 [DOI] [PMC free article] [PubMed] [Google Scholar]
- 18.Galbiati F, Volonte D, Engelman JA, Watanabe G, Burk R, Pestell RG, Lisanti MP. Targeted downregulation of caveolin-1 is sufficient to drive cell transformation and hyperactivate the p42/44 MAP kinase cascade. EMBO J 17: 6633–6648, 1998 [DOI] [PMC free article] [PubMed] [Google Scholar]
- 19.Galbiati F, Volonte D, Liu J, Capozza F, Frank PG, Zhu L, Pestell RG, Lisanti MP. Caveolin-1 expression negatively regulates cell cycle progression by inducing G0/G1 arrest via a p53/p21(WAF1/Cip1)-dependent mechanism. Mol Biol Cell 12: 2229–2244, 2001 [DOI] [PMC free article] [PubMed] [Google Scholar]
- 20.Gilbert A, Paccaud JP, Foti M, Porcheron G, Balz J, Carpentier JL. Direct demonstration of the endocytic function of caveolae by a cell-free assay. J Cell Sci 112: 1101–1110, 1999 [DOI] [PubMed] [Google Scholar]
- 21.Hailstones D, Sleer LS, Parton RG, Stanley KK. Regulation of caveolin and caveolae by cholesterol in MDCK cells. J Lipid Res 39: 369–379, 1998 [PubMed] [Google Scholar]
- 22.Henley JR, Krueger EW, Oswald BJ, McNiven MA. Dynamin-mediated internalization of caveolae. J Cell Biol 141: 85–99, 1998 [DOI] [PMC free article] [PubMed] [Google Scholar]
- 23.Hill MM, Bastiani M, Luetterforst R, Kirkham M, Kirkham A, Nixon SJ, Walser P, Abankwa D, Oorschot VM, Martin S, Hancock JF, Parton RG. PTRF-Cavin, a conserved cytoplasmic protein required for caveola formation and function. Cell 132: 113–124, 2008 [DOI] [PMC free article] [PubMed] [Google Scholar]
- 24.Hulit J, Bash T, Fu M, Galbiati F, Albanese C, Sage DR, Schlegel A, Zhurinsky J, Shtutman M, Ben-Ze'ev A, Lisanti MP, Pestell RG. The cyclin D1 gene is transcriptionally repressed by caveolin-1. J Biol Chem 275: 21203–21209, 2000 [DOI] [PubMed] [Google Scholar]
- 25.Katsura T, Gustafson CE, Ausiello DA, Brown D. Protein kinase A phosphorylation is involved in regulated exocytosis of aquaporin-2 in transfected LLC-PK1 cells. Am J Physiol Renal Physiol 272: F817–F822, 1997 [PubMed] [Google Scholar]
- 26.Kurzchalia TV, Dupree P, Parton RG, Kellner R, Virta H, Lehnert M, Simons K. VIP21, a 21-kD membrane protein is an integral component of trans-Golgi-network-derived transport vesicles. J Cell Biol 118: 1003–1014, 1992 [DOI] [PMC free article] [PubMed] [Google Scholar]
- 27.Laycock JF, Lee J, Lewis AF. The effect of chlorpropamide on water balance in pitressin-treated Brattleboro rats. Br J Pharmacol 52: 253–263, 1974 [DOI] [PMC free article] [PubMed] [Google Scholar]
- 28.Lee SW, Reimer CL, Oh P, Campbell DB, Schnitzer JE. Tumor cell growth inhibition by caveolin re-expression in human breast cancer cells. Oncogene 16: 1391–1397, 1998 [DOI] [PubMed] [Google Scholar]
- 29.Li S, Okamoto T, Chun M, Sargiacomo M, Casanova JE, Hansen SH, Nishimoto I, Lisanti MP. Evidence for a regulated interaction between heterotrimeric G proteins and caveolin. J Biol Chem 270: 15693–15701, 1995 [DOI] [PubMed] [Google Scholar]
- 30.Li S, Song KS, Lisanti MP. Expression and characterization of recombinant caveolin. Purification by polyhistidine tagging and cholesterol-dependent incorporation into defined lipid membranes. J Biol Chem 271: 568–573, 1996 [PubMed] [Google Scholar]
- 31.Liebl D, Difato F, Hornikova L, Mannova P, Stokrova J, Forstova J. Mouse polyomavirus enters early endosomes, requires their acidic pH for productive infection, and meets transferrin cargo in Rab11-positive endosomes. J Virol 80: 4610–4622, 2006 [DOI] [PMC free article] [PubMed] [Google Scholar]
- 32.Lisanti MP, Tang Z, Scherer PE, Kubler E, Koleske AJ, Sargiacomo M. Caveolae, transmembrane signalling and cellular transformation. Mol Membr Biol 12: 121–124, 1995 [DOI] [PubMed] [Google Scholar]
- 33.Liu J, Lee P, Galbiati F, Kitsis RN, Lisanti MP. Caveolin-1 expression sensitizes fibroblastic and epithelial cells to apoptotic stimulation. Am J Physiol Cell Physiol 280: C823–C835, 2001 [DOI] [PubMed] [Google Scholar]
- 34.Merkulova M, McKee M, Dip PV, Gruber G, Marshansky V. N-terminal domain of the V-ATPase a2-subunit displays integral membrane protein properties. Protein Sci 19: 1850–1862, 2010 [DOI] [PMC free article] [PubMed] [Google Scholar]
- 35.Mo S, Wang L, Li Q, Li J, Li Y, Thannickal VJ, Cui Z. Caveolin-1 regulates dorsoventral patterning through direct interaction with beta-catenin in zebrafish. Dev Biol 344: 210–223, 2010 [DOI] [PubMed] [Google Scholar]
- 36.Monier S, Dietzen DJ, Hastings WR, Lublin DM, Kurzchalia TV. Oligomerization of VIP21-caveolin in vitro is stabilized by long chain fatty acylation or cholesterol. FEBS Lett 388: 143–149, 1996 [DOI] [PubMed] [Google Scholar]
- 37.Montesano R, Roth J, Robert A, Orci L. Non-coated membrane invaginations are involved in binding and internalization of cholera and tetanus toxins. Nature 296: 651–653, 1982 [DOI] [PubMed] [Google Scholar]
- 38.Mora R, Bonilha VL, Marmorstein A, Scherer PE, Brown D, Lisanti MP, Rodriguez-Boulan E. Caveolin-2 localizes to the golgi complex but redistributes to plasma membrane, caveolae, and rafts when co-expressed with caveolin-1. J Biol Chem 274: 25708–25717, 1999 [DOI] [PubMed] [Google Scholar]
- 39.Murata M, Peranen J, Schreiner R, Wieland F, Kurzchalia TV, Simons K. VIP21/caveolin is a cholesterol-binding protein. Proc Natl Acad Sci USA 92: 10339–10343, 1995 [DOI] [PMC free article] [PubMed] [Google Scholar]
- 40.Nielsen S, Chou CL, Marples D, Christensen EI, Kishore BK, Knepper MA. Vasopressin increases water permeability of kidney collecting duct by inducing translocation of aquaporin-CD water channels to plasma membrane. Proc Natl Acad Sci USA 92: 1013–1017, 1995 [DOI] [PMC free article] [PubMed] [Google Scholar]
- 41.Oh P, McIntosh DP, Schnitzer JE. Dynamin at the neck of caveolae mediates their budding to form transport vesicles by GTP-driven fission from the plasma membrane of endothelium. J Cell Biol 141: 101–114, 1998 [DOI] [PMC free article] [PubMed] [Google Scholar]
- 42.Palade GE. Fine structure of blood capillaries. J Appl Physiol 24: 1424–1436, 1953 [Google Scholar]
- 43.Parton RG, Joggerst B, Simons K. Regulated internalization of caveolae. J Cell Biol 127: 1199–1215, 1994 [DOI] [PMC free article] [PubMed] [Google Scholar]
- 44.Pastor-Soler N, Isnard-Bagnis C, Herak-Kramberger C, Sabolic I, Van Hoek A, Brown D, Breton S. Expression of aquaporin 9 in the adult rat epididymal epithelium is modulated by androgens. Biol Reprod 66: 1716–1722, 2002 [DOI] [PubMed] [Google Scholar]
- 45.Păunescu TG, Da Silva N, Marshansky V, McKee M, Breton S, Brown D. Expression of the 56-kDa B2 subunit isoform of the vacuolar H+-ATPase in proton-secreting cells of the kidney and epididymis. Am J Physiol Cell Physiol 287: C149–C162, 2004 [DOI] [PubMed] [Google Scholar]
- 46.Păunescu TG, Da Silva N, Russo LM, McKee M, Lu HA, Breton S, Brown D. Association of soluble adenylyl cyclase with the V-ATPase in renal epithelial cells. Am J Physiol Renal Physiol 294: F130–F138, 2008 [DOI] [PubMed] [Google Scholar]
- 47.Păunescu TG, Jones AC, Tyszkowski R, Brown D. V-ATPase expression in the mouse olfactory epithelium. Am J Physiol Cell Physiol 295: C923–C930, 2008 [DOI] [PMC free article] [PubMed] [Google Scholar]
- 48.Păunescu TG, Ljubojevic M, Russo LM, Winter C, McLaughlin MM, Wagner CA, Breton S, Brown D. cAMP stimulates apical V-ATPase accumulation, microvillar elongation, and proton extrusion in kidney collecting duct A-intercalated cells. Am J Physiol Renal Physiol 298: F643–F654, 2010 [DOI] [PMC free article] [PubMed] [Google Scholar]
- 49.Păunescu TG, Russo LM, Da Silva N, Kovacikova J, Mohebbi N, Van Hoek AN, McKee M, Wagner CA, Breton S, Brown D. Compensatory membrane expression of the V-ATPase B2 subunit isoform in renal medullary intercalated cells of B1-deficient mice. Am J Physiol Renal Physiol 293: F1915–F1926, 2007 [DOI] [PubMed] [Google Scholar]
- 50.Predescu SA, Predescu DN, Palade GE. Plasmalemmal vesicles function as transcytotic carriers for small proteins in the continuous endothelium. Am J Physiol Heart Circ Physiol 272: H937–H949, 1997 [DOI] [PubMed] [Google Scholar]
- 51.Razani B, Combs TP, Wang XB, Frank PG, Park DS, Russell RG, Li M, Tang B, Jelicks LA, Scherer PE, Lisanti MP. Caveolin-1-deficient mice are lean, resistant to diet-induced obesity, and show hypertriglyceridemia with adipocyte abnormalities. J Biol Chem 277: 8635–8647, 2002 [DOI] [PubMed] [Google Scholar]
- 52.Razani B, Lisanti MP. Caveolins and caveolae: molecular and functional relationships. Exp Cell Res 271: 36–44, 2001 [DOI] [PubMed] [Google Scholar]
- 53.Rothberg KG, Heuser JE, Donzell WC, Ying YS, Glenney JR, Anderson RG. Caveolin, a protein component of caveolae membrane coats. Cell 68: 673–682, 1992 [DOI] [PubMed] [Google Scholar]
- 54.Russo LM, McKee M, Brown D. Methyl-β-cyclodextrin induces vasopressin-independent apical accumulation of aquaporin-2 in the isolated, perfused rat kidney. Am J Physiol Renal Physiol 291: F246–F253, 2006 [DOI] [PubMed] [Google Scholar]
- 55.Sabolic I, Katsura T, Verbavatz JM, Brown D. The AQP2 water channel: effect of vasopressin treatment, microtubule disruption, and distribution in neonatal rats. J Membr Biol 143: 165–175, 1995 [DOI] [PubMed] [Google Scholar]
- 56.Sato K, Sato M, Audhya A, Oegema K, Schweinsberg P, Grant BD. Dynamic regulation of caveolin-1 trafficking in the germ line and embryo of Caenorhabditis elegans. Mol Biol Cell 17: 3085–3094, 2006 [DOI] [PMC free article] [PubMed] [Google Scholar]
- 57.Scheiffele P, Verkade P, Fra AM, Virta H, Simons K, Ikonen E. Caveolin-1 and -2 in the exocytic pathway of MDCK cells. J Cell Biol 140: 795–806, 1998 [DOI] [PMC free article] [PubMed] [Google Scholar]
- 58.Scherer PE, Lewis RY, Volonte D, Engelman JA, Galbiati F, Couet J, Kohtz DS, van Donselaar E, Peters P, Lisanti MP. Cell-type and tissue-specific expression of caveolin-2. Caveolins 1 and 2 co-localize and form a stable hetero-oligomeric complex in vivo. J Biol Chem 272: 29337–29346, 1997 [DOI] [PubMed] [Google Scholar]
- 59.Scherer PE, Okamoto T, Chun M, Nishimoto I, Lodish HF, Lisanti MP. Identification, sequence, and expression of caveolin-2 defines a caveolin gene family. Proc Natl Acad Sci USA 93: 131–135, 1996 [DOI] [PMC free article] [PubMed] [Google Scholar]
- 60.Schnitzer JE, Oh P, Pinney E, Allard J. Filipin-sensitive caveolae-mediated transport in endothelium: reduced transcytosis, scavenger endocytosis, and capillary permeability of select macromolecules. J Cell Biol 127: 1217–1232, 1994 [DOI] [PMC free article] [PubMed] [Google Scholar]
- 61.Schroeder R, London E, Brown D. Interactions between saturated acyl chains confer detergent resistance on lipids and glycosylphosphatidylinositol (GPI)-anchored proteins: GPI-anchored proteins in liposomes and cells show similar behavior. Proc Natl Acad Sci USA 91: 12130–12134, 1994 [DOI] [PMC free article] [PubMed] [Google Scholar]
- 62.Simionescu N. Cellular aspects of transcapillary exchange. Physiol Rev 63: 1536–1579, 1983 [DOI] [PubMed] [Google Scholar]
- 63.Smart EJ, Foster DC, Ying YS, Kamen BA, Anderson RG. Protein kinase C activators inhibit receptor-mediated potocytosis by preventing internalization of caveolae. J Cell Biol 124: 307–313, 1994 [DOI] [PMC free article] [PubMed] [Google Scholar]
- 64.Smart EJ, Ying Y, Donzell WC, Anderson RG. A role for caveolin in transport of cholesterol from endoplasmic reticulum to plasma membrane. J Biol Chem 271: 29427–29435, 1996 [DOI] [PubMed] [Google Scholar]
- 65.Smart EJ, Ying YS, Conrad PA, Anderson RG. Caveolin moves from caveolae to the Golgi apparatus in response to cholesterol oxidation. J Cell Biol 127: 1185–1197, 1994 [DOI] [PMC free article] [PubMed] [Google Scholar]
- 66.Song KS, Scherer PE, Tang Z, Okamoto T, Li S, Chafel M, Chu C, Kohtz DS, Lisanti MP. Expression of caveolin-3 in skeletal, cardiac, and smooth muscle cells. Caveolin-3 is a component of the sarcolemma and co-fractionates with dystrophin and dystrophin-associated glycoproteins. J Biol Chem 271: 15160–15165, 1996 [DOI] [PubMed] [Google Scholar]
- 67.Sun TX, Van Hoek A, Huang Y, Bouley R, McLaughlin M, Brown D. Aquaporin-2 localization in clathrin-coated pits: inhibition of endocytosis by dominant-negative dynamin. Am J Physiol Renal Physiol 282: F998–F1011, 2002 [DOI] [PubMed] [Google Scholar]
- 68.Tang Z, Scherer PE, Okamoto T, Song K, Chu C, Kohtz DS, Nishimoto I, Lodish HF, Lisanti MP. Molecular cloning of caveolin-3, a novel member of the caveolin gene family expressed predominantly in muscle. J Biol Chem 271: 2255–2261, 1996 [DOI] [PubMed] [Google Scholar]
- 69.Vasile E, Simionescu M, Simionescu N. Visualization of the binding, endocytosis, and transcytosis of low-density lipoprotein in the arterial endothelium in situ. J Cell Biol 96: 1677–1689, 1983 [DOI] [PMC free article] [PubMed] [Google Scholar]
- 70.Verkade P, Harder T, Lafont F, Simons K. Induction of caveolae in the apical plasma membrane of Madin-Darby canine kidney cells. J Cell Biol 148: 727–739, 2000 [DOI] [PMC free article] [PubMed] [Google Scholar]
- 71.Vogel U, Sandvig K, van Deurs B. Expression of caveolin-1 and polarized formation of invaginated caveolae in Caco-2 and MDCK II cells. J Cell Sci 111: 825–832, 1998 [DOI] [PubMed] [Google Scholar]
- 72.Wandinger-Ness A, Bennett MK, Antony C, Simons K. Distinct transport vesicles mediate the delivery of plasma membrane proteins to the apical and basolateral domains of MDCK cells. J Cell Biol 111: 987–1000, 1990 [DOI] [PMC free article] [PubMed] [Google Scholar]
- 73.Williams TM, Lisanti MP. The caveolin proteins. Genome Biol 5: 214, 2004 [DOI] [PMC free article] [PubMed] [Google Scholar]
- 74.Yamada E. The fine structure of the gall bladder epithelium of the mouse. J Biophys Biochem Cytol 1: 445–458, 1955 [DOI] [PMC free article] [PubMed] [Google Scholar]
- 75.Yu MJ, Pisitkun T, Wang G, Aranda JF, Gonzales PA, Tchapyjnikov D, Shen RF, Alonso MA, Knepper MA. Large-scale quantitative LC-MS/MS analysis of detergent-resistant membrane proteins from rat renal collecting duct. Am J Physiol Cell Physiol 295: C661–C678, 2008 [DOI] [PMC free article] [PubMed] [Google Scholar]
- 76.Zhuang Z, Marshansky V, Breton S, Brown D. Is caveolin involved in normal proximal tubule function? Presence in model PT systems but absence in situ. Am J Physiol Renal Physiol 300: F199–F206, 2011 [DOI] [PMC free article] [PubMed] [Google Scholar]


