Abstract
Monocyte/macrophage recruitment correlates strongly with the progression of renal impairment in diabetic nephropathy (DN), yet their direct role is not clear. We hypothesized that macrophages contribute to direct podocyte injury and/or an abnormal podocyte niche leading to DN. Experiments were conducted in CD11b-DTR mice treated with diphtheria toxin (DT) to deplete macrophages after streptozotocin-induced diabetes. Additional experiments were conducted in bone marrow chimeric (CD11b-DTR→ C57BL6/J) mice. Diabetes was associated with an increase in the M1-to-M2 ratio by 6 wk after the induction of diabetes. Macrophage depletion in diabetic CD11b-DTR mice significantly attenuated albuminuria, kidney macrophage recruitment, and glomerular histological changes and preserved kidney nephrin and podocin expression compared with diabetic CD11b-DTR mice treated with mutant DT. These data were confirmed in chimeric mice indicating a direct role of bone marrow-derived macrophages in DN. In vitro, podocytes grown in high-glucose media significantly increased macrophage migration compared with podocytes grown in normal glucose media. In addition, classically activated M1 macrophages, but not M2 macrophages, induced podocyte permeability. These findings provide evidence showing that macrophages directly contribute to kidney injury in DN, perhaps by altering podocyte integrity through the proinflammatory M1 subset of macrophages. Attenuating the deleterious effects of macrophages on podocytes could provide a new therapeutic approach to the treatment of DN.
Keywords: macrophages, diabetic nephropathy, podocytes
diabetic nephropathy (DN) is the leading cause of end-stage kidney disease, responsible for >40% of all cases in the United States, and this number is likely to increase unabated (6). Thus, it is important to identify the mechanisms involved in the development of diabetic kidney disease. Early alterations in diabetic kidneys include the development of glomerular hyperfiltration and hypertrophy followed by thickening of the glomerular basement membrane, mesangial matrix accumulation, an increased urinary albumin excretion (UAE) rate, and, ultimately, the progression to glomerular sclerosis and end-stage renal failure.
Macrophage heterogeneity plays a role in tissue injury and repair, mainly through classically activated (proinflammatory) M1 macrophages the alternatively activated (anti-inflammatory) M2 macrophages, respectively (19). Monocytes and/or macrophages, their adherence to endothelial cells, and overexpression of proinflammatory cytokines and chemokines contribute to the pathogenesis of DN (10–12, 35). However, whether macrophage recruitment is the cause or a consequence of chronic kidney injury is still debated. Infiltrating macrophages release lysosomal enzymes, nitric oxide, ROS, transforming growth factor-β, VEGF, and cytokines such as TNF-α, IL-1, and interferon (IFN)-γ (41), which could play a pivotal role in the development and progression of DN. Diminished macrophage infiltration associated with reduced urinary albumin excretion has been shown in chemokine (C-C motif) receptor 2 (CCR2)- and monocyte chemoattractant protein (MCP)-1-deficient mice in both type 1 and type 2 diabetes (2, 11, 12, 37). In human studies, glomerular macrophage accumulation occurs in DN (4, 17, 22, 35) and correlates strongly with the progression of renal impairment (35). Furthermore, macrophage accumulation in diabetic kidneys correlates strongly with serum creatinine, interstitial myofibroblast accumulation, and interstitial fibrosis scores (2, 13, 14, 32, 36, 47). These data suggest a role for macrophages and potentially other bone marrow-derived cells in the genesis and maintenance of inflammation leading to diabetic renal complications. While a pathogenic role for macrophages and macrophage-produced mediators has been shown for a number of forms of kidney disease (2, 5, 13, 23, 30–32, 38, 39, 42, 43), their role in DN remains unclear.
In a recent report (2), we demonstrated that monocyte CCR2 mediates macrophage-induced diabetic renal injury. In the present work, we first characterized the macrophage phenotype (M1/M2) during the course of diabetes. We further used a CD11b-DTR transgenic model to chronically deplete monocytes/macrophages by the administration of diphtheria toxin (DT). We show that bone marrow-derived macrophages directly contribute to diabetic kidney injury. In vitro, we provide evidence for direct podocyte/macrophage interactions and that M1, but not M2, macrophages impair podocyte integrity.
MATERIALS AND METHODS
Diabetic mouse models.
All animal experiments were approved by the Institutional Animal Care and Use Committee of Penn State University College of Medicine. In vivo experiments were performed in male 6-wk-old B6.FVB-Tg(ITGAM-DTR/EGFP)34Lan/J (CD11b-DTR) mice (stock no. 006000, Jackson Laboratory, Bar Harbor, MN). Multiple low doses of streptozotocin (STZ; 50 mg/kg body wt dissolved in lactated Ringers solution, Sigma, St. Louis, MO) were injected intraperitoneally for 5 consecutive days to induce type 1 diabetes. STZ is a widely used and accepted model of type 1 diabetes despite its nonspecific tissue toxicity (8, 9). DT or mutant DT (List Biological Laboratories) was injected intraperitoneally at the dose of 25 ng/g body wt weekly for 6 wk beginning 1 wk after STZ injection. Additional experiments were conducted in chimeric mice as previously described (49). Briefly, donor (male CD11b-DTR) mice were euthanized, and their femurs were removed and flushed with RPMI medium containing 10% FCS to obtain bone marrow cells. Unfractionated bone marrow cells were washed and resuspended in PBS at a concentration of 20 million cells/ml. Recipient (male C57BL/6J) mice were lethally irradiated using a γ-cell irradiator (two doses of 600 rads, 4 h apart). Eight hours after the irradiation, 10 million donor bone marrow cells were injected into the lateral tail vein of recipients. Mice were maintained in specific pathogen-free conditions for 8 wk followed by STZ injection as described above. After 6 wk of DT or mutant DT injection, mice were euthanized, and their kidneys were removed for further experiments. Confirmation of bone marrow chimera was conducted using RT-PCR according to the protocol from Jackson Laboratory after 8 wk of bone marrow transplantation. Briefly, wild-type and chimeric mouse bone marrow were collected, and genomic DNA was isolated. The difference of the threshold cycle (CT) value (ΔΔCT) between wild-type and CD11b-DTR → C57BL6/J mice was used to calculate the percentage of bone marrow of chimeric mice derived from CD11b-DTR mice. Our data (ΔΔCT = 4.68) indicate that >95% of bone marrow in chimeric mice was from CD11b-DTR mice.
Blood pressure measurement.
Systolic blood pressure was measured using Coda blood pressure (Kent Scientific, Torrington, Connecticut) as we have previously described (2, 32). Mice were allowed to rest quietly for 10 min at 26°C. All measurements were performed at the same time for all groups to prevent any diurnal variations.
Histology and immunohistochemistry.
Mouse kidneys were fixed in 4% paraformaldehyde and embedded in paraffin, and 3-μm sections were cut. Sections were stained with periodic acid-Schiff. All glomeruli were examined at ×40 magnification in a blinded manner. All images were taken with an Olympus BX51 microscope and DP71 digital camera using cellSens Standard 1.6 image software. Images were obtained with a ×100 (oil) objective with a total magnification of ×1,000. Semiquantitative scores (0–4+) were assigned based on the masked readings. Mesangial matrix expansion or sclerosis scoring was performed as we have previously described (2, 32). For glomerular area measurements, individual glomeruli were imaged at ×600 total magnification using an Olympus BX51 microscope and DP71 digital camera with cellSens Standard 1.6 imaging software (Olympus America, Center Valley, PA). Glomeruli were traced using the closed polygon area feature and a Wacom Intuos 4 tablet. Fifteen glomeruli per mouse were analyzed in a blinded manner.
Immunohistochemistry for macrophages was performed using rat anti-mouse Mac-2 antibody (clone M3/38, Cedarlane, Burlington, NC) and rat anti-mouse F4/80 monoclonal antibody (Fitzgerald, Concord, MA) on paraffin sections as previously described (2, 32).
Flow cytometry.
Kidney macrophage content was analyzed by fluorescence-activated cell sorting (FACS) in a LSR-II flow cytometer (BD, Franklin Lakes, NJ) as previously described (2, 32). In brief, kidneys were removed, minced, digested, and then passed through a 40-μm filter mesh. Kidney macrophages were defined as CD45+CD11bhigh/F4/80low. All samples were preincubated with CD16/32 (2.4G) to block nonspecific Fc receptor binding site and 7-aminoactinomycin D (Invitrogen, Carlsbad, CA) to exclude dead cells. Counting beads (product no. PCB100, Invitrogen) were introduced in the experiments to determine the total number of CD45-positive cells per gram of kidney tissue. Data were analyzed using FlowJo software (version 8.8.6, Tree Star, Ashland, OR). All antibodies were provided by eBiosciences.
Analytic methodology.
The UAE rate was measured by ELISA using an Albuwell M kit (Exocell, Philadelphia, PA) as previously described (2, 32). Urine creatinine was determined using a Creatinine Liquid Reagents Assay kit (Diazyme Laboratories, Poway, CA) as previously described (2, 32). Blood urea nitrogen (BUN) was determined using Vitros DT6011 chemistry slides (Ortho-Clinical Diagnostics, Rochester, NY) as previously described (2, 32). Body composition was measured using LF90 Minispec Time Domain Nuclear Magnetic Resonance Spectrometer (Burker Optics, Billerica, MA) as previously described (2, 32).
Isolation of bone marrow-derived monocytes.
Bone marrow cells were isolated from the mouse femur and tibia under sterile conditions as previously described (2). In brief, bones were flushed with RPMI-1640 (Invitrogen-Life Technologies) plus 10% FBS. Marrow cells were passed sequentially through a 22-gauge needle followed by three passages through a 25-gauge needle to obtain single cell suspensions of bone marrow cells. Monocytes were isolated from bone marrow cells using the STEMCELL (Vancouver, BC, Canada) mouse monocyte enrichment negative selection kit according to the manufacturer's protocols. The enriched population comprised >90% monocytes (data not shown) and was further processed into M0, M1, or M2 macrophages. M0 macrophages were cultured in RPMI-1640 supplemented with 10% FBS, 1% glutamate, 20 μg/ml gentamycin, 55 μM 2-mercaptoethanol, and 10 ng/ml macrophage colony-stimulating factor (R&D Systems) for 7 days. To induce M1 macrophages, cells were stimulated with 1 μg/ml lipopolysaccharide (Sigma) for an additional 24 h. To induce M2 macrophages, cells were incubated with 10 ng/mL IL-4 (R&D Systems) and 10 ng/ml IL-13 (R&D Systems) for an additional 48 h.
Murine podocyte culture.
Conditionally immortalized murine podocytes (kindly provided by Dr. John Sedor, Case Western Reserve University) were used in our in vitro experiments as we have previously described (3). Cells were grown under permissive conditions to propagate in RPMI-1640 containing 10% FBS, 100 U/ml penicillin, 100 μg/ml streptomycin, 2 mM glutamine, and 50 U/ml IFN-γ (R&D Systems) in a collagen type I-coated flask at 33°C. Cells were then grown under restrictive conditions for 10–14 days in the absence of IFN-γ at 37°C to allow cells to differentiate in either high-glucose (33 mM) or normal glucose (11 mM) media.
Quantitative RT-PCR.
Total RNA was isolated from kidney tissues using Tri Reagent (Molecular Research Center, Cincinnati, OH) per the manufacturer's instructions. Single-strand cDNA was synthesized using an iScript cDNA synthesis kit (Bio-Rad, Hercules, CA) for two-step quantitative RT-PCR. Mouse nephrin and podocin were amplified in the Bio-Rad CFX96 Real-Time System. Data were analyzed using Bio-Rad CFX Manager software (version 2.0). Relative expression quantification was calculated using the 2−ΔΔCT equation after normalization to GAPDH as previously described (1, 3).
For M1 and M2 macrophage markers, quantitative PCR assays were performed using an ABI-Prism 7900HT PCR system, TaqMan Fast Universal PCR master mixture (Applied Biosystems, Foster City, CA), and a TaqMan Gene Expression Assay Mix comprising Tnf (Mm00443260_g1) and mannose receptor (MR; Mm00485148_m1). A mouse Gapdh (Mm99999915_g1) assay mix served as the endogenous control. Data were analyzed using SDS software (version 2.2.2).
Western blot analysis.
Fifteen micrograms of kidney lysates were electrophoresed on ∼4–12% NuPAGE Bis-Tris Mini Gels (Life Technologies) and electroblotted onto polyvinylidene difluoride membranes (Millipore, Billerica, MA). Membranes were probed with antibodies for nephrin (catalog no. 20R-NP002, Fitzgerald Industries, Acton, MA), podocin (catalog no. P0372, Sigma-Aldrich), and β-actin (catalog no. A5441, Sigma-Aldrich), and immunoblots were developed with the appropriate secondary antibodies and enhanced chemiluminescence. Densitometric analysis of autoradiograms was performed using ImageJ software (National Institutes of Health; http://rsbweb.nih.gov/ij/index.html).
Macrophage migration assay.
The mouse bone marrow-derived macrophage migration assay was performed in a Boyden chamber transwell system (Corning, New York, NY). Macrophages were plated and cultured in the upper chamber on a 5-μm porous membrane while the lower chamber was plated with podocytes cultured in medium as indicated. Mouse MCP-1 (R&D Systems) was used as a positive control. Anti-mouse MCP-1 antibody (Santa Cruz Biotechnology, Santa Cruz, CA) was used as a negative control. Sixteen hours after the upper chamber was placed in the lower chamber, cells were removed from the upper side of the membrane, and cells in the lower side of the membrane were stained with crystal violet and visualized under a microscope.
Podocyte permeability assay.
Podocytes were plated at a density of 1 × 10⁵ cells on collagen type I-coated Transwell-Col PTFE filters (3-μm pore size, Corning) and cultured under differentiating conditions for 10 days. After differentiation, cells were washed with PBS supplemented with 1 mM MgCl2 and 1 mM CaCl2. The upper chamber was refilled with 0.5 ml RPMI-1640, and the lower chamber, in which bone marrow-derived macrophages were cultured as indicated, was refilled with RPMI-1640 supplemented with 40 mg/ml BSA and incubated for 6 h at 37°C as previously described (3). The total protein concentration in the upper compartment was measured using a Bio-Rad protein assay.
Statistical analysis.
Comparisons between groups were examined using SPSS (version 19.0) software for Windows (SPSS, Chicago, IL). Data are expressed as means ± SE. One-way ANOVA was used when more than two groups were compared, and the significance of observed differences among the groups was evaluated with a least-significant-difference post hoc test. Statistical significance was identified at P < 0.05.
RESULTS
M1 versus M2 kidney macrophages during the course of diabetes.
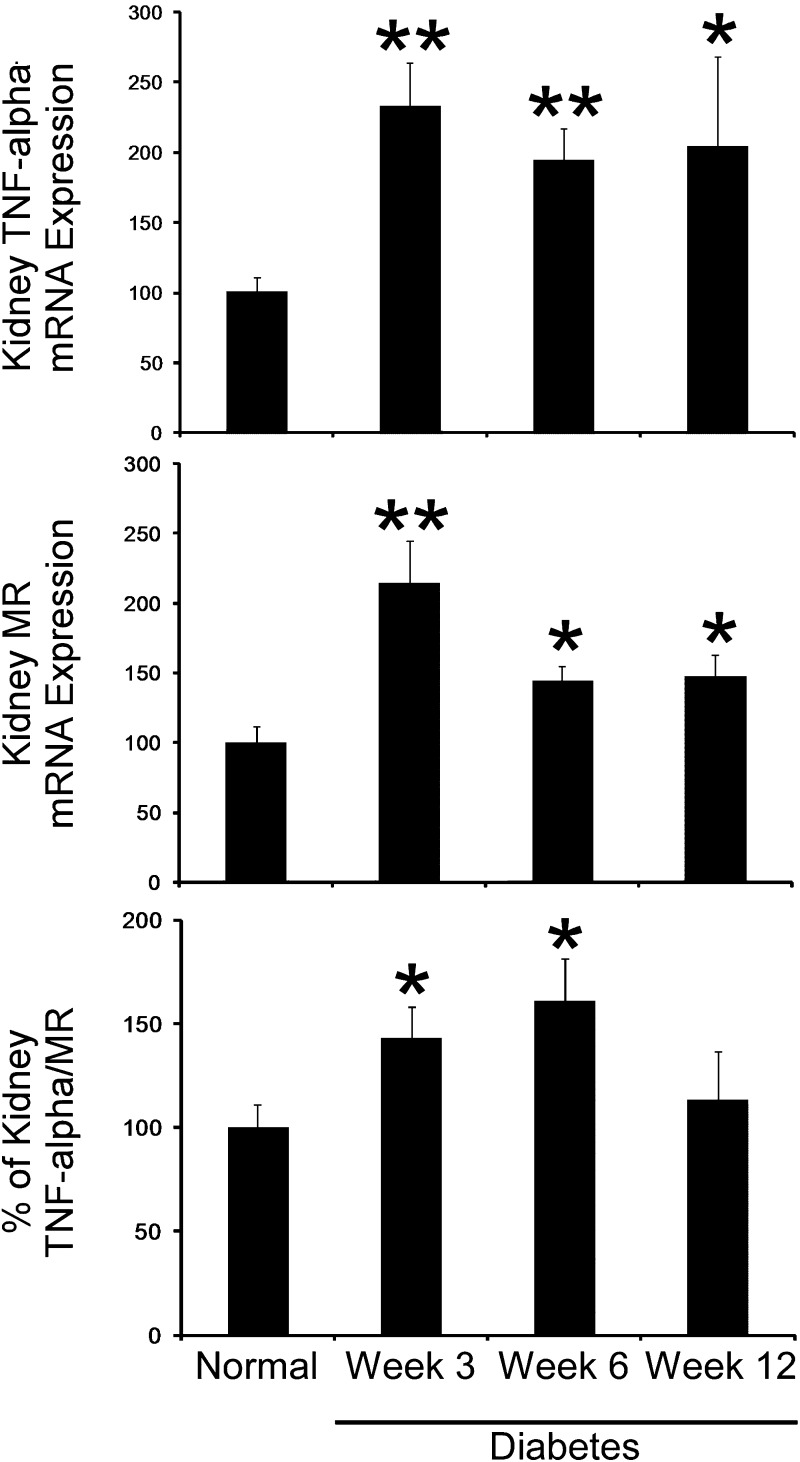
We first determined the distribution of kidney M1 and M2 markers during the course of diabetes. Kidneys were removed at baseline (normal) and 3, 6, and 12 weeks after STZ-induced diabetes (n = 6 animals/group) and subjected to RT-PCR analysis for total kidney M1 macrophage (TNF-α) and M2 macrophage (MR) markers. As shown in Fig. 1, DN was associated with an increase in both M1 and M2 macrophage markers after STZ-induced diabetes. Furthermore, the percentage of M1/M2 macrophage markers peaked at 6 wk after STZ-induced diabetes.
Fig. 1.
M1 versus M2 kidney macrophages during the course of diabetes. Kidneys were removed at baseline (normal) and 3, 6, and 9 wk after streptozotocin (STZ)-induced diabetes (n = 6 animals/group) and subjected to RT-PCR analysis for total kidney M1 macrophage (TNF-α) and M2 macrophage [mannose receptor (MR)] markers. Results are means ± SE. *P < 0.05 and **P < 0.001 compared with normal.
DT administration chronically depletes kidney macrophages in CD11b-DTR mice.
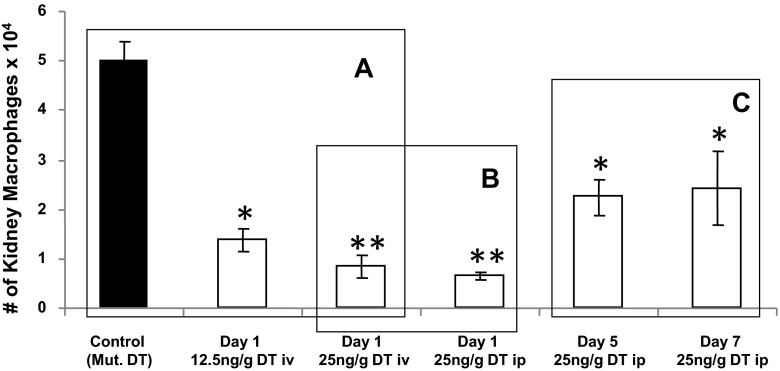
Next, we determined the dose (12.5 or 25 ng/g body wt), route (intravenous vs. intraperitoneal injection), and time (1, 5 or 7 days) response curves to DT in CD11b-DTR mice (16). Mouse kidneys were subjected to flow cytometry to determine the degree of kidney macrophage depletion. As shown in Fig. 2, a dose of 25 ng/g DT induced maximal kidney macrophage depletion compared with mutant DT (A) with no significant differences between intraperitoneal versus intravenous injection (B). Furthermore, the effect of kidney macrophage depletion was maintained for 7 days after DT administration (Fig. 2C). In contrast, B cells, T cells, and neutrophils did not change between all groups (data not shown). Therefore, we used a dose of 25 ng/g body wt DT in CD11b-DTR mice via intraperitoneal injection every 7 days in our experiments.
Fig. 2.
Dose, route, and time response curves of diphtheria toxin (DT) administration in CD11b-DTR mice. CD11b-DTR mice were administrated DT at the indicated doses/frequencies (A–C). Mice were euthanized, and mouse kidney tissues were collected, minced, digested, and subjected to flow cytometry. Macrophages were defined as CD11bhighF4/80low, and absolute macrophage numbers were calculated. Results are means ± SE. *P < 0.05 and **P < 0.01 compared with control (mutant DT).
DT injection decreases glomerular and tubulointerstitial macrophage recruitment in diabetic CD11b-DTR mice.
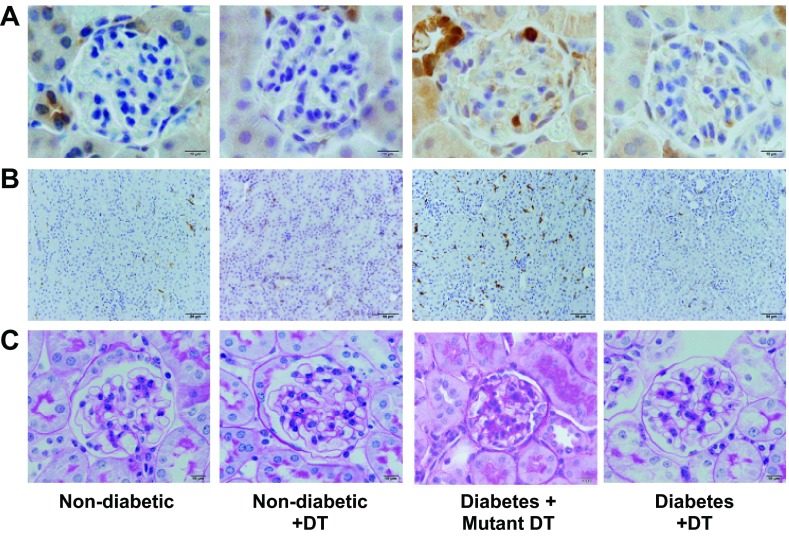
The distribution and number of macrophages were determined using immunohistochemistry in the glomeruli (Mac-2-positive macrophages; Fig. 3A) and tubulointerstitium (F4/80-positive macrophages; Fig. 3B). Our results showed increased glomerular and tubulointerstitial macrophage recruitment in the mutant DT-treated diabetic mouse group compared with the other groups.
Fig. 3.
DT treatment reduces glomerular and tubulointerstitial macrophage infiltration and renal histological changes in diabetic CD11b-DTR mice. A: Mac-2-positive macrophages in glomeruli were identified by immunohistochemical staining at 6 wk after STZ-induced diabetes in CD11b-DTR mice. Images are representative of 40 fields from each group of mice. B: F4/80-positive macrophages in the tubulointerstitium were identified by immunohistochemical staining at 6 wk after STZ-induced diabetes in CD11b-DTR mice. Images are representative of 40 fields from each group of mice. C: CD11b-DTR mouse kidney tissues were paraformaldehyde fixed and paraffin embedded. Tissue sections were stained with periodic acid-Schiff (PAS) as indicated. All glomeruli were examined at ×25 magnification, graded at ×40 magnification, and pictured at ×100 magnification (oil).
Similar results were obtained using flow cytometry (FACS; CD11bhighF4/80low) analysis of total kidney macrophage recruitment. Kidneys of mutant DT-treated diabetic CD11b-DTR mice had significantly greater numbers of macrophages compared with normal nondiabetic mice (2.3 ± 0.2 × 10⁴ vs. 1.5 ± 0.3 × 10⁴ macrophages/g kidney tissue, P < 0.01). In contrast, kidneys of DT-treated nondiabetic and diabetic CD11b-DTR mice had significantly reduced numbers of macrophages (1.1 ± 0.1 and 1.4 ± 0.04 × 10⁴ macrophages/g kidney tissue, P < 0.01) compared with mutant DT-treated diabetic CD11b-DTR mice.
Macrophage depletion reduces kidney hypertrophy in DN.
To assess the possible significance of macrophage depletion in diabetic mice, we administered DT or mutant DT to diabetic CD11b-DTR mice for 6 wk. We chose 6 wk since this is the period in which M1/M2 macrophage markers predominate (Fig. 1). As shown in Table 1, mutant DT-treated diabetic mice had increased blood glucose levels, increased kidney weight-to-body weight ratios, and increased glomerular area compared with nondiabetic mice treated with or without DT (CD11b-DTR background). Macrophage depletion using DT in diabetic CD11b-DTR mice significantly reduced kidney weight-to-body weight ratios and glomerular areas compared with mutant DT-treated diabetic mice despite comparable blood glucose and blood pressure levels.
Table 1.
General characteristics of CD11b-DTR mice
| Group | Nondiabetes | Nondiabetes + DT Treatment | Diabetes + Mutant DT Treatment | Diabetes + DT Treatment |
|---|---|---|---|---|
| Number of mice/group | 10 | 5 | 9 | 7 |
| Blood glucose, mg/dl | 171 ± 6a | 169 ± 9a | 487 ± 6 | 433 ± 30 |
| SBP, mmHg | 119 ± 3 | 116 ± 3 | 116 ± 3.0 | 114 ± 6 |
| Kidney weight/body weight, mg/g | 0.60 ± 0.03 | 0.57 ± 0.02 | 0.81 ± 0.03b | 0.61 ± 0.02 |
| Glomerular area, μm2 | 2011 ± 69 | 2110 ± 87 | 2490 ± 122c | 2131 ± 110 |
| Percent fluid | 6.6 ± 0.14 | 6.7 ± 0.10 | 5.9 ± 0.23 | 6.8 ± 0.18 |
| Plasma BUN, mg/dl | 25 ± 0.6 | 24 ± 1.1 | 35 ± 3.7c | 19 ± 1.6 |
Data are means ± SE. SBP, systolic blood pressure; BUN, blood urea nitrogen.
P < 0.01 compared with diabetes + mutant diptheria toxin (DT) treatment and diabetes + DT treatment;
P < 0.01 compared with nondiabetes, nondiabetes + DT treatment, and diabetes + DT treatment;
P < 0.05 compared with nondiabetes, nondiabetes + DT treatment, and diabetes + DT treatment.
Macrophage depletion decreases renal histological changes of DN.
Periodic acid-Schiff staining of kidney sections showed increased glomerular cellularity and mesangial expansion (score: 0.5 ± 0.05 vs. 0.2 ± 0.01, P < 0.01) after 6 wk of diabetes in mutant DT-treated diabetic mice compared with nondiabetic mice (Fig. 3C). Nondiabetic or diabetic CD11b-DTR mice depleted of macrophages with DT displayed significantly fewer glomerular histological changes (score: 0.2 ± 0.05 vs. 0.2 ± 0.03, P < 0.01) compared with mutant DT-treated diabetic CD11b-DTR mice (Fig. 3C).
Macrophage depletion reduces albuminuria and BUN in diabetic CD11b-DTR mice.
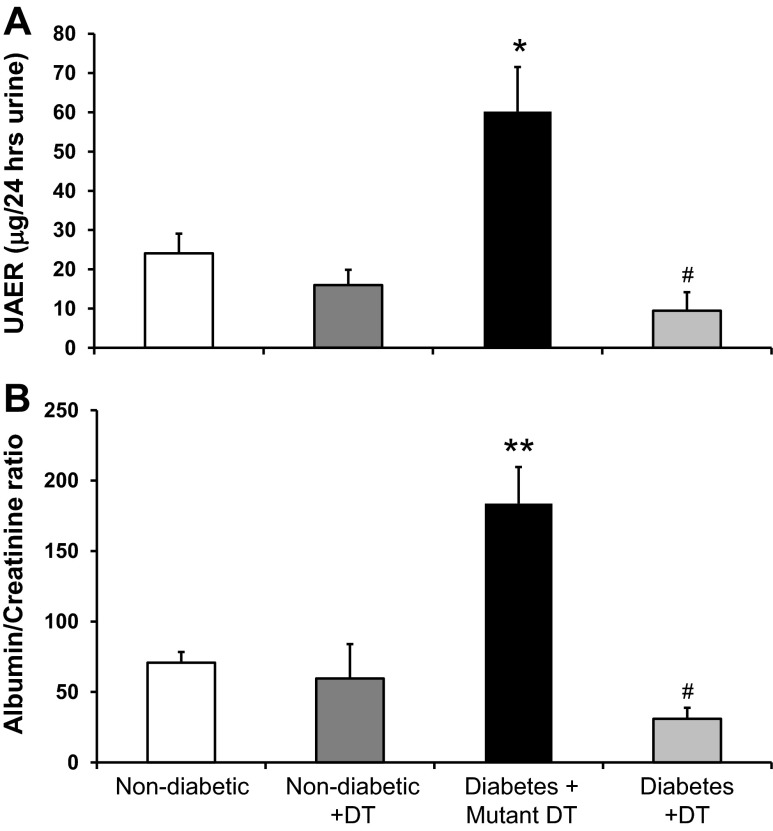
To determine if macrophages directly contribute to diabetic renal injury, we measured 24-h UAE, the urine albumin-to-creatinine ratio, and BUN as indicators of renal injury in nondiabetic and diabetic CD11b-DTR mice treated with DT or mutant DT for 6 wk after STZ injection. Mutant DT-treated diabetic CD11b-DTR mice had a significant increase in albuminuria (Fig. 4A), the urine albumin-to-creatinine ratio (Fig. 4B), and BUN (Table 1) compared with nondiabetic mice treated with or without DT. In contrast, DT treatment of diabetic CD11b-DTR mice significantly reduced renal dysfunction as evidenced by a reduction in albuminuria, the urine albumin-to-creatinine ratio, and BUN.
Fig. 4.
DT treatment attenuates diabetic renal injury. CD11b-DTR mice were injected with STZ at the dose of 50 mg/kg body wt ip for 5 days to induce type 1 diabetes; vehicle (ve) solution was injected as the control. After STZ injection, DT was injected intraperitoneally weekly for 6 wk; mutant DT was used as the negative control. Twenty-four-hour urine was collected for the measurement of urinary albumin excretion rate (UAER; A) and albumin-to-creatinine ratio (B). Results are means ± SE. *P < 0.05 and **P < 0.01 compared with nondiabetic groups with or without DT; #P < 0.01 compared with the mutant DT-treated diabetic group.
Macrophage depletion preserves nephrin and podocin mRNA and protein expression in diabetic CD11b-DTR mice.
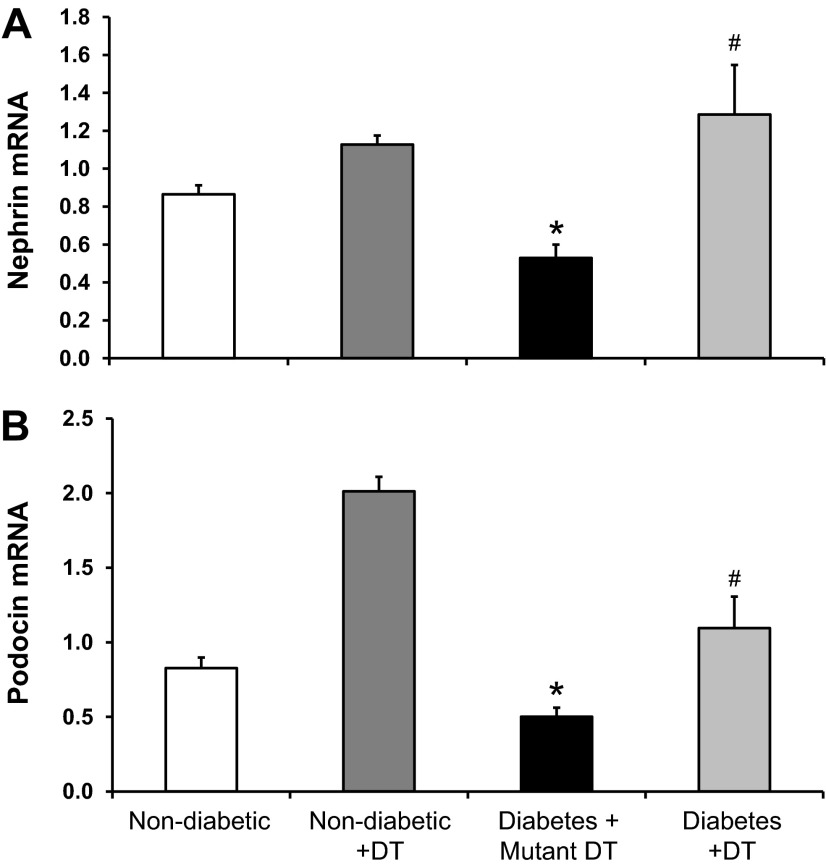
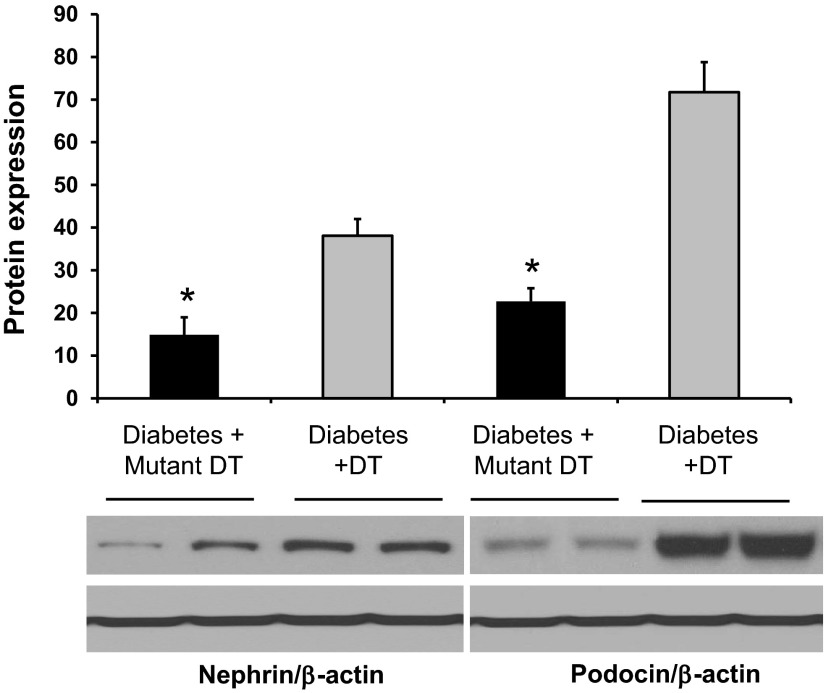
Podocyte structural proteins (nephrin and podocin) play critical roles in the maintenance of the slit diaphragm. We and others (1, 15, 34) have previously shown that DN is associated with a downregulation of nephrin and podocin mRNA expression. Therefore, we assessed the effect of macrophage depletion on the expression of nephrin and podocin mRNA in diabetic kidneys (Fig. 5). Mutant DT-treated diabetic CD11b-DTR mice exhibited a significant reduction in nephrin and podocin expression, an effect significantly prevented by DT treatment. Similar results were obtained using Western blot analysis of total kidney homogenates for nephrin and podocin protein expression (Fig. 6).
Fig. 5.
DT treatment restores nephrin and podocin mRNA expression in diabetic CD11b-DTR mice. Expression of kidney nephrin (A) and podocin (B) mRNA were normalized to GAPDH. Data are presented as relative fold changes between groups. Results are means ± SE. *P < 0.05 compared with nondiabetic groups with or without DT; #P < 0.05 compared with the mutant DT-treated diabetic group.
Fig. 6.
DT treatment restores nephrin and podocin protein expression in diabetic CD11b-DTR mice. Western blot analysis was performed to evaluate nephrin and podocin protein expression in kidney lysates at 6 wk after diabetes. β-Actin was used as a loading control. Quantification of nephrin and podocin expression was performed by densitometry followed by normalization to β-actin. Results are means ± SE. *P < 0.05 compared with the corresponding diabetes + DT group.
Macrophage/podocyte interaction in vitro.
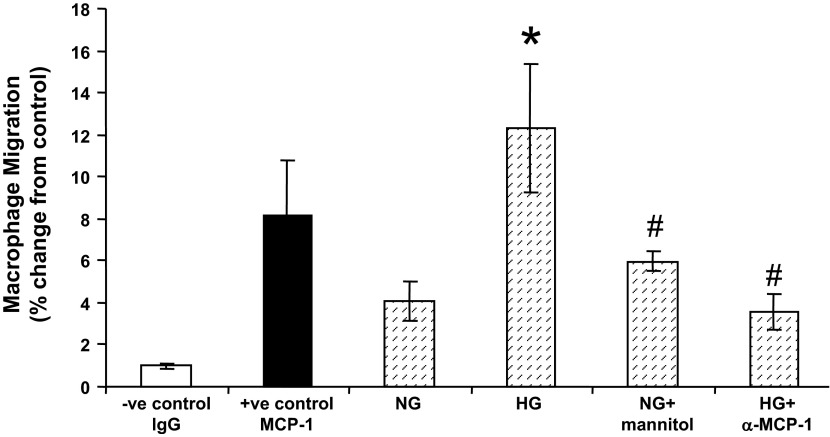
To test for direct effects of macrophages on podocyte injury, we first hypothesized that podocytes express chemokines under pathological conditions (including high glucose) that lead to the recruitment of macrophages. Therefore, we used an in vitro macrophage migration assay by culturing macrophages on the upper chamber while podocytes were grown in the lower chamber, as shown in Fig. 7. Our data demonstrate that podocytes grown in high-glucose media induced significantly more macrophage migration relative to those grown in normal glucose media. This effect was blocked by the addition of anti-MCP-1 antibody. Furthermore, this effect was indeed due to high glucose and not increased osmolality since normal glucose + mannitol treatment showed similar results to podocytes grown in normal glucose media.
Fig. 7.
Podocyte injury induces macrophage infiltration in vitro. A Transwell migration assay was performed. Podocytes were plated and cultured in six-well plates in culture medium with either normal glucose (NG) or high-glucose (HG) media as indicated. Macrophages were cultured in the upper chamber. Mouse IgG was used as the negative control, whereas mouse monocyte chemoattractant protein (MCP)-1 was used as positive control. Anti-mouse MCP-1 (α-MCP-1) antibody was added to neutralize MCP-1 as an additional control. Mannitol was used as the osmotic control. Sixteen hours after coculture with podocytes, migrated macrophages were counted, and percent changes of macrophage migration were determined. Results are means ± SE. *P < 0.05 compared with NG medium; #P < 0.01 compared with HG medium.
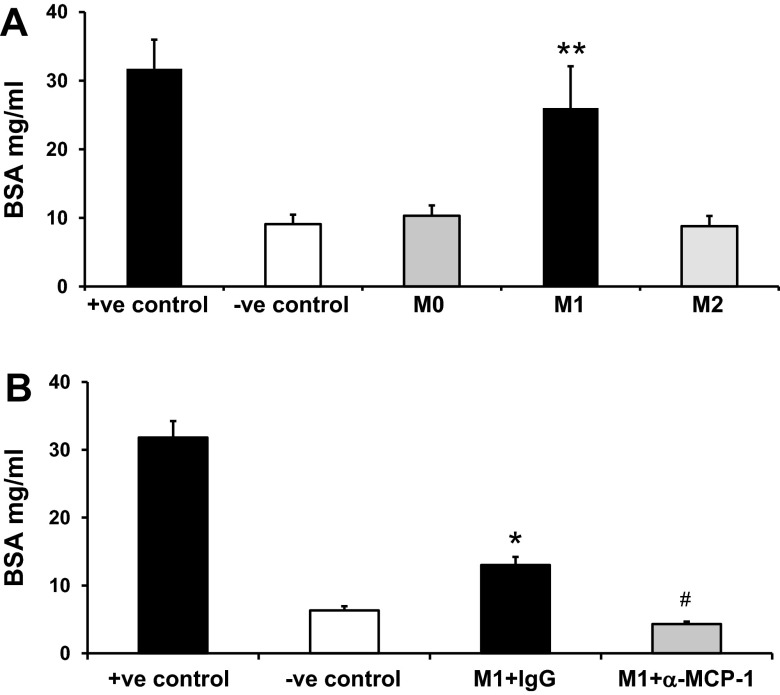
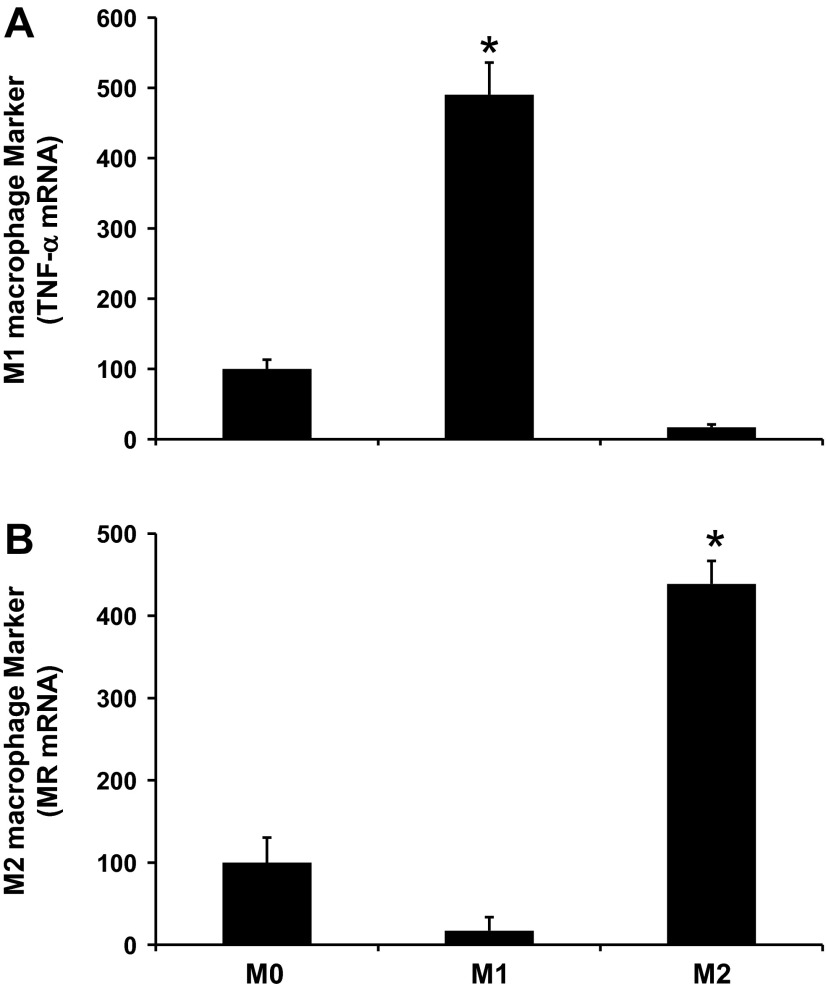
We next tested the direct effect of macrophages on podocyte permeability in vitro (Fig. 8). Our data showed that classically activated M1 macrophages, but not alternatively activated M2 macrophages, induced podocyte permeability in vitro (Fig. 8A). The effect of M1 macrophages on podocyte permeability was blocked by the addition of anti-MCP-1 antibody (Fig. 8B). Confirmation of M1 and M2 macrophage differentiation was performed using RT-PCR (Fig. 9). M1 macrophages showed increased TNF-α expression, whereas M2 macrophages showed increased MR expression.
Fig. 8.
M1 macrophages increased podocyte permeability in vitro. A and B: nouse bone marrow monocytes were isolated from C57BL6/J mice and cultured in RPMI-1640 supplemented with 10 ng/ml macrophage colony-stimulating factor for 7 days in six-well plates followed by M1 and M2 macrophage induction. Differentiated podocytes were cultured in Transwell membranes. Macrophages and podocytes were cocultured in the Transwell system to study the transepithelial passage of BSA during a 6-h period. Upper chamber media were collected to measure BSA concentration. The upper chamber membrane without podocytes was used as the positive control; no macrophages in the lower chamber was used as the negative control. A: macrophages without stimulation were defined as M0. B: M1 macrophages were seeded with IgG or anti-mouse MCP-1. Results are means ± SE. *P < 0.05 and **P < 0.001 compared with the negative control; #P < 0.01 compared with M1 macrophage + IgG.
Fig. 9.
Confirmation of bone marrow-derived M1 and M2 macrophages phenotypes in vitro. Bone marrow cells were isolated from the mouse femur and tibia using the STEMCELL mouse monocyte enrichment negative selection kit as described in materials and methods. Macrophages without stimulation were defined as M0. Macrophage differentiation was induced using lipopolysaccharide for 24 h (M1) or IL-4 and IL-13 for 48 h (M2). Confirmation of M1 and M2 macrophage differentiation was performed using RT-PCR for M1 (TNF-α; A) and M2 (MR; B) markers. Results are means ± SE. *P < 0.05 compared with M0.
Macrophage depletion reduces characteristics of DN in chimeric CD11b-DTR mice.
We next questioned whether the effect of DT was bone marrow or nonbone marrow dependent after diabetes. Toward this goal, we generated bone marrow chimeric (CD11b-DTR → wild-type) mice followed by STZ-induced diabetes. As shown in Table 2, both blood glucose and the kidney weight-to-body weight ratio were significantly increased in mutant DT-treated diabetic chimeric mice 6 wk after STZ injection. DT treatment in diabetic chimeric mice significantly reduced kidney weight-to-body weight ratios without affecting other parameters.
Table 2.
General characteristics of chimeric mice
| Treatment | Nondiabetes | Diabetes + Mutant DT Treatment | Diabetes + DT Treatment |
|---|---|---|---|
| Number of mice/group | 6 | 6 | 4 |
| Blood glucose, mg/dl | 140 ± 5a | 446 ± 20 | 447 ± 33 |
| SBP, mmHg | 115 ± 3 | 109 ± 4 | 105 ± 5 |
| Kidney weight/body weight, mg/g | 0.62 ± 0.01b | 0.79 ± 0.02c | 0.67 ± 0.04 |
| Percent fluid | 6.9 ± 0.13 | 6.4 ± 0.04 | 6.6 ± 0.06 |
| Plasma BUN, mg/dl | 35 ± 0.5d | 43 ± 3e | 35 ± 0.6 |
Data are means ± SE.
P < 0.01 compared with diabetes + mutant DT treatment and diabetes + DT treatment;
P < 0.01 compared with diabetes + mutant DT treatment;
P < 0.05 compared with diabetes + DT treatment;
P < 0.01 compared with diabetes + mutant DT treatment;
P < 0.05 compared with diabetes + DT treatment.
Macrophage depletion ameliorates renal dysfunction in diabetic chimeric mice.
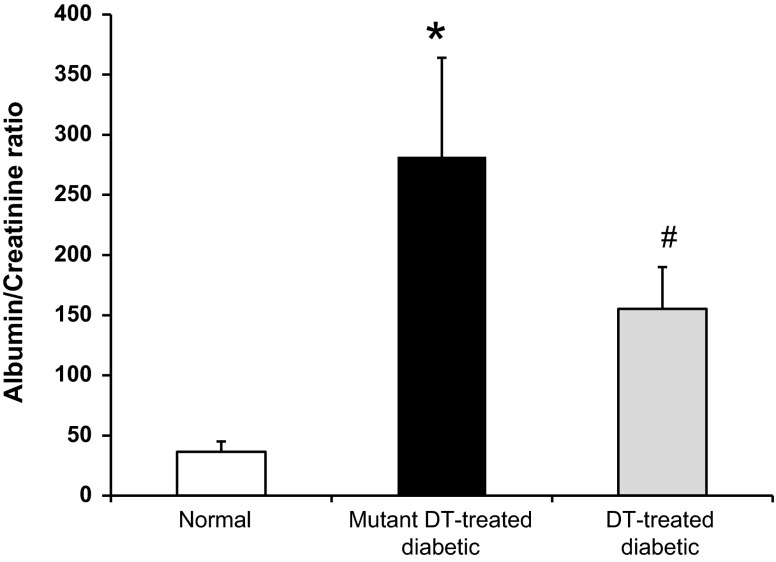
Mutant DT-treated diabetic chimeric mice had a significant increase in the urine albumin-to-creatinine ratio (Fig. 10) and BUN (Table 2) in a similar way to mutant DT-treated diabetic CD11b-DTR mice. In contrast, DT treatment of diabetic chimeric mice significantly ameliorated these changes in a similar manner to DT-treated diabetic CD11b-DTR mice.
Fig. 10.
DT treatment ameliorates renal damage in diabetic chimeric mice. Chimeric mice were injected with STZ to induce diabetes followed by DT treatment or mutant DT for 6 wk. Mouse urine was collected to determine the urine albumin-to-creatinine ratio. Results are means ± SE. *P < 0.05 compared with normal; #P < 0.05 compared with the mutant DT-treated diabetic group.
DISCUSSION
Macrophage accumulation is closely associated with chronic renal injury, yet their direct role in diabetic kidney injury has not been directly established. This study shows that macrophage depletion mediates renal tissue protection as evidenced by a reduction in albuminuria, BUN, histopathological changes, and kidney macrophage recruitment during diabetes. This effect is mainly mediated via bone marrow-derived macrophage depletion as determined in our chimeric experiment. Furthermore, our data provide the first evidence for direct podocyte/macrophage interaction and that M1, but not M2, macrophages impair podocyte integrity, possibly through MCP-1. These findings reveal an important direct role for macrophages in the pathogenesis of DN and provide evidence for macrophage and/or macrophage secretory product inhibition as a potential therapeutic modality for the primary prevention of DN. Additional studies are needed to test the role of macrophage depletion in secondary prevention in a later stage of DN. In addition, the dose-concentration effect of macrophage number and outcomes is not clear in our study. Additional studies are needed to clarify this.
Macrophages/monocytes are heterogeneous populations that play a pivotal role in different stages of inflammation in multiple organs. For instance, macrophages play an important role in inducing renal injuries through potent cytokines such as MCP-1 (18, 40, 44), TNF-α (42), and IL-1 (43). Furthermore, macrophage repletion can induce kidney dysfunction such as proteinuria and mesangial cell proliferation (25, 45). In contrast, macrophage abrogation attenuates renal dysfunction in rodent non-DN disease models using different approaches to deplete macrophages in the kidney (20, 21, 23).
The contribution of M1 and M2 macrophages in the setting of DN is not known. Macrophage heterogeneity has been recently recognized, with M1 (classically activated) macrophages mediating renal injury andd alternatively activated M2 macrophages mediating renal tissue repair (29). Our data show that DN is associated with an increase in the M1-to-M2 macrophage ratio at 6 wk of diabetes. These data indicate that depletion of macrophages and/or macrophage secretory products may be important in the early phase of DN.
To examine the direct role of macrophages in DN, we generated a diabetic mouse model in CD11b-DTR mice, in which human DTR expression is under the control of the CD11b promoter. This mouse model allowed us to chronically deplete macrophages conditionally through DT injection. This validated mouse model has been previously used to study acute kidney and liver injury (16, 20). We independently confirmed that, upon DT injection, kidney macrophages were successfully depleted chronically.
In our study, we show that DT injection during the initial 6 wk of diabetes is able to chronically deplete kidney macrophages. Macrophage depletion significantly reduced albuminuria and decreased histological changes compared with mutant DT-treated diabetic mice. Since CD11b has been reported to be expressed in other non bone marrow-derived cells, such as rectal epithelial cells (24), and to exclude any unwanted systemic effect of DT injection, we generated bone marrow chimeric mice in which CD11b-DTR mice were used as donors and C57BL/6J mice were used as recipients. Our results were consistent with the data generated from CD11b-DTR mice, indicating that it is bone marrow-derived macrophages, rather than nonhematopoietic cells expressing CD11b, that play a crucial role in DN. It is noteworthy that albuminuria was not attenuated in chimeric mice (Fig. 10) to the same degree as in regular CD11b-DTR mice (Fig. 4B). This finding can be explained by residual wild-type macrophages in chimeric mice that may still able to exacerbate albuminuria. In addition, it is possible that the radiation used to create the chimeras may have had a direct effect to impair renal function. This conclusion is supported by the observation that BUN levels in nondiabetic chimeric mice (Table 2) were higher than in nondiabetic CD11b-DTR mice (Table 1).
Being slit diaphragm molecules, nephrin and podocin are of great importance in the pathogenesis of proteinuria (48). In humans, nephrin and podocin expression are significantly decreased in diabetic individuals compared with nondiabetic individuals (27). Moreover, podocyte nephrin and podocin expression were inhibited by macrophage activation (26). In our study, kidney nephrin and podocin expression were significantly downregulated compared with normal mice. Interestingly, DT injection was able to restore nephrin and podocin expression, indicating that macrophage recruitment either directly or indirectly induces podocyte dysfunction in diabetes.
To answer this question directly, we first tested whether podocytes are able to promote macrophage migration. Our data clearly show that macrophage migration was significantly induced by podocytes cultured with high-glucose medium compared with normal glucose medium and that effect is mainly mediated through elevated secretion of MCP-1 by podocytes. These data are consistent with increased secretion of inflammatory cytokines and chemokines from activated podocytes (7).
To further study the direct role of macrophages on podocyte permeability, we cocultured podocytes and bone marrow-derived monocyte/macrophage subsets in a Transwell system. Our data show that M1 (classically activated) macrophages, but not M0 or M2 macrophages, induced podocyte injury, as evidenced by the increased permeability of BSA mainly through MCP-1. Taken together, our data indicate that MCP-1 may be a triggering mechanism for both macrophage infiltration and podocyte permeability (28). These findings are consistent with previous reports (45, 46) in which M1 macrophage infusion resulted in increased kidney damage. Classically activated M1 macrophages have been shown to cause injury in other organs (29, 33). In contrast, M2 macrophages have been shown to play a role in tissue repair (29, 33). In our in vivo experiments, macrophage ablation using DT did not discriminate between the different types of macrophage subsets, such as M1 versus M2. However, the improvement in kidney function and structure upon macrophage ablation suggests a role for M1 macrophages during the early phase of diabetes.
In conclusion, our data demonstrate that macrophages directly induce early stage diabetic kidney injury. The effect of macrophages is mediated, at least in part, via impairment of podocyte function, as evidenced by increased permeability and reduced expression of nephrin and podocin through classically activated (M1) macrophages but not alternatively activated (M2) macrophages. In addition, macrophage migration was promoted by podocytes grown in high-glucose medium. Taken together, our data provide the first direct evidence of macrophages as a critical player in DN. Attenuating the deleterious effects of macrophages and/or macrophage secretory products will provide a new therapeutic approach to the treatment of DN.
GRANTS
This work was supported by National Institute of Diabetes and Digestive and Kidney Diseases Grants DK-077444 and DK-094930 and the Pennsylvania Department of Health using Tobacco CURE Funds.
DISCLOSURES
No conflicts of interest, financial or otherwise, are declared by the author(s).
AUTHOR CONTRIBUTIONS
Author contributions: H.Y., T.G., T.K.C., and A.S.A. performed experiments; H.Y., T.K.C., and A.S.A. analyzed data; H.Y. and A.S.A. interpreted results of experiments; H.Y. and A.S.A. prepared figures; H.Y. and A.S.A. drafted manuscript; H.Y., T.G., T.K.C., W.B.R., and A.S.A. approved final version of manuscript; W.B.R. and A.S.A. conception and design of research; W.B.R. and A.S.A. edited and revised manuscript.
REFERENCES
- 1.Awad AS, Huang L, Ye H, Duong ET, Bolton WK, Linden J, Okusa MD. Adenosine A2A receptor activation attenuates inflammation and injury in diabetic nephropathy. Am J Physiol Renal Physiol 290: F828–F837, 2006 [DOI] [PubMed] [Google Scholar]
- 2.Awad AS, Kinsey GR, Khutsishvili K, Gao T, Bolton WK, Okusa MD. Monocyte/macrophage chemokine receptor CCR2 mediates diabetic renal injury. Am J Physiol Renal Physiol 301: F1358–F1366, 2011 [DOI] [PMC free article] [PubMed] [Google Scholar]
- 3.Awad AS, Rouse M, Liu L, Vergis AL, Rosin DL, Linden J, Sedor JR, Okusa MD. Activation of adenosine 2A receptors preserves structure and function of podocytes. J Am Soc Nephrol 19: 59–68, 2008 [DOI] [PMC free article] [PubMed] [Google Scholar]
- 4.Bohle A, Wehrmann M, Bogenschutz O, Batz C, Muller CA, Muller GA. The pathogenesis of chronic renal failure in diabetic nephropathy. Investigation of 488 cases of diabetic glomerulosclerosis. Pathol Res Pract 187: 251–259, 1991 [DOI] [PubMed] [Google Scholar]
- 5.Boswell JM, Yui MA, Burt DW, Kelley VE. Increased tumor necrosis factor and IL-1 β gene expression in the kidneys of mice with lupus nephritis. J Immunol 141: 3050–3054, 1988 [PubMed] [Google Scholar]
- 6.Boyle JP, Thompson TJ, Gregg EW, Barker LE, Williamson DF. Projection of the year 2050 burden of diabetes in the US adult population: dynamic modeling of incidence, mortality, and prediabetes prevalence. Popul Health Metr 8: 29, 2010 [DOI] [PMC free article] [PubMed] [Google Scholar]
- 7.Brahler S, Ising C, Hagmann H, Rasmus M, Hoehne M, Kurschat C, Kisner T, Goebel H, Shankland S, Addicks K, Thaiss F, Schermer B, Pasparakis M, Benzing T, Brinkkoetter PT. Intrinsic proinflammatory signaling in podocytes contributes to podocyte damage and prolonged proteinuria. Am J Physiol Renal Physiol 303: F1473–F1485, 2012 [DOI] [PubMed] [Google Scholar]
- 8.Breyer MD, Bottinger E, Brosius FC, 3rd, Coffman TM, Harris RC, Heilig CW, Sharma K. Mouse models of diabetic nephropathy. J Am Soc Nephrol 16: 27–45, 2005 [DOI] [PubMed] [Google Scholar]
- 9.Brosius FC, 3rd, Alpers CE, Bottinger EP, Breyer MD, Coffman TM, Gurley SB, Harris RC, Kakoki M, Kretzler M, Leiter EH, Levi M, McIndoe RA, Sharma K, Smithies O, Susztak K, Takahashi N, Takahashi T. Mouse models of diabetic nephropathy. J Am Soc Nephrol 20: 2503–2512, 2009 [DOI] [PMC free article] [PubMed] [Google Scholar]
- 10.Chow F, Ozols E, Nikolic-Paterson DJ, Atkins RC, Tesch GH. Macrophages in mouse type 2 diabetic nephropathy: correlation with diabetic state and progressive renal injury. Kidney Int 65: 116–128, 2004 [DOI] [PubMed] [Google Scholar]
- 11.Chow FY, Nikolic-Paterson DJ, Ozols E, Atkins RC, Rollin BJ, Tesch GH. Monocyte chemoattractant protein-1 promotes the development of diabetic renal injury in streptozotocin-treated mice. Kidney Int 69: 73–80, 2006 [DOI] [PubMed] [Google Scholar]
- 12.Chow FY, Nikolic-Paterson DJ, Ozols E, Atkins RC, Tesch GH. Intercellular adhesion molecule-1 deficiency is protective against nephropathy in type 2 diabetic db/db mice. J Am Soc Nephrol 16: 1711–1722, 2005 [DOI] [PubMed] [Google Scholar]
- 13.Chowdhury P, Sacks SH, Sheerin NS. Toll-like receptors TLR2 and TLR4 initiate the innate immune response of the renal tubular epithelium to bacterial products. Clin Exp Immunol 145: 346–356, 2006 [DOI] [PMC free article] [PubMed] [Google Scholar]
- 14.Cummings BS, McHowat J, Schnellmann RG. Role of an endoplasmic reticulum Ca2+-independent phospholipase A2 in cisplatin-induced renal cell apoptosis. J Pharmacol Exp Ther 308: 921–928, 2004 [DOI] [PubMed] [Google Scholar]
- 15.Doublier S, Salvidio G, Lupia E, Ruotsalainen V, Verzola D, Deferrari G, Camussi G. Nephrin expression is reduced in human diabetic nephropathy: evidence for a distinct role for glycated albumin and angiotensin II. Diabetes 52: 1023–1030, 2003 [DOI] [PubMed] [Google Scholar]
- 16.Duffield JS, Forbes SJ, Constandinou CM, Clay S, Partolina M, Vuthoori S, Wu S, Lang R, Iredale JP. Selective depletion of macrophages reveals distinct, opposing roles during liver injury and repair. J Clin Invest 115: 56–65, 2005 [DOI] [PMC free article] [PubMed] [Google Scholar]
- 17.Furuta T, Saito T, Ootaka T, Soma J, Obara K, Abe K, Yoshinaga K. The role of macrophages in diabetic glomerulosclerosis. Am J Kidney Dis 21: 480–485, 1993 [DOI] [PubMed] [Google Scholar]
- 18.Giunti S, Barutta F, Perin PC, Gruden G. Targeting the MCP-1/CCR2 System in diabetic kidney disease. Curr Vasc Pharmacol 8: 849–860, 2010 [DOI] [PubMed] [Google Scholar]
- 19.Gordon S. Alternative activation of macrophages. Nat Rev Immunol 3: 23–35, 2003 [DOI] [PubMed] [Google Scholar]
- 20.Guo S, Wietecha TA, Hudkins KL, Kida Y, Spencer MW, Pichaiwong W, Kojima I, Duffield JS, Alpers CE. Macrophages are essential contributors to kidney injury in murine cryoglobulinemic membranoproliferative glomerulonephritis. Kidney Int 80: 946–958, 2011 [DOI] [PubMed] [Google Scholar]
- 21.Hara M, Batsford SR, Mihatsch MJ, Bitter-Suermann D, Vogt A. Complement and monocytes are essential for provoking glomerular injury in passive Heymann nephritis in rats. Terminal complement components are not the sole mediators of proteinuria. Lab Invest 65: 168–179, 1991 [PubMed] [Google Scholar]
- 22.Hirata K, Shikata K, Matsuda M, Akiyama K, Sugimoto H, Kushiro M, Makino H. Increased expression of selectins in kidneys of patients with diabetic nephropathy. Diabetologia 41: 185–192, 1998 [DOI] [PubMed] [Google Scholar]
- 23.Holdsworth SR, Neale TJ, Wilson CB. Abrogation of macrophage-dependent injury in experimental glomerulonephritis in the rabbit. Use of an antimacrophage serum. J Clin Invest 68: 686–698, 1981 [DOI] [PMC free article] [PubMed] [Google Scholar]
- 24.Hussain LA, Kelly CG, Rodin A, Jourdan M, Lehner T. Investigation of the complement receptor 3 (CD11b/CD18) in human rectal epithelium. Clin Exp Immunol 102: 384–388, 1995 [DOI] [PMC free article] [PubMed] [Google Scholar]
- 25.Ikezumi Y, Hurst LA, Masaki T, Atkins RC, Nikolic-Paterson DJ. Adoptive transfer studies demonstrate that macrophages can induce proteinuria and mesangial cell proliferation. Kidney Int 63: 83–95, 2003 [DOI] [PubMed] [Google Scholar]
- 26.Ikezumi Y, Suzuki T, Karasawa T, Kawachi H, Nikolic-Paterson DJ, Uchiyama M. Activated macrophages down-regulate podocyte nephrin and podocin expression via stress-activated protein kinases. Biochem Biophys Res Commun 376: 706–711, 2008 [DOI] [PubMed] [Google Scholar]
- 27.Jim B, Ghanta M, Qipo A, Fan Y, Chuang PY, Cohen HW, Abadi M, Thomas DB, He JC. Dysregulated nephrin in diabetic nephropathy of type 2 diabetes: a cross sectional study. PLos One 7: e36041, 2012 [DOI] [PMC free article] [PubMed] [Google Scholar]
- 28.Lee EY, Chung CH, Khoury CC, Yeo TK, Pyagay PE, Wang A, Chen S. The monocyte chemoattractant protein-1/CCR2 loop, inducible by TGF-β, increases podocyte motility and albumin permeability. Am J Physiol Renal Physiol 297: F85–F94, 2009 [DOI] [PMC free article] [PubMed] [Google Scholar]
- 29.Lee S, Huen S, Nishio H, Nishio S, Lee HK, Choi BS, Ruhrberg C, Cantley LG. Distinct macrophage phenotypes contribute to kidney injury and repair. J Am Soc Nephrol 22: 317–326, 2011 [DOI] [PMC free article] [PubMed] [Google Scholar]
- 30.Matsumoto K. Production of interleukin-1 by glomerular macrophages in nephrotoxic serum nephritis. Am J Nephrol 10: 502–506, 1990 [DOI] [PubMed] [Google Scholar]
- 31.Matsumoto K, Dowling J, Atkins RC. Production of interleukin 1 in glomerular cell cultures from patients with rapidly progressive crescentic glomerulonephritis. Am J Nephrol 8: 463–470, 1988 [DOI] [PubMed] [Google Scholar]
- 32.Morris SM, Jr, Gao T, Cooper TK, Kepka-Lenhart D, Awad AS. Arginase-2 mediates diabetic renal injury. Diabetes 60: 3015–3022, 2011 [DOI] [PMC free article] [PubMed] [Google Scholar]
- 33.Mosser DM, Edwards JP. Exploring the full spectrum of macrophage activation. Nat Rev Immunol 8: 958–969, 2008 [DOI] [PMC free article] [PubMed] [Google Scholar]
- 34.Nakhoul F, Ramadan R, Khankin E, Yaccob A, Kositch Z, Lewin M, Assady S, Abassi Z. Glomerular abundance of nephrin and podocin in experimental nephrotic syndrome: different effects of antiproteinuric therapies. Am J Physiol Renal Physiol 289: F880–F890, 2005 [DOI] [PubMed] [Google Scholar]
- 35.Nguyen D, Ping F, Mu W, Hill P, Atkins RC, Chadban SJ. Macrophage accumulation in human progressive diabetic nephropathy. Nephrology (Carlton) 11: 226–231, 2006 [DOI] [PubMed] [Google Scholar]
- 36.Nguyen TQ, Tarnow L, Andersen S, Hovind P, Parving HH, Goldschmeding R, van Nieuwenhoven FA. Urinary connective tissue growth factor excretion correlates with clinical markers of renal disease in a large population of type 1 diabetic patients with diabetic nephropathy. Diabetes Care 29: 83–88, 2006 [DOI] [PubMed] [Google Scholar]
- 37.Ninichuk V, Clauss S, Kulkarni O, Schmid H, Segerer S, Radomska E, Eulberg D, Buchner K, Selve N, Klussmann S, Anders HJ. Late onset of Ccl2 blockade with the Spiegelmer mNOX-E36–3′PEG prevents glomerulosclerosis and improves glomerular filtration rate in db/db mice. Am J Pathol 172: 628–637, 2008 [DOI] [PMC free article] [PubMed] [Google Scholar]
- 38.Noronha IL, Kruger C, Andrassy K, Ritz E, Waldherr R. In situ production of TNF-α, IL-1β and IL-2R in ANCA-positive glomerulonephritis. Kidney Int 43: 682–692, 1993 [DOI] [PubMed] [Google Scholar]
- 39.Tan TK, Zheng G, Hsu TT, Wang Y, Lee VW, Tian X, Cao Q, Harris DC. Macrophage matrix metalloproteinase-9 mediates epithelial-mesenchymal transition in vitro in murine renal tubular cells. Am J Pathol 176: 1256–1270, 2010 [DOI] [PMC free article] [PubMed] [Google Scholar]
- 40.Tang WW, Qi M, Warren JS. Monocyte chemoattractant protein 1 mediates glomerular macrophage infiltration in anti-GBM Ab GN. Kidney Int 50: 665–671, 1996 [DOI] [PubMed] [Google Scholar]
- 41.Tesch GH. Role of macrophages in complications of type 2 diabetes. Clin Exp Pharmacol Physiol 34: 1016–1019, 2007 [DOI] [PubMed] [Google Scholar]
- 42.Tipping PG, Leong TW, Holdsworth SR. Tumor necrosis factor production by glomerular macrophages in anti-glomerular basement membrane glomerulonephritis in rabbits. Lab Invest 65: 272–279, 1991 [PubMed] [Google Scholar]
- 43.Tipping PG, Lowe MG, Holdsworth SR. Glomerular interleukin 1 production is dependent on macrophage infiltration in anti-GBM glomerulonephritis. Kidney Int 39: 103–110, 1991 [DOI] [PubMed] [Google Scholar]
- 44.Wada T, Furuichi K, Sakai N, Iwata Y, Yoshimoto K, Shimizu M, Takeda SI, Takasawa K, Yoshimura M, Kida H, Kobayashi KI, Mukaida N, Naito T, Matsushima K, Yokoyama H. Up-regulation of monocyte chemoattractant protein-1 in tubulointerstitial lesions of human diabetic nephropathy. Kidney Int 58: 1492–1499, 2000 [DOI] [PubMed] [Google Scholar]
- 45.Wang Y, Cao Q, Zheng G, Lee VW, Zheng D, Li X, Tan TK, Harris DC. By homing to the kidney, activated macrophages potently exacerbate renal injury. Am J Pathol 172: 1491–1499, 2008 [DOI] [PMC free article] [PubMed] [Google Scholar]
- 46.Wang Y, Wang YP, Zheng G, Lee VW, Ouyang L, Chang DH, Mahajan D, Coombs J, Wang YM, Alexander SI, Harris DC. Ex vivo programmed macrophages ameliorate experimental chronic inflammatory renal disease. Kidney Int 72: 290–299, 2007 [DOI] [PubMed] [Google Scholar]
- 47.Yonemoto S, Machiguchi T, Nomura K, Minakata T, Nanno M, Yoshida H. Correlations of tissue macrophages and cytoskeletal protein expression with renal fibrosis in patients with diabetes mellitus. Clin Exp Nephrol 10: 186–192, 2006 [DOI] [PubMed] [Google Scholar]
- 48.Zhang A, Huang S. Progress in pathogenesis of proteinuria. Int J Nephrol 2012: 314251, 2012 [DOI] [PMC free article] [PubMed] [Google Scholar]
- 49.Zhang B, Ramesh G, Norbury CC, Reeves WB. Cisplatin-induced nephrotoxicity is mediated by tumor necrosis factor-α produced by renal parenchymal cells. Kidney Int 72: 37–44, 2007 [DOI] [PubMed] [Google Scholar]


