

Abstract
The permeability of lipid membranes for metabolic molecules or drugs is routinely estimated from the solute’s oil/water partition coefficient. However, the molecular determinants that modulate the permeability in different lipid compositions have remained unclear. Here, we combine scanning electrochemical microscopy and molecular-dynamics simulations to study the effect of cholesterol on membrane permeability, because cholesterol is abundant in all animal membranes. The permeability of membranes from natural lipid mixtures to both hydrophilic and hydrophobic solutes monotonously decreases with cholesterol concentration [Chol]. The same is true for hydrophilic solutes and planar bilayers composed of dioleoyl-phosphatidylcholine or dioleoyl-phosphatidyl-ethanolamine. However, these synthetic lipids give rise to a bell-shaped dependence of membrane permeability on [Chol] for very hydrophobic solutes. The simulations indicate that cholesterol does not affect the diffusion constant inside the membrane. Instead, local partition coefficients at the lipid headgroups and at the lipid tails are modulated oppositely by cholesterol, explaining the experimental findings. Structurally, these modulations are induced by looser packing at the lipid headgroups and tighter packing at the tails upon the addition of cholesterol.
Introduction
Nonfacilitated membrane diffusion of water (1,2), gases (3,4), small metabolites (5,6), and pharmaceutics (7–10) is of tremendous importance for the understanding of human physiology and for therapeutic applications. It results in spontaneous membrane permeation, which is most often described in terms of the solubility diffusion model (Fig. 1 A) (11). This model predicts solute membrane permeability Pm from 1), the solute partition coefficient K between an aqueous solution and an organic solvent, and 2), its transverse membrane diffusion coefficient, D,
| (1) |
where d denotes membrane thickness. In this model, the membrane is reduced to a single layer of hydrocarbon. Despite disregard for all structural details, Eq. 1 proved to be most valuable for a great variety of applications.
Figure 1.
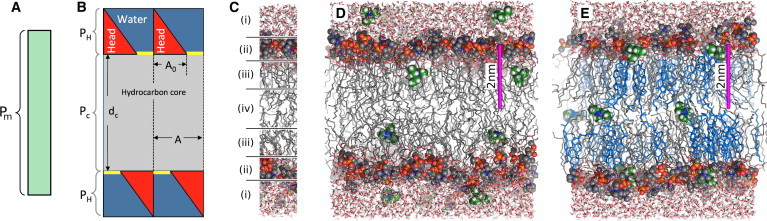
Solubility diffusion models for membrane permeability. (A) The one-slab model, where the membrane is treated as one homogeneous slab with the total membrane permeability Pm. (B) The model of Nagle et al. (18), where the one-slab model is only used for the lipid tails with thickness dc and permeability PH. The permeability of the headgroup region, PH, includes the accessible area (A−A0) (yellow stripes), where A0 is the area at which the headgroups are packed so tightly that the permeability becomes negligible. (C) Divides the membrane in (i) low headgroup density, (ii) high headgroup density, (iii) high tail density, and (iv) low tail density, as taken from Marrink and Berendsen (19). (D and E) Typical simulation snapshots of a membrane of (D) pure DOPC and (E) DOPC plus 40% cholesterol. (Gray sticks) Lipid tails; (colored spheres) lipid headgroups; (blue sticks) cholesterol; and (red/white sticks) water. (Green/white spheres) Some TEA molecules present in the umbrella sampling simulations. (Magenta rod) 2-nm scale. To see this figure in color, go online.
Its limitations have long been recognized. The model does not account for the Pm dependencies on 1), permeant size (12,13) or 2), lipid composition (14,15). Molecular-dynamics simulations provide a possible solution by enabling K(z) and D(z) to vary continuously along the membrane normal z (16,17). The result has been summarized in a four-region model (Fig. 1 C, See also Marrink and Berendsen (19)). With varying K(z) and D(z), Eq. 1 must be generalized to an integral over the membrane, yielding
| (2) |
Different partition coefficient regions were designated as follows:
Region 1, which is the region of low headgroup density at the entry into the membrane;
Region 2, which is the region of high headgroup density;
Region 3, which is the region of high density of tail carbonyl groups; and
Region 4, which is the region of low-density of acyl chains.
Regions 1–3 repeat themselves in reverse order toward the membrane exit, giving rise to seven slabs that a molecule has to pass one after the other. The main resistance to the permeation of hydrophobic molecules was in Region 1, while the main resistance to the permeation of hydrophilic substances was at the edge between Region 2 or 3 (16).
Due to the large number of independent parameters, the seven-slab model is impossible to handle analytically. Instead, a three-slab model was proposed (18), which improved the accuracy of the analytical description. In that model, the two outer slabs consist of the two headgroup regions of the bilayer and the hydrophobic interior represents the third slab (Fig. 1 B). The permeability of the interior PC is defined in analogy to Pm as
| (3) |
where dc and DC are the width of the hydrocarbon region and the diffusion coefficient within it, respectively. The permeability of the two outer slabs PH is adjusted by an area factor for the lipid headgroups, which is thought to reflect the dependence of PH on lipid packing,
| (4) |
where A and A0 are the present and the minimal (i.e., gel phase) lipid headgroup areas. The model reflects the dependence of lipid bilayer water permeability on the ratio of the cross-sectional areas of lipid headgroups to lipid tails reasonably well. However, it fails to do so in the presence of cholesterol (20). Moreover, the accessible area (A−A0) of the hydrophobic membrane only reflects geometrical constraints, but neglects effects from polar interactions or hydrophobic effects between permeant and headgroup.
Here we have used a computational approach to obtain a microscopic picture of how cholesterol alters membrane permeability. In parallel, we performed permeability measurements at planar membranes. Our results suggest that the permeation of apolar solutes is not only limited by the partitioning into the hydrophobic core, but that it can also be reduced by partitioning into the lipid headgroup region. In addition, using different lipid species and various cholesterol concentrations (Fig. 1, D and E), we demonstrate that for some synthetic lipids the addition of cholesterol increases the partitioning at the lipid headgroups and, simultaneously, decreases the partitioning at the lipid tails, leading to a biphasic (bell-shaped) cholesterol-permeability dependence in certain membranes.
Materials and Methods
Planar membrane measurements
The planar membranes were folded from monolayers (21) of DOPE (1,2-dioleoyl-sn-glycero-3-phosphoethanolamine), DOPC (1,2-dioleoyl-sn-glycero-3-phosphocholine), brain lipid extract, or polar lipid extract (PLE) from Escherichia coli with varying amounts of cholesterol (all Avanti Lipids, Alabaster, AL) across the aperture (100–150 μm in diameter) of a 25-μm-thick polytetrafluoroethylene septum separating the two aqueous phases of the chamber. The septum had been pretreated with a hexadecane-hexane mixture (ratio by volume, 1:200).
The pH electrodes were made of pulled borosilicate capillaries (tip-diameter of 2 μm). After silanization with Bis(dimethylamino)dimethylsilane (Fluka Analytical, Sigma-Aldrich, St. Louis, MO), they were filled with a proton-sensitive cocktail (Hydrogen Ionophore II cocktail A, Selectophore; Fluka Analytical, Sigma-Aldrich). A hydraulic stepdrive (Narishige Scientific, Tokyo, Japan) moved the electrode at a velocity of 2 μm/s perpendicular to the surface of the membrane.
Simulation setup and parameters
Simulation systems of POPE (palmitoyl oleoyl phosphatidylethanolamine, with or without cholesterol) and systems of pure DOPC were taken from a previous study (22) and from Ulmschneider and Ulmschneider (23), respectively. Cholesterol-containing membranes of DOPC were built by placing lipid molecules at evenly distributed positions on a square grid for each monolayer, yielding lipid bilayers containing between 128 and 160 lipid or cholesterol molecules in total. The bilayers were then solvated with at least 4727 TIP4P (24) water molecules. The systems were energy-minimized using a conjugate gradient algorithm. Thereafter, the cholesterol-free and cholesterol-containing systems were equilibrated for 40 and 200 ns, respectively. (The equilibrated systems are available on the author’s website at http://cmb.bio.uni-goettingen.de/.)
All simulations were carried out using the GROMACS simulation software (25,26). Parameters for POPE were taken from Berger et al. (27), and DOPC parameters from Ulmschneider and Ulmschneider (23). Cholesterol parameters were taken from Höltje et al. (28). The OPLS all-atom force field (29,30) was applied for ammonia and pyridine, and triethylamine parameters were taken from Shivakumar et al. (31). Lennard-Jones (LJ) parameters for nitric oxide were taken from Cohen et al. (32), and the partial charges were computed by density functional theory using the B3LYP functional (33–35) with the aug-cc-pVTZ basis set (36,37) in the GAUSSIAN 2003 suite (38). The charges were fitted to reproduce the electrostatic potential produced by the quantum chemistry calculation (39,40), yielding ± 0.0215e for the oxygen and the nitrogen atoms, respectively, where e denotes the proton charge. During equilibration, the temperature was controlled at 300 K through velocity rescaling (41) (τ = 2 ps), and the pressure was kept at 1 bar using the weak coupling scheme (42) (τ = 1 ps). The SETTLE (43) algorithm was applied to constrain bond lengths and angles of water molecules, and LINCS (44) was used to constrain all other bond lengths, allowing a time step of 2 fs. Electrostatic interactions were calculated at every step using the particle-mesh Ewald method (45,46), and dispersive interactions were described by an LJ potential with a cutoff at 1 nm.
Umbrella sampling simulations
Starting structures for the umbrella simulations were taken from randomly chosen snapshots of the last 5 ns and the last 20 ns of the cholesterol-free and cholesterol-containing equilibrium simulations, respectively. The membrane normal z was chosen as a reaction coordinate for solute permeation, where z = 0 nm is defined by the center of mass (COM) of the lipid and cholesterol molecules. Here, the COM was computed using only membrane atoms within a cylinder of radius 12 Å, centered at the respective solute and aligned along the z axis. Here, a weight of 1 was assigned to all atoms within a distance of 10 Å to the cylinder axis, and the weights were switched to 0 between 10 and 12 Å. This procedure avoids artifacts in the PMFs due to undulation of the membrane. The reaction coordinate was divided into 328–388 equidistant sections, with each section representing the center of an umbrella window. Adjacent umbrella windows were separated by 0.25 Å, and the umbrella windows spanned the complete space from bulk water at one side of the membrane to bulk water at the other side of the membrane.
Solutes were inserted at the umbrella centers. To save computational resources, sampling of 4–5 different umbrella windows were sampled within each simulation, keeping a distance of 15 Å along z for ammonia and nitric oxide, and a distance of 20 Å for pyridine and triethylamine. To further reduce the statistical error, four solutes were sampled within each umbrella window simultaneously, whereby the four solutes were separated by approximately half the width of the simulation box in the x-y plane. Hence, 16–20 umbrella histograms could be collected from each umbrella simulation. We validated that the addition of four (instead of one) solutes per window does not significantly affect the PMFs (see Fig. S2 in the Supporting Material). Water molecules that overlapped with the solute were removed. Overlaps between the solute and lipid atoms were removed by gradually switching on LJ interactions between the solute and the rest of the system within 1000 simulation steps, using soft-core LJ potentials and a stochastic dynamics integration scheme. Subsequently, the energy of each structure was minimized. Typical umbrella sampling simulation systems are shown in Fig. 1, D and E. They contain pure DOPC or DOPC plus cholesterol.
An harmonic umbrella potential acting on the COM of the solute was applied (force constant 1000 kJ mol−1 nm−2). Each umbrella simulation was carried out for 1 ns. The temperature was set to 300 K through a stochastic dynamics integrator (τ = 0.1 ps). The pressure was controlled at 1 bar by the semiisotropic Parrinello-Rahman barostat (47), scaling the box in the x-y plane only, but keeping the box dimension fixed in z direction. Those pressure-coupling settings were chosen to exclude that a box scaling in z direction would affect the umbrella histograms. However, simulating without pressure-coupling in z might, in principle, reduce the ability of the membrane to relax upon the addition of solutes. Therefore, we also computed PMFs with pressure-coupling in z turned on, and we found only very small effects on the PMFs (see Fig. S2).
Construction of PMFs
After removing the first 200 ps for equilibration, the PMFs were computed using a periodic version of the weighted histogram analysis method (WHAM) (48), as implemented in the G_WHAM software (49). Depending on the system, the PMFs were based on 1312–1552 histograms. Here, the integrated autocorrelation times of the umbrella windows were incorporated in the WHAM iteration procedure as described by Kumar et al. (48). Integrated autocorrelation times were estimated as described previously (49), and smoothed along z using a Gaussian filter with σ = 0.2 nm. The final PMFs were symmetrized around the membrane center (z = 0) to account for the symmetric membranes. To exclude problems concerning, for instance, convergence, nonsymmetrized and noncyclic PMFs were computed and visually inspected.
Statistical uncertainties of the PMFs were calculated using the Bayesian bootstrap of complete histograms (49). This procedure yields reliable uncertainties because it does not depend on accurate autocorrelation time estimates. Instead, the procedure considers only complete histograms as independent data points. Statistical errors were between 1 and 3 kJ/mol (see Fig. S3).
Diffusion calculations
The transversal diffusion constants D (z) were computed from constrained simulations. To set up these simulations, 32–40 z positions separated by 2 Å were selected, spanning the space including the membrane and both bulk water regimes. To reduce the statistical error, in a similar manner as applied in the PMF calculations, four solutes were placed at the respective z position, separated by approximately half of the box width in the x-y plane. Water molecules that overlapped with the solute were removed. Overlaps between solute and lipid were removed by gradually switching on LJ interactions in 1000 simulation steps (as done to prepare the umbrella sampling simulations), and the energy of each structure was minimized. The z coordinate of the COM of each solute was constrained with respect to the COM of all lipid and cholesterol molecules.
To avoid interactions between the four solutes during the simulations, a cylindrical flat-bottomed potential was applied on the COM of each solute. That potential was implemented as Vc = kc(r−rc)2/2 H (r−rc), where r is the distance of the solute from the cylinder axis (parallel to the z axis), kc = 1000 kJ/mol/nm2 is the force constant, rc = 0.8 nm is the radius of the cylinder, and H is the Heaviside step function. Each system was simulated for 10 ns, and the constraint force was recorded every 40 fs. To exclude artifacts from the temperature-coupling on the autocorrelation time of the constraint force, the system was coupled weakly (τ = 5 ps) to a thermostat at 300 K using velocity rescaling (41). Using that procedure, ammonia molecules were found to couple insufficiently to the rest of the system if the molecules were located near the center of the membrane, leading to simulation instabilities. In such simulations, the ammonia molecules were coupled independently to a thermostat with a coupling constant of τ = 1 ps. The pressure was controlled through a Parrinello-Rahman barostat (τ = 1 ps) coupled only to the box vectors in the x-y plane. D(z) was computed from the integral over the autocorrelation function (ACF) of the constraint force (16). To assess the robustness of the calculation, the integral was evaluated either by a simple sum over the ACF or by fitting of a double-exponential function to the ACF, followed by an analytical integration of the fitted function. The results were very similar.
We validated the procedure against a simple mean-square displacement computation of a solute in bulk water, and we found very good agreement. D(z), shown later in Fig. 4, A and D, was computed using the former method. Here, the first nanosecond of each simulation was ignored for equilibration, and D(z) was averaged over the four solutes. One-dimensional diffusion constants for TEA (triethylamine) and ammonia in bulk water (see Fig. 4, A and D, broken lines) were computed using the same protocol, but with only one solute constrained at the center of a pure water box, yielding 1.27 and 3.77 × 10⁻⁵ cm2/s, respectively.
Figure 4.
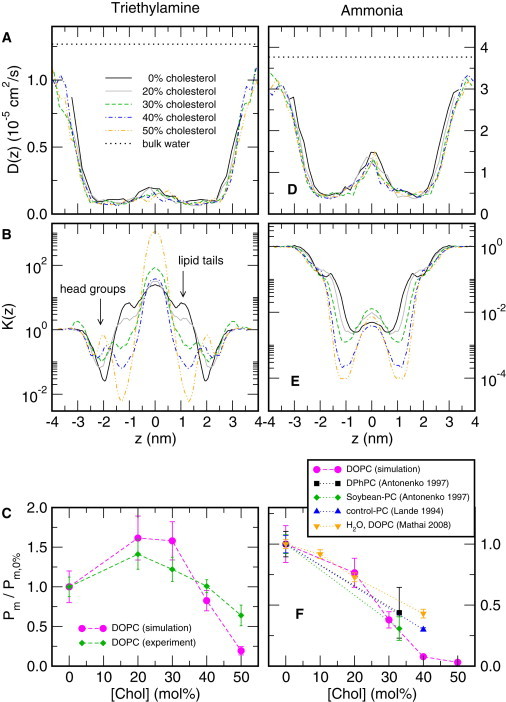
Permeation of TEA (A–C) and ammonia (D–F) across membranes composed of DOPC plus an increasing cholesterol content [Chol] between 0 and 50 mol % as indicted by the color-code given. (A) Position-dependent transversal diffusion constant D(z) of TEA and (D) ammonia. z = 0 corresponds to the membrane center. (Dotted lines) One-dimensional diffusion constant of TEA and ammonia in bulk water. Remarkably, D(z) is hardly affected by cholesterol. (B and E) Position-dependent partition coefficient K(z) for the same membranes as in panels A and D. TEA: With increasing [Chol], K(z) is increased in the headgroup region (|z| ∼ 2 nm) and reduced in the lipid tail region (|z| ∼ 1 nm). Ammonia: K(z) is merely decreased in the lipid tail region by increasing [Chol]. Permeability to (C) TEA and (F) ammonia versus [Chol] relative to the permeability at [Chol] = 0% (magenta curves). The experimental TEA permeabilities are taken from Fig. 2C, and the experimental permeabilities to NH3 and H2O were taken from the literature (20,51,53). Statistical errors for panels A and B and D and E are shown in Fig. S3 in the Supporting Material. To see this figure in color, go online.
Potential energies between lipid tails Vtails
The potential energy between the lipid tail atoms Vtails was derived from the average sum of LJ and short-range Coulomb potentials between all pairs of atoms in the lipid tail region. For cholesterol, all atoms except for the hydroxyl group were included, and for phospholipids, all tail atoms up to the three glycerol carbon atoms. The potential energy was averaged over the last 10 and 100 ns of the equilibrium simulations for cholesterol-free and cholesterol-containing simulations, respectively. Statistical errors for Vtails were computed using a binning analysis (50).
Results
Permeabilities at planar membranes
We formed free-standing, nearly solvent-free planar membranes (21) from a mixture of DOPE and cholesterol and added 0.5–1.5 mM TEA into one of the aqueous compartments (called the cis compartment below). TEA is a weak base (pKa = 10.8) that is protonated (TEAH+) in the aqueous solution at physiological pH values. Because 1), proton release is mandatory for membrane permeation (8) and 2), the TEAH+ flux through the unstirred layers (USLs) must be equal to the buffer flux in the steady state (5), the pH change ΔpH in the immediate membrane vicinity allows calculation of the steady-state transmembrane flux Jm of TEA,
| (5) |
where DB, β, and δB indicate the diffusion coefficient of the buffer molecules, buffer capacity, and the USL thickness, respectively. We used protonophore-containing pH-sensitive scanning microelectrodes to detect ΔpH in the USL (compare, e.g., Missner et al. (4), Saparov et al. (8), and Antonenko et al. (51)). Increasing aqueous TEAH+ gradients augmented ΔpH (Fig. 2, A and B), enabling calculation of Pm (Fig. 2 B, inset) from the combined Eqs. 1 and 5,
| (6) |
where [TEA]s indicates the interfacial TEA concentration, which was derived from the pH profile.
Figure 2.
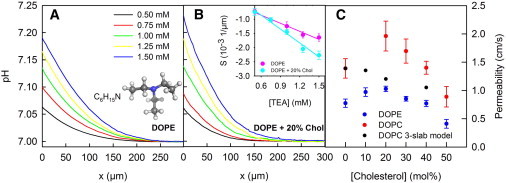
Permeability Pm of membranes from synthetic lipids to TEA. TEA was added to the aqueous solutions (100 mM NaCl, 5 mM HEPES, pH 7) at the cis side of the membrane. (A) Its diffusion across the membrane was accompanied by proton release in the cis unstirred layer (USL) and proton uptake in the trans USL. We used a pH-sensitive microelectrode to record the resulting pH as a function of the distance x to the membrane in the trans USL. (B) The pH gradient in the immediate membrane vicinity (for x = 0) was a linear function of the TEA concentration gradient for both cholesterol-free and cholesterol-containing membranes. (C) It was used to calculate Pm for DOPE (blue circles) and DOPC (red circles) membranes (compare the respective pH profiles in the Supporting Material). By taking Pm without cholesterol and taking the parameters A and dC from Mathai et al. (20), we calculated Pm for 10, 20, and 40% cholesterol (black dots) according to the model of Nagle et al. (18) (compare Eqs. 2 and 3).
The addition of cholesterol to DOPE in equimolar amounts resulted in a decrease of Pm from 0.77 ± 0.07 cm/s to 0.41 ± 0.08 cm/s (Fig. 2 C), as expected from the decreased ΔpH. The striking observation was that smaller amounts of cholesterol had the opposite effect on Pm. Thus, at 20 mol % cholesterol, we observed the maximal Pm value of 1.03 ± 0.05 cm/s (Fig. 2 B). The biphasic dependence of Pm on the cholesterol content is at odds with the predictions from the three-slab model (Fig. 2 C). In addition, that finding is in contrast to the permeability for polar solutes that monotonously decrease with cholesterol concentration (20,52,53).
We speculated that the polar DOPE headgroups might form the rate-limiting barrier for the permeation of the apolar TEA. Cholesterol may have increased the distances between the headgroups upon incorporation into DOPE bilayers, thereby facilitating TEA access to the hydrophobic interior. If so, the magnitude of the effect may be smaller in DOPC bilayers. The PC (phosphatidylcholine) headgroup forms weaker bonds to nearby water or phosphate groups than the PE (phosphatidylethanolamine) headgroups because the cationic group is shielded by three methyl groups. In line with the smaller polarity of PC headgroups, we found that the Pm of 1.39 ± 0.17 cm/s at zero cholesterol increased to 1.96 ± 0.26 cm/s at 20% cholesterol (see Fig. S1). A further increase in cholesterol content decreased Pm to 0.88 ± 0.18 cm/s (Fig. 2 C).
Both DOPC and DOPE are nonnatural lipids which, due to their two unsaturated chains, occupy a larger area as compared to other lipids such as POPC (palmitoyl oleoyl phosphatidylcholine) (54) or POPE. Natural membranes, in contrast, contain mixtures of both saturated and unsaturated tails of varying tail lengths, and they contain a mixture of different headgroups. To test the effect of lipid mixtures on TEA permeability, we looked for a mixture that consists primarily of lipids with PE (phosphatidylethanolamine) or PC (phosphatidylcholine) headgroups. With ∼70% PE lipids, the PLE from E. coli lipids satisfied this criterion. The other lipids in this mixture are cardiolipin and phosphatidylglycerol. They give rise to a negative surface potential (55). In the absence of cholesterol, Pm was equal to 1.1 cm/s (Fig. 3). Upon the addition of cholesterol, membrane permeability decreased gradually (Fig. 3, inset). Thus, the bell-shaped dependence of Pm on the cholesterol content was gone. We found similar results for brain extract lipids. The addition of 20% cholesterol decreased Pm from (0.82 ± 0.07) cm/s to (0.33 ± 0.06) cm/s. These results suggest that the headgroups do not form a rate-limiting barrier for TEA in PLE or in brain extract lipids.
Figure 3.
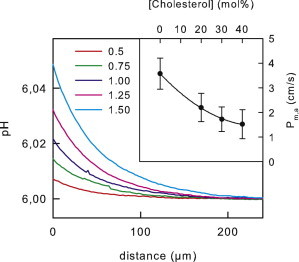
Apparent permeability Pm,a of membranes from a natural lipid mixture to TEA. TEA was added to the aqueous solutions (100 mM NaCl, 5 mM Mes, pH 6) at the indicated concentrations (in mM) to the cis side of the membrane. Its diffusion across the membrane was accompanied by proton release in the cis unstirred layer (USL) and proton uptake in the trans USL. We used a pH-sensitive microelectrode to record the resulting pH as a function of the distance x to the membrane in the trans USL. The pH profiles served to calculate an apparent Pm,a of 3.6 ± 0.6 cm/s. True Pm was smaller because negatively charged lipids act to augment TEAH+ surface concentration, [TEAH+]s above bulk concentration, [TEAH+]b. Electrophoretic mobility measurements of lipid vesicles from E. coli lipid (55) indicate a surface potential ψ-value of ∼−30 mV according to [TEAH+]s = [TEAH+]b exp(Fψs/RT) ≈ 3.2[TEAH+]b. Accounting for the increase in transmembrane TEA concentration gradient allows the calculation of the true Pm ≈ 1.1 cm/s. Addition of cholesterol is likely to decrease ψ-values by 10–20%. Because the actual ψ-values for the different cholesterol concentrations is unknown, Pm,a is indicated (see inset).
Molecular-dynamics simulations
Cholesterol increases membrane viscosity as judged from the increased steady-state fluorescence anisotropy of lipid probes (53). However, it seems to exert little effect on the microviscosity of DOPC bilayers, if its small effect on the lateral lipid diffusion coefficient is taken as a criterion (56,57). Because D is governed by viscosity, we expected a reduction in Pm (compare Eq. 1). Because this is at odds with the increase in Pm at 20 mol % cholesterol observed in our experiments, we performed atomistic molecular-dynamics simulations with TEA in DOPC and POPE bilayers to gain insight into the underlying structural and energetic mechanisms. Typical simulation systems of a membrane system of pure DOPC, as well as DOPC plus 40% cholesterol, are visualized in the parts of Fig. 1, D and E, respectively. Fig. 4 A presents the transverse diffusion coefficient D(z) of TEA across membranes composed of DOPC, plus an increasing cholesterol content [Chol] between 0 and 50 mol %. Here, z = 0 corresponds to the center of the membrane. The diffusion constant is reduced by approximately one order of magnitude in the inside of the membrane (|z| ≤ 2 nm) as compared to the bulk water (broken line), in agreement with previous simulation studies (16). However, we found that D(z) is independent of [Chol] (see also Discussion), suggesting that the viscosity, which is directly related to the diffusion constant, is not involved in the modulation of Pm by cholesterol. This observation further indicates that changes in K(z) must be responsible for the observed alterations in the permeability.
In addition to D(z), we computed PMFs G(z) as a function of the membrane normal z using the technique of umbrella sampling simulations. Because we defined the PMF to 0 in the bulk water, the PMF allowed calculation of the position-dependent partitioning K(z) (Fig. 4 B) for all cholesterol concentrations,
| (7) |
where k and T denote the Boltzmann constant and the temperature, respectively. Integrating 1/(K(z)D(z)) along z yields the permeability (Eq. 2) for each [Chol], as listed in Table 1. Fig. 3 C shows Pm, relative to the permeability without cholesterol. The calculated Pm (Fig. 4 C, magenta) reflected the biphasic experimental dependence of Pm on [Chol] (Fig. 4 C, green) with reasonable accuracy, suggesting that changes in K(z) are solely responsible for the experimentally observed cholesterol effects on Pm.
Table 1.
Absolute TEA and ammonia permeabilities computed from the simulations
| [Chol] (mol %) | PTEA, DOPC (cm/s) | PNH3, DOPC (cm/s) |
|---|---|---|
| 0 | 0.34 | 0.13 |
| 20 | 0.56 | 0.10 |
| 30 | 0.54 | 0.05 |
| 40 | 0.28 | 0.010 |
| 50 | 0.06 | 0.004 |
The effect of [Chol] on the permeability can be further analyzed by a closer inspection of K(z). At [Chol] = 0%, K(z) had its minimum at the lipid headgroups (Fig. 4 B, black curve, |z| ≈ 2 nm), and a large K(z) of ∼5.5 was found at the lipid tails (|z| ≈ 1 nm), a value which is in excellent agreement with the experimental hexadecane/water partition coefficient of TEA of 5.2 (58). Hence, the reduced partitioning of TEA into the headgroup region caused the small permeability across pure DOPC. With increasing [Chol], K(z) is increased at the lipid headgroups and simultaneously reduced at the lipid tails (Fig. 4 B, arrows). At high [Chol] ≥ 40%, the reduced K(z) at the lipid tails outweighs the increased K(z) at the headgroups (Fig. 4 B, blue and orange curves), leading to the biphasic dependence of Pm on [Chol] (Fig. 4 C).
What are the structural mechanisms underlying the cholesterol effects on partitioning? Fig. 5 A (red curve) presents the membrane area per lipid headgroup AHG versus [Chol], averaged from equilibrium simulations of DOPC/cholesterol membranes. AHG increased monotonously with [Chol], that is, the bulky polycyclic cholesterol groups expanded the bilayer (see also insets in Fig. 5 A). AHG should not be confused with the area per lipid that is frequently computed after subtracting the contribution of cholesterol to the total membrane area (Fig. 5 A, gray curve). The latter quantity decreases with [Chol], referred to as the condensing effect of cholesterol (17,59). We suggest that the increased distance between the headgroups (Fig. 5 A, red) reduced the significance of the unfavorable contact between the hydrophobic TEA and the polar headgroups, thereby lowering the access resistance of TEA into the headgroup region. For the lipid tail region (|z| ≈ 1 nm), cholesterol increases the ordering of the lipid tails, leading to a reduced free volume and stronger van der Waals packing between lipid tails and cholesterol (insets in Fig. 5 B).
Figure 5.
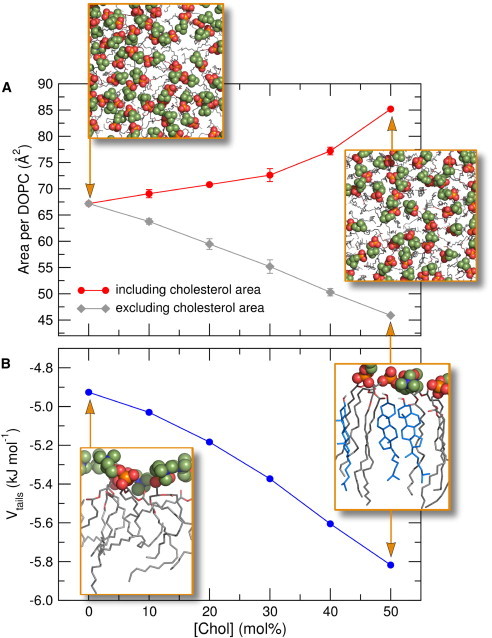
On the structural mechanism underlying cholesterol effects on the partition coefficients in DOPC membranes. (A, red) Membrane cross-section area per phospholipid headgroup versus cholesterol content [Chol], demonstrates increasing distance between headgroups. (Insets) Top views onto DOPC membranes containing 0% and 50% cholesterol, respectively. (Spheres) Choline and phosphate groups; (stick representation) all other groups. (A, gray) Area per phospholipid after subtraction of the area occupied by cholesterol, demonstrating the condensing effect of cholesterol. (B) Interaction energy Vtails per atom between all atoms of the lipid tails and cholesterol versus [Chol]. Stronger (more negative) Vtails indicates tighter packing by the formation of large van der Waals contacts upon the addition of cholesterol. (Insets) Packing between lipid tails and cholesterol at 0 and 50% cholesterol. Error bars indicate 1 SD (invisibly small in panel B). To see this figure in color, go online.
From simulations of other phospholipid membranes, we previously demonstrated that the lipid tail packing provides an accurate structural determinant for solute partitioning into the lipid tail region (17). As a measure for tail packing, Fig. 5 B shows the average potential energy Vtails between all pairs of lipid tail and cholesterol atoms. Vtails becomes stronger (more negative) with increasing cholesterol content, suggesting that large van der Waals contacts between lipid tails and cholesterol form with increasing [Chol]. These contacts must be broken upon the insertion of a TEA molecule, causing the reduced partitioning of TEA into the lipid tail region at high [Chol]. The increased van der Waals contacts between lipid tails and/or cholesterol are also visible in the molecular representations shown in the insets of Fig. 5 B.
The above considerations suggest that facilitation of membrane permeation by cholesterol is limited to those substances for which the headgroup region may represent the main barrier to permeation. This should merely apply to very hydrophobic substances. Because the main barrier for hydrophilic molecules is always located at the hydrophobic core, permeation of these molecules may only be hindered by cholesterol. To test this hypothesis, we computed the partition coefficient of three additional solutes—pyridine, nitric oxide, and ammonia—across membranes of DOPC and POPE at 0 and 40% cholesterol content (Fig. 6, C–F).
Figure 6.
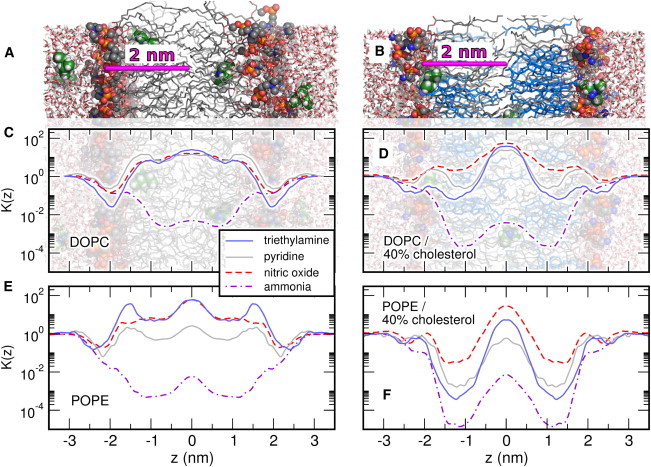
Effects of solute size and hydrophobicity on micropartitioning. (A and B) Simulation systems to guide the eye. (C–F) Partition coefficient K(z) for TEA (blue, solid), pyridine (gray, solid), nitric oxide (red, broken), and ammonia (purple, dot-dashed) in membranes of (C) pure DOPC, (D) DOPC/40% cholesterol, (E) pure POPE, and (F) POPE/40% cholesterol. The membrane normal z is plotted in accordance to the scale in panels A and B, allowing one to assign variations of K(z) to regions of the membrane. In pure phospholipid membranes in panels C and E, the permeation of hydrophobic solutes is limited by the barrier at the headgroups (|z| ∼ 2 nm). In contrast, the permeation of the polar ammonia is not limited by the headgroups, but by the barrier at the hydrophobic tails. (D and F) Upon the addition of cholesterol, the headgroup barrier nearly vanishes, whereas a barrier at the lipid tails is created. Statistical uncertainties are shown in Fig. S5 in the Supporting Material. To see this figure in color, go online.
Here, the K(z) curves in Fig. 6, C and D, are plotted in the same scale as the simulation snapshots in Fig. 6, A and B, allowing one to assign variations in K(z) to regions in the membrane. For the hydrophobic solutes pyridine and nitric oxide, the partitioning is similar to TEA in both DOPC and POPE, with a rate-limiting cholesterol-dependent barrier at the headgroups. For the polar ammonia, in contrast, the mechanism is qualitatively different and analyzed in more detail in Fig. 4, D–F. The position-dependent diffusion constant D(z) is independent of [Chol] (Fig. 4 D), suggesting that, likewise to TEA, variations of the permeability is solely determined by the partitioning. For the polar ammonia, K(z) is minimized at the lipid tails and it decreases gradually with [Chol] (Fig. 4 E), leading to a gradual decrease of Pm with [Chol], as has frequently been found experimentally for polar solutes (Fig. 4 F) (20,52,53).
Discussion
We found that the transversal diffusion constant D of solutes is invariant of cholesterol concentration. That finding might come as a surprise because cholesterol increases the packing in the lipid tail region and therefore increases the viscosity of the membrane (53). However, the invariance of D can be rationalized from the simulations presented here and in our previous study (17). Upon the addition of solutes into the lipid tail region, van der Waals contacts between lipid tails and cholesterol molecules must break up. Because of the stiffness of cholesterol molecules and, to a lesser extent, of the lipid tails, those van der Waals contacts cannot be fully replaced by solute-lipid contacts. Instead, defects form below and above the solute, which might be filled by a few water molecules or by a highly flexible lipid tail (Fig. 7; see also Fig. 7 in Wennberg et al. (17). The required free energy for the formation of such a defect increases with tighter packing of the membrane, leading to a reduced partition coefficient in cholesterol-containing membranes. However, and this is the key finding, as soon as the defect is formed, it allows a relatively unhindered diffusion of the solute in the transversal direction. Notably, visual inspections of our simulations showed that such defects only form near the solute along the membrane normal, but not along the membrane plane. Therefore, the mechanism described here does not contradict a reduced lateral diffusion coefficient in cholesterol-containing membranes.
Figure 7.
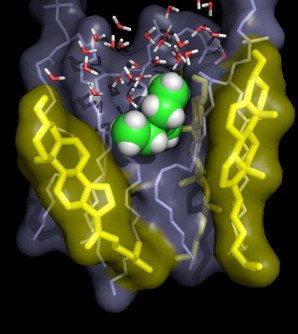
Typical simulation snapshot of a DOPC simulation with 50 mol % cholesterol, with a TEA molecule located at a distance of z ≈ 1.5 nm from the membrane center. (Spheres) TEA; (thin sticks) DOPC and water; and (thick sticks) cholesterol. The TEA molecule is tightly packed in the lateral direction (i.e., membrane plane). In the transversal direction, however, it forms contacts with highly mobile groups (the DOPC tail and water), rationalizing the invariance of the transversal diffusion coefficient. To see this figure in color, go online.
Thus, an adequate description of cholesterol’s effect on Pm requires knowledge of the partition coefficient as a function of the penetration depth (Fig. 4 B and E). Understanding how cholesterol increases solute mobility is impossible within either
-
1.
The framework of the conventional solubility diffusion model, which envisions membrane diffusion to be similar to diffusion through a homogenous medium (11) or
-
2.
The framework of the three-slab model, which divides the membrane into three homogenous regions that any solute or solvent has to cross in a successive fashion (18,20).
Here we found that intercalation of cholesterol into the membrane has two effects: 1), it impedes solute partition into the acyl-chain region; and 2), it increases the average distance between the phospholipid headgroups. Consequently, the effect of cholesterol on Pm depends on whether the flux-limiting free-energy barrier for permeation is located at the acyl chains or at the headgroups. That is, if the main barrier to permeation is in the region of the carbonyl groups in a cholesterol-free membrane, addition of cholesterol increases the barrier and decreases Pm. That cholesterol mechanism holds for hydrophilic solutes in putatively any lipid membrane and, as found here, for the apolar TEA in E. coli lipid extract. A notable exception is the increased membrane proton permeability upon cholesterol addition (53).
In contrast, if the main barrier to permeation is located in the headgroup region, cholesterol decreases that barrier and increases Pm. A further increase in cholesterol concentration hampers the entry into the hydrophobic interior, so that the barrier in the hydrophobic region eventually becomes dominant. In turn, Pm decreases. This dual role of cholesterol is responsible for the bell-shaped dependence of Pm on cholesterol concentration (Fig. 2 C), which we found in DOPE and DOPC membranes. The balance between the barrier functions of the headgroup and hydrophobic regions is not only a function of the hydrophobicity of the molecules, it depends also on solute size and saturation of the lipid tails. Saturated lipid tails lead to a stronger decrease of the partitioning in the hydrophobic region upon the addition of cholesterol as compared to unsaturated tails (compare Fig. 6, D and F).
It is important to note that the bell-shaped Pm-versus-cholesterol profile is a specific phenomenon of the model lipids chosen and does not apply to the biological membranes that were tested here. Instead, we found a monotonously decreasing TEA permeability for E. coli PLE. The Pm value of PLE is between that of pure DOPC and DOPE, despite the fact that the acyl-chain region is more tightly packed in natural lipid mixture than in the di-oleoyl membranes, as reflected in the larger area per lipid of DOPC and DOPE. As a result the headgroups may have lost the ability to act as a rate-limiting barrier, very much in contrast to their functioning in DOPE and DOPC bilayers. Consequently, the addition of cholesterol leads to a gradual decrease of Pm in the PLE membrane. The same line of arguments applies to brain lipid extract, consisting of roughly 50% PE and PC lipids. It also shows a decrease of Pm at 20% cholesterol. However, unidentified components that account for 30% of brain lipids may also be responsible. Thus, further experiments and simulations are required to define the molecular requirements for a rate-limiting headgroup barrier.
The cholesterol effects observed in this study allow two additional conclusions:
-
1.
The smaller the molecule, the smaller the remaining relative barrier in the hydrophobic region. For very small hydrophobic molecules such as NO in a membrane with purely unsaturated tails, this barrier never limits membrane diffusion (Fig. 6 D). Consequently, a situation is possible where even at its highest concentrations, cholesterol does not decrease Pm.
-
2.
A cholesterol-mediated hundred- or thousand-fold reduction in Pm to CO2 is unlikely (60) because CO2 and NO do not differ very much in hydrophobicity or size. In contrast, our study explains why a cholesterol effect on Pm to CO2 may not be observable (4,61). It delivers the so-far missing molecular picture for the observation that membranes cannot be transformed into barriers for molecules like NO or CO2. The important consequence is that their transmembrane flux cannot be regulated by membrane transporters. Instead, the flux is a function of the availability of NO or CO2, which, in turn, is under tight enzymatic control (61,62).
We conclude that the interplay of solute size, solute hydrophobicity, and membrane structure may well be reflected by the position-dependent partition coefficient K(z). Depicting the membrane as a homogenous medium or as a series of homogenous slabs does not allow precise predictions of Pm. However, it does allow predictions of the approximate order of magnitude—that is, the validity of the solubility diffusion model for rough estimates of Pm remains unchallenged. Calculation of Pm from K(z) by molecular-dynamics simulation is an excellent tool to derive the molecular and energetic determinants underlying solute permeation.
Acknowledgments
J.S.H. was supported by the Deutsche Forschungsgemeinschaft (grant No. HU 1971/1-1) and by a Marie-Curie Intra-European Fellowship. The project was also supported by grant No. P23466 of the Austrian Science Fund to P.P.
Contributor Information
Peter Pohl, Email: peter.pohl@jku.at.
Jochen S. Hub, Email: jhub@gwdg.de.
Supporting Material
References
- 1.Deamer D.W., Bramhall J. Permeability of lipid bilayers to water and ionic solutes. Chem. Phys. Lipids. 1986;40:167–188. doi: 10.1016/0009-3084(86)90069-1. [DOI] [PubMed] [Google Scholar]
- 2.Paula S., Volkov A.G., Deamer D.W. Permeation of protons, potassium ions, and small polar molecules through phospholipid bilayers as a function of membrane thickness. Biophys. J. 1996;70:339–348. doi: 10.1016/S0006-3495(96)79575-9. [DOI] [PMC free article] [PubMed] [Google Scholar]
- 3.Mathai J.C., Missner A., Pohl P. No facilitator required for membrane transport of hydrogen sulfide. Proc. Natl. Acad. Sci. USA. 2009;106:16633–16638. doi: 10.1073/pnas.0902952106. [DOI] [PMC free article] [PubMed] [Google Scholar]
- 4.Missner A., Kügler P., Pohl P. Carbon dioxide transport through membranes. J. Biol. Chem. 2008;283:25340–25347. doi: 10.1074/jbc.M800096200. [DOI] [PMC free article] [PubMed] [Google Scholar]
- 5.Gutknecht J., Tosteson D.C. Diffusion of weak acids across lipid bilayer membranes: effects of chemical reactions in the unstirred layers. Science. 1973;182:1258–1261. doi: 10.1126/science.182.4118.1258. [DOI] [PubMed] [Google Scholar]
- 6.Saparov S.M., Liu K., Pohl P. Fast and selective ammonia transport by aquaporin-8. J. Biol. Chem. 2007;282:5296–5301. doi: 10.1074/jbc.M609343200. [DOI] [PMC free article] [PubMed] [Google Scholar]
- 7.Pohl E.E., Krylov A.V., Pohl P. Changes of the membrane potential profile induced by verapamil and propranolol. Biochim. Biophys. Acta. 1998;1373:170–178. doi: 10.1016/s0005-2736(98)00098-4. [DOI] [PubMed] [Google Scholar]
- 8.Saparov S.M., Antonenko Y.N., Pohl P. A new model of weak acid permeation through membranes revisited: does Overton still rule? Biophys. J. 2006;90:L86–L88. doi: 10.1529/biophysj.106.084343. [DOI] [PMC free article] [PubMed] [Google Scholar]
- 9.Seelig A. The role of size and charge for blood-brain barrier permeation of drugs and fatty acids. J. Mol. Neurosci. 2007;33:32–41. doi: 10.1007/s12031-007-0055-y. [DOI] [PubMed] [Google Scholar]
- 10.Sugano K., Kansy M., Senner F. Coexistence of passive and carrier-mediated processes in drug transport. Nat. Rev. Drug Discov. 2010;9:597–614. doi: 10.1038/nrd3187. [DOI] [PubMed] [Google Scholar]
- 11.Missner A., Pohl P. 110 years of the Meyer-Overton rule: predicting membrane permeability of gases and other small compounds. ChemPhysChem. 2009;10:1405–1414. doi: 10.1002/cphc.200900270. [DOI] [PMC free article] [PubMed] [Google Scholar]
- 12.Lieb W.R., Stein W.D. Non-Stokesian nature of transverse diffusion within human red cell membranes. J. Membr. Biol. 1986;92:111–119. doi: 10.1007/BF01870701. [DOI] [PubMed] [Google Scholar]
- 13.Xiang T.X., Anderson B.D. The relationship between permeant size and permeability in lipid bilayer membranes. J. Membr. Biol. 1994;140:111–122. doi: 10.1007/BF00232899. [DOI] [PubMed] [Google Scholar]
- 14.Luxnat M., Galla H.J. Partition of chlorpromazine into lipid bilayer membranes: the effect of membrane structure and composition. Biochim. Biophys. Acta. 1986;856:274–282. doi: 10.1016/0005-2736(86)90037-4. [DOI] [PubMed] [Google Scholar]
- 15.Cantor R.S. Bilayer partition coefficients of alkanols: predicted effects of varying lipid composition. J. Phys. Chem. B. 2001;105:7550–7553. [Google Scholar]
- 16.Marrink S.J., Berendsen H.J.C. Permeation process of small molecules across lipid-membranes studied by molecular-dynamics simulations. J. Phys. Chem. 1996;100:16729–16738. [Google Scholar]
- 17.Wennberg C.L., van der Spoel D., Hub J.S. Large influence of cholesterol on solute partitioning into lipid membranes. J. Am. Chem. Soc. 2012;134:5351–5361. doi: 10.1021/ja211929h. [DOI] [PubMed] [Google Scholar]
- 18.Nagle J.F., Mathai J.C., Tristram-Nagle S. Theory of passive permeability through lipid bilayers. J. Gen. Physiol. 2008;131:77–85. doi: 10.1085/jgp.200709849. [DOI] [PMC free article] [PubMed] [Google Scholar]
- 19.Marrink S.J., Berendsen H.J.C. Simulation of water transport through a lipid membrane. J. Phys. Chem. 1994;98:4155–4168. [Google Scholar]
- 20.Mathai J.C., Tristram-Nagle S., Zeidel M.L. Structural determinants of water permeability through the lipid membrane. J. Gen. Physiol. 2008;131:69–76. doi: 10.1085/jgp.200709848. [DOI] [PMC free article] [PubMed] [Google Scholar]
- 21.Montal M., Mueller P. Formation of bimolecular membranes from lipid monolayers and a study of their electrical properties. Proc. Natl. Acad. Sci. USA. 1972;69:3561–3566. doi: 10.1073/pnas.69.12.3561. [DOI] [PMC free article] [PubMed] [Google Scholar]
- 22.Hub J.S., Winkler F.K., de Groot B.L. Potentials of mean force and permeabilities for carbon dioxide, ammonia, and water flux across a Rhesus protein channel and lipid membranes. J. Am. Chem. Soc. 2010;132:13251–13263. doi: 10.1021/ja102133x. [DOI] [PubMed] [Google Scholar]
- 23.Ulmschneider J.P., Ulmschneider M.B. United atom lipid parameters for combination with the optimized potentials for liquid simulations all-atom force field. J. Chem. Theory Comput. 2009;5:1803–1813. doi: 10.1021/ct900086b. [DOI] [PubMed] [Google Scholar]
- 24.Jorgensen W.L., Chandrasekhar J., Klein M.L. Comparison of simple potential functions for simulating liquid water. J. Chem. Phys. 1983;79:926–935. [Google Scholar]
- 25.van der Spoel D., Lindahl E., Berendsen H.J.C. GROMACS: fast, flexible, and free. J. Comput. Chem. 2005;26:1701–1718. doi: 10.1002/jcc.20291. [DOI] [PubMed] [Google Scholar]
- 26.Hess B., Kutzner C., Lindahl E. GROMACS 4: algorithms for highly efficient, load-balanced, and scalable molecular simulation. J. Chem. Theory Comput. 2008;4:435–447. doi: 10.1021/ct700301q. [DOI] [PubMed] [Google Scholar]
- 27.Berger O., Edholm O., Jähnig F. Molecular dynamics simulations of a fluid bilayer of dipalmitoylphosphatidylcholine at full hydration, constant pressure, and constant temperature. Biophys. J. 1997;72:2002–2013. doi: 10.1016/S0006-3495(97)78845-3. [DOI] [PMC free article] [PubMed] [Google Scholar]
- 28.Höltje M., Förster T., Höltje H.D. Molecular dynamics simulations of stratum corneum lipid models: fatty acids and cholesterol. Biochim. Biophys. Acta. 2001;1511:156–167. doi: 10.1016/s0005-2736(01)00270-x. [DOI] [PubMed] [Google Scholar]
- 29.Jorgensen W.L., Maxwell D.S., Tirado-Rives J. Development and testing of the OPLS all-atom force field on conformational energetics and properties of organic liquids. J. Am. Chem. Soc. 1996;118:11225–11236. [Google Scholar]
- 30.Kaminski G.A., Friesner R.A., Jorgensen W.L. Evaluation and reparameterization of the OPLS-AA force field for proteins via comparison with accurate quantum chemical calculations on peptides. J. Phys. Chem. B. 2001;105:6474–6487. [Google Scholar]
- 31.Shivakumar D., Williams J., Sherman W. Prediction of absolute solvation free energies using molecular dynamics free energy perturbation and the OPLS force field. J. Chem. Theory Comput. 2010;6:1509–1519. doi: 10.1021/ct900587b. [DOI] [PubMed] [Google Scholar]
- 32.Cohen J., Arkhipov A., Schulten K. Imaging the migration pathways for O2, CO, NO, and Xe inside myoglobin. Biophys. J. 2006;91:1844–1857. doi: 10.1529/biophysj.106.085746. [DOI] [PMC free article] [PubMed] [Google Scholar]
- 33.Becke A.D. Density-functional exchange-energy approximation with correct asymptotic behavior. Phys. Rev. A. 1988;38:3098–3100. doi: 10.1103/physreva.38.3098. [DOI] [PubMed] [Google Scholar]
- 34.Lee C., Yang W., Parr R.G. Development of the Colle-Salvetti correlation-energy formula into a functional of the electron density. Phys. Rev. B Condens. Matter. 1988;37:785–789. doi: 10.1103/physrevb.37.785. [DOI] [PubMed] [Google Scholar]
- 35.Becke A.D. Density-functional thermochemistry. III. The role of exact exchange. J. Chem. Phys. 1993;98:5648–5652. [Google Scholar]
- 36.Kendall R.A., Dunning J., Harrison R.J. Electron affinities of the first-row atoms revisited. Systematic basis sets and wave functions. J. Chem. Phys. 1992;96:6796–6806. [Google Scholar]
- 37.Woon D.E., Dunning J. Benchmark calculations with correlated molecular wave functions. I. Multireference configuration interaction calculations for the second row diatomic hydrides. J. Chem. Phys. 1993;99:1914–1929. [Google Scholar]
- 38.Frisch M.J., Trucks G.W., Pople J.A. Gaussian; Wallingford, CT: 2004. Gaussian 03, Rev. C.02. [Google Scholar]
- 39.Singh U.C., Kollman P.A. An approach to computing electrostatic charges for molecules. J. Comput. Chem. 1984;5:129–145. [Google Scholar]
- 40.Besler B., Merz K., Kollman P. Atomic charges derived from semiempirical methods. J. Comput. Chem. 1990;11:431–439. [Google Scholar]
- 41.Bussi G., Donadio D., Parrinello M. Canonical sampling through velocity rescaling. J. Chem. Phys. 2007;126:014101. doi: 10.1063/1.2408420. [DOI] [PubMed] [Google Scholar]
- 42.Berendsen H.J.C., Postma J.P.M., Haak J.R. Molecular dynamics with coupling to an external bath. J. Chem. Phys. 1984;81:3684–3690. [Google Scholar]
- 43.Miyamoto S., Kollman P. SETTLE: an analytical version of the SHAKE and RATTLE algorithm for rigid water models. J. Comput. Chem. 1992;13:952–962. [Google Scholar]
- 44.Hess B. P-LINCS: a parallel linear constraint solver for molecular simulation. J. Chem. Theory Comput. 2007;4:116–122. doi: 10.1021/ct700200b. [DOI] [PubMed] [Google Scholar]
- 45.Darden T., York D., Pedersen L. Particle mesh Ewald: an N-log(N) method for Ewald sums in large systems. J. Chem. Phys. 1993;98:10089–10092. [Google Scholar]
- 46.Essmann U., Perera L., Pedersen L. A smooth particle mesh Ewald method. J. Chem. Phys. 1995;103:8577–8593. [Google Scholar]
- 47.Parrinello M., Rahman A. Polymorphic transitions in single crystals: a new molecular dynamics method. J. Appl. Phys. 1981;52:7182–7190. [Google Scholar]
- 48.Kumar S., Rosenberg J., Kollman P. The weighted histogram analysis method for free-energy calculations on biomolecules. I. The method. J. Comput. Chem. 1992;13:1011–1021. [Google Scholar]
- 49.Hub J.S., de Groot B.L., van der Spoel D. G_WHAM-A-free weighted histogram analysis implementation including robust error and autocorrelation estimates. J. Chem. Theory Comput. 2010;6:3713–3720. [Google Scholar]
- 50.Hess B. Determining the shear viscosity of model liquids from molecular dynamics simulations. J. Chem. Phys. 2002;116:209–217. [Google Scholar]
- 51.Antonenko Y.N., Pohl P., Denisov G.A. Permeation of ammonia across bilayer lipid membranes studied by ammonium ion selective microelectrodes. Biophys. J. 1997;72:2187–2195. doi: 10.1016/S0006-3495(97)78862-3. [DOI] [PMC free article] [PubMed] [Google Scholar]
- 52.Demel R.A., Bruckdorfer K.R., van Deenen L.L.M. The effect of sterol structure on the permeability of lipomes to glucose, glycerol and Rb+ Biochim. Biophys. Acta. 1972;255:321–330. doi: 10.1016/0005-2736(72)90031-4. [DOI] [PubMed] [Google Scholar]
- 53.Lande M.B., Donovan J.M., Zeidel M.L. The relationship between membrane fluidity and permeabilities to water, solutes, ammonia, and protons. J. Gen. Physiol. 1995;106:67–84. doi: 10.1085/jgp.106.1.67. [DOI] [PMC free article] [PubMed] [Google Scholar]
- 54.Jurak M. Thermodynamic aspects of cholesterol effect on properties of phospholipid monolayers: Langmuir and Langmuir-Blodgett monolayer study. J. Phys. Chem. B. 2013;117:3496–3502. doi: 10.1021/jp401182c. [DOI] [PubMed] [Google Scholar]
- 55.Horner A., Goetz F., Pohl P. Mechanism for targeting the A-kinase anchoring protein AKAP18δ to the membrane. J. Biol. Chem. 2012;287:42495–42501. doi: 10.1074/jbc.M112.414946. [DOI] [PMC free article] [PubMed] [Google Scholar]
- 56.Lindblom G., Johansson L.B.A., Arvidson G. Effect of cholesterol in membranes. Pulsed nuclear magnetic resonance measurements of lipid lateral diffusion. Biochemistry. 1981;20:2204–2207. doi: 10.1021/bi00511a020. [DOI] [PubMed] [Google Scholar]
- 57.Kahya N., Schwille P. How phospholipid-cholesterol interactions modulate lipid lateral diffusion, as revealed by fluorescence correlation spectroscopy. J. Fluoresc. 2006;16:671–678. doi: 10.1007/s10895-006-0108-6. [DOI] [PubMed] [Google Scholar]
- 58.Abraham M.H., Chadha H.S., Mitchell R.C. Hydrogen bonding: an analysis of water-octanol and water-alkane partitioning and the Δlog P parameter of Seiler. J. Pharm. Sci. 1994;83:1085–1100. doi: 10.1002/jps.2600830806. [DOI] [PubMed] [Google Scholar]
- 59.Róg T., Pasenkiewicz-Gierula M., Karttunen M. Ordering effects of cholesterol and its analogues. Biochim. Biophys. Acta. 2009;1788:97–121. doi: 10.1016/j.bbamem.2008.08.022. [DOI] [PubMed] [Google Scholar]
- 60.Itel F., Al-Samir S., Endeward V. CO2 permeability of cell membranes is regulated by membrane cholesterol and protein gas channels. FASEB J. 2012;26:5182–5191. doi: 10.1096/fj.12-209916. [DOI] [PubMed] [Google Scholar]
- 61.Zocher F., Zeidel M.L., Mathai J.C. Uroplakins do not restrict CO2 transport through urothelium. J. Biol. Chem. 2012;287:11011–11017. doi: 10.1074/jbc.M112.339283. [DOI] [PMC free article] [PubMed] [Google Scholar]
- 62.Fulton D., Gratton J.P., Sessa W.C. Post-translational control of endothelial nitric oxide synthase: why isn’t calcium/calmodulin enough? J. Pharmacol. Exp. Ther. 2001;299:818–824. [PubMed] [Google Scholar]
Associated Data
This section collects any data citations, data availability statements, or supplementary materials included in this article.