

Abstract
Brain-derived neurotrophic factor (BDNF) increases in failing hearts, but BDNF roles in cardiac remodeling following myocardial infarction (MI) are unclear. Male BDNF+/+ [wild-type (WT)] and BDNF+/− heterozygous (HET) mice at 6–9 mo of age were subjected to MI and evaluated at days 1, 3, 5, 7, or 28 post-MI. At day 28 post-MI, 76% of HET versus 40% of WT survived, whereas fractional shortening improved and neovascularization levels were reduced in the HET (all, P < 0.05). At day 1, post-MI, matrix metalloproteinase-9, and myeloperoxidase (MPO) increased in WT, but not in HET. Concomitantly, monocyte chemotactic protein-1 and -5 levels increased and vascular endothelial growth factor (VEGF)-A decreased in HET. Neutrophil infiltration peaked at days 1–3 in WT mice, and this increase was blunted in HET. To determine if MPO administration could rescue the HET phenotype, MPO was injected at 3 h post-MI. MPO restored VEGF-A levels without altering matrix metalloproteinase-9 or neutrophil content. In conclusion, reduced BDNF levels modulated the early inflammatory and neovascularization responses, leading to improved survival and reduced cardiac remodeling at day 28 post-MI. Thus reduced BDNF attenuates early inflammation following MI by modulating MPO and angiogenic response through VEGF-A.
Keywords: brain-derived neurotrophic factor, inflammation, myeloperoxidase, myocardial infarction, obesity, proteomic profiling
during development, the heart and vessels express several neurotrophins, including nerve growth factor, neurotrophin-3 and -4, and brain-derived neurotrophic factor (BDNF) (6). Whereas BDNF promotes neuronal cell differentiation and survival (32), it also circulates systemically outside the central nervous system (35). BDNF and its receptor tropomyosin receptor kinase B are expressed by endothelial cells lining the arteries and capillaries of the heart and skeletal muscle (12). In atherosclerotic plaques, macrophages and smooth muscle cells secrete BDNF to destabilize the plaque and worsen unstable angina (15). Golden and colleagues (20) showed that elevated circulating BDNF levels in middle-aged and elderly adults increase the risk of high blood pressure and cardiometabolic dysfunction. BDNF-deficient mice are perinatally lethal, highlighting its importance (14, 17, 39, 40).
Following myocardial infarction (MI), neovascularization is necessary for repair of the left ventricle (LV) and stabilization of the infarct scar. In other organs, BDNF has been shown to stimulate the formation of new vessels by increasing vascular endothelial growth factor (VEGF) (36). VEGF-A initiates the post-MI angiogenic response (45). Exogenous VEGF, however, only stimulates the formation of fragile and malformed vessels, indicating that VEGF is not sufficient for a complete angiogenic response (13). BDNF null mice are postnatal lethal due to an impaired endothelial cell adhesion that leads to cardiac hemorrhage (12), indicating a role of BDNF in angiogenic processes.
BDNF pretreatment increases the infarct area in old, but not young, rats (5). In the Dahl salt-sensitive rat model of heart failure, 40 days of a high-salt diet increased BDNF levels, suggesting a role for this neurotrophic factor in the failing heart (25). BDNF roles post-MI, however, have not been evaluated. We used male wild-type (WT) and BDNF heterozygous (HET) mice to temporally investigate BDNF roles in the inflammatory and neovascularization responses to MI.
MATERIALS AND METHODS
Mice.
All animal procedures were conducted according to the Guide for the Care and Use of Laboratory Animals (8th ed.) and were approved by the Institutional Animal Care and Use Committees at the University of Texas Health Science Center (San Antonio, TX).
We used 6-9-mo-old C57BL/6 WT (n = 71) and BDNF HET (n = 76) littermate mice. Control day 0 WT (n = 11) and HET (n = 11) mice were used as naïve controls. Only male mice were used in this study, and all groups had similar ages. To induce MI, the mice were anesthetized with 2% isoflurane and the left anterior descending coronary artery was permanently ligated using minimally invasive surgery as previously described (44). To reduce post-MI surgical pain, buprenorphine (0.1 mg/kg ip) was given immediately after the ligation.
Measurements of body composition.
Before surgery, at day 0, the whole body composition analysis was conducted using quantitative magnetic resonance (QMR) instrument (Echo Medical System, Houston, TX), which uses nuclear magnetic resonance to reliably and accurately analyze the physical state of the tissue (41). QMR provides an estimate of total body fat, lean mass, and free water. To perform the QMR analysis, the mice were immobilized in a plastic restrainer tube (without sedation) and placed in the QMR machine. Scanning took less than 2 min per mouse.
Post-MI survival analysis.
The mice were checked daily for the survival analysis. At autopsy, cardiac rupture was confirmed if there were blood clots in the thoracic cavity and the LV rupture site was seen.
Echocardiographic measurements.
For the echocardiography analysis, 0.8–1.0% isoflurane in a 100% oxygen mix was used to anesthetize the mice. Electrocardiograms and heart rates were monitored using a surface electrocardiogram. Images were acquired using the Vevo 770 high-resolution in vivo imaging system (Visual Sonics) and were taken at heart rates > 400 beats/min to achieve physiologically relevant measurements. Measurements were taken from the two-dimensional parasternal long-axis and short-axis (m mode) recordings from the midpapillary region. Echocardiographic studies were performed before death for day 0 control mice and for days 1, 3, 5, 7, and 28 post-MI mice. For each variable, three images from consecutive cardiac cycles were measured and averaged.
Proteomic profiling of plasma analytes.
At necropsy, the heparinized blood was collected from carotid artery of anesthetized mice and centrifuged for 5 min to obtain plasma. Plasma samples (80 μl) were analyzed by the RodentMAP version 2.0 Antigens (Myriad RBM), and concentrations of 58 analytes were measured by a Clinical Laboratory Improvement Amendments certified biomarker testing laboratory using reproducible, quantitative, multiplexed immunoassays (8). Plasma analyte values below the limit of detection were excluded from the results.
Necropsy and infarct area analysis.
At days 1, 3, 5, 7, or 28 post-MI, the mice were euthanized under isoflurane, and the heart and lung were removed. The left and right ventricles were separated and weighed individually. The LV was divided into apex, midcavity, and base. All three LV sections and the right ventricle were stained with 1% 2,3,5-triphenyltetrazolium chloride (Sigma) and photographed for infarct area determination by using Adobe Photoshop CS5 (64 bit) software. Infarct (LVI) and remote (LVC) regions were separated from the apex and base sections and were individually snap frozen and stored at −80°C. The mid cavity section was fixed in 10% zinc-formalin and paraffin-embedded for histological examination. The lung mass and tibia were removed, and the wet and dry weights of lungs and the tibia length were determined.
LV protein extraction, BDNF immunoblotting, and ELISA.
Total protein was extracted by homogenizing the LV infarct area in protein extraction reagent type 4 (7 M urea, 2 M thiourea, 40 mM Trizma base and the detergent 1% C7BzO; Sigma) and 1× protease inhibitor cocktail (Roche). Protein concentrations were determined by the Quick Start Bradford Protein Assay (Bio-Rad). Protein expression levels were quantified by immunoblotting using the following antibodies: matrix metalloproteinase-9 (MMP-9; Abcam, Ab38898, 1:1,000) and BDNF (Abcam, Ab46176, 1:1,000). Total protein (7.5 or 10 μg) for all samples was separated on 4–12% Criterion XT Bis-Tris gels (Bio-Rad), transferred to nitrocellulose membrane (Bio-Rad), and stained with MemCode Reversible Protein Stain Kit (Thermo Scientific) to verify protein concentration and loading accuracy. After blocking with 5% nonfat milk (Bio-Rad), the membrane was incubated with primary antibody and secondary antibody (PI-1000; Vector) and detected with SuperSignal West Pico Chemiluminescent Substrate (Thermo Scientific). ImageJ was used to measure densitometry, and the densitometry of the 43-kDa band from total protein lane was used as the internal loading control. BDNF levels were also measured using the BDNF Emax immunoassay system (Promega). Plasma samples were acidified with 1 M HCl to adjust the pH below 2.5 for 15 min and then neutralized to pH 7.6 with 1 N NaOH. A standard curve using recombinant BDNF protein was used on each ELISA plate.
Histology.
After necropsy, the LV midcavity section was embedded in paraffin, sectioned at 5 μm, and stained using hematoxylin and eosin for routine assessment. For neutrophils, macrophages, and blood vessel immunohistochemistry, paraffin-embedded 5-μm sections were deparaffinized in Citrisolve (Thermo Fisher Scientific) and rehydrated through graded ethanol. Heat-mediated antigen retrieval was performed to expose antigen epitopes (Target Retrieval Solution, Dako S1699). Sections, blocked with normal rabbit serum, were incubated with rat anti-mouse neutrophils (CL 8993AP, clone 7/4, 1:100; Cedarlane), rat anti-Mac-3 monoclonal antibody (CL 8943AP, clone M3/84; 1:100 dilution; Cedarlane), and for endothelial cells staining biotinylated Griffonia (Bandeiraea) simplicifolia lectin I (GSL I, B-1105, 1:50 dilution; Vector) was used. GSL-1 lectin binds specifically to galactosyl residues, thus labeling the vascular endothelium in mice (2). Neutrophils, macrophages, and endothelial cells staining were followed with the Vectastain Elite ABC kit (6104; Vector).
For neutrophil and macrophage staining, five to six images per slide were acquired from the infarcted area. For GSL-1 staining, five to six images per slide were captured from the infarcted and remote areas. All images were subjected to image analysis using Image-Pro analyzer software 7.0 by an independent operator that was blinded to groups (E. F. Lopez).
RT2 profiler inflammatory PCR array.
RNA extraction was performed using TRIzol reagent (15596, Invitrogen) following the manufacturer's protocol. RNA levels were quantified using the NanoDrop ND-1000 spectrophotometer (Thermo Scientific). Reverse transcription of equal RNA content (0.5 μg) was performed using the RT2 first-strand kit (330401, Qiagen). Real-Time RT-PCR gene array for inflammatory cytokines and receptors (PAMM-011A, Qiagen) was performed to quantify gene expression levels. The gene levels were normalized to hypoxanthine guanine phosphoribosyl transferase 1 (Hprt1) gene as the housekeeping gene, and the results are reported as 2−ΔCt values × 1,000 for inflammatory genes.
To find out targeted genes based on the temporal expression profiles, a biclustering method was used to interpret the inflammatory array data set. The biclustering method categorizes matrixes of expression data into submatrixes based on similarities. These submatrixes represent the subset of genes and the subset of conditions that have high similarity scores (7). Unlike a normal clustering algorithm that uses the similarity of pairs of gene over all conditions, the biclustering algorithm evaluates the coherent similarity of both genes and conditions at the same time, simultaneously clustering the genes and conditions (29).
At each time point, we calculated the fold change of a gene by normalizing the expression level of the genes to the average value of the gene at day 0. The biclustering algorithm was applied to identify the most significant genes for both WT and HET groups. Venn diagrams were constructed by examining the intersection of the identified significant gene sets for WT and HET in the remote (LVC) and infarct (LVI) areas.
Post-MI myeloperoxidase administration.
Male HET mice (n = 6) were subjected to coronary ligation and myeloperoxidase (MPO) injection. At 3 h after coronary ligation, MI was confirmed by echocardiography and murine MPO (catalog no. 3667-MP, R & D systems) was injected (1 mg/kg body wt ip). Mice were euthanized at 24 h post-MI, heparinized plasma was subjected to proteomic profiling, and the LV midcavity was examined for neutrophils by immunohistochemistry.
Statistical analyses.
Data are presented as means ± SE. Multiple group comparisons were performed using the one-way ANOVA, followed by the Student-Newman-Keuls test. The 28 day survival rate was presented as the cumulative Kaplan-Meier survival curve and analyzed by log-rank test. For gene expression results, post-MI remote and infarct expressed genes were normalized with respective day 0 control, and WT and HET genes are presented as Venn diagrams. GraphPad Prism was used for statistical analysis, and P < 0.05 was considered statistically significant.
RESULTS
Active BDNF increased in the infarct region.
Extracellular proteases cleave pro-BDNF form into an active mature BDNF form (38). To evaluate the time course of BDNF activity in the infarcted LV at days 1, 3, 5, or 7 post-MI, we used an anti-BDNF antibody that recognizes a 28-kDa proform and 16-kDa active form of BDNF under reducing conditions. Pro-BDNF levels did not change through day 3 post-MI and significantly decreased at days 5 and 7 post-MI in WT. Active BDNF significantly increased at day 1, 3, and 5 post-MI and returned toward day 0 values by day 7 (Fig. 1, A–C). The increase in mature BDNF occurred during the inflammatory phase following MI. Furthermore, we also examined total BDNF levels in the WT and HET mice at day 0 and all post-MI time points. The HET mice showed lower BDNF levels compared with WT littermates (Fig. 1D).
Fig. 1.
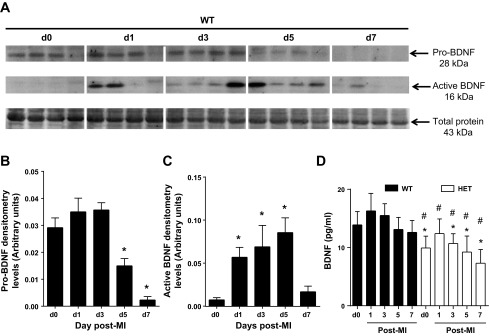
Temporal profile of pro- and active brain-derived neurotrophic facto (BDNF) in the infarct region of wild-type (WT) mice. A: representative immunoblot of n = 4 samples/group showing that myocardial infarction (MI) reduced pro-BDNF (2- kDa form; top) at days (d) 5 and 7 and stimulated activation of BDNF (16-kDa form; middle) at days 1, 3, and 5 post-MI, compared with day 0 no MI control levels; densitometries for the individual lanes were normalized to the total protein membrane stain for that lane (bottom). Densitometry demonstrated reduced pro-BDNF (28 kDa) at days 5 and 7 (B), whereas active BDNF was increased in the infarcted region in the left ventricle (LV) at days 1, 3, and 5 post-MI (C). D: total BDNF levels were lowered in BDNF heterozygous (HET) mice compared with WT (n = 6 mice/group/time point). Values are means ± SE. *P < 0.05 vs. day 0 control; #P < 0.05 vs. WT for respective time point.
HET mice are overweight but show increased post-MI survival and improved LV function.
Rios et al. (39) have reported that partial loss of the bdnf gene in HET mice results in weight gain in adulthood because of increased caloric intake. We confirmed by whole body composition analysis using QMR that at baseline HET mice (n = 20) had 46% enhanced fat mass compared with WT mice (n = 24). Body weight and fat mass increased in HET mice (P < 0.05 for both) without an increase in lean mass or water content (Fig. 2, A–C).
Fig. 2.

HET mice were overweight, but post-MI survival was improved. By 6 mo of age, male HET mice showed increased body weight and a substantial increase in fat mass compared with WT controls (WT, n = 20; and HET, n = 24). A: body weight. B: fat mass. C: lean mass. Values are means ± SE. *P < 0.05 vs. WT. D: partial deletion of BDNF improved day 28 post-MI survival. Survival rates are presented as Kaplan-Meier survival curve and compared by log-lank test. *P < 0.05 vs. WT, n = 20 WT, and n = 17 HET. E: infarct areas were similar between WT and HET mice, as shown by the representative 1% 2,3,5-triphenyltetrazolium chloride stained images at days 0 (control), 1, 3, 5, 7, and 28 post-MI.
During the 28-day post-MI period, WT mice had a survival rate of 40% (8 of 20 mice), whereas HET mice had a survival rate of 76% (13 of 17 mice; P < 0.05; Fig. 2D). In the WT group, 58% of the deaths (7 of 12) were due to cardiac rupture, whereas in the HET group, 50% of the deaths (2 of 4) were due to rupture (P = not significant). Nonrupture-related deaths, likely the result of heart failure or arrhythmias, accounted for 42% of the deaths (5 of 12) in the WT mice and 50% of the deaths in the HET mice (P = not significant). The 24-h perioperative mortality rates were similar between WT and HET groups for all individual time points examined and ranged from 10–15% for each group per time point.
Echocardiographic data from the surviving mice at days 1, 3, 5, 7, and 28 post-MI showed significant increases in end-diastolic and -systolic dimensions with reduced infarct wall thickness in both WT and HET mice (Table 1). At day 28 post-MI, the extent of LV dilation and decline in fractional shortening was improved in HET mice, compared with WT mice (both P < 0.01). These data indicate that reduced BDNF levels in HET mice limited adverse remodeling in response to MI.
Table 1.
Echocardiography results
|
Day 0 Control |
Day 1 |
Day 3 |
Day 5 |
Day 7 |
Day 28 |
|||||||
|---|---|---|---|---|---|---|---|---|---|---|---|---|
| WT | HET | WT | HET | WT | HET | WT | HET | WT | HET | WT | HET | |
| n | 11 | 11 | 10 | 18 | 10 | 11 | 10 | 11 | 10 | 12 | 8 | 9 |
| HR, beats/min | 425 ± 11 | 422 ± 6 | 441 ± 14 | 444 ± 7 | 452 ± 17 | 469 ± 11 | 429 ± 8 | 433 ± 10 | 440 ± 9 | 450 ± 10 | 436 ± 12 | 409 ± 7 |
| EDD, mm | 3.9 ± 0.08 | 4.1 ± 0.08 | 4.7 ± 0.08* | 4.7 ± 0.08† | 4.7 ± 0.03* | 4.8 ± 0.06† | 5.2 ± 0.12* | 5.4 ± 0.10† | 5.9 ± 0.13* | 5.8 ± 0.19† | 6.6 ± 0.1* | 6.2 ± 0.1†,‡ |
| ESD, mm | 2.8 ± 0.1 | 3.0 ± 0.1 | 4.3 ± 0.1* | 4.5 ± 0.03† | 4.5 ± 0.03* | 4.5 ± 0.06† | 4.9 ± 0.1* | 5.1 ± 0.1† | 5.6 ± 0.1* | 5.6 ± 0.1† | 6.4 ± 0.2 | 6.0 ± 0.1†,‡ |
| IWT, mm | 1.02 ± 0.03 | 1.02 ± 0.03 | 0.74 ± 0.08* | 0.73 ± 0.05† | 0.44 ± 0.01* | 0.52 ± 0.02† | 0.43 ± 0.02* | 0.48 ± 0.02† | 0.41 ± 0.02* | 0.42 ± 0.03† | 0.31 ± 0.02* | 0.27 ± 0.02† |
| FS, % | 31 ± 1 | 30 ± 1 | 8 ± 1* | 9 ± 1† | 5 ± 0.4* | 5 ± 0.4† | 5 ± 0.6* | 4 ± 0.2† | 4 ± 1* | 4 ± 1† | 2 ± 0.2* | 4 ± 0.7†,‡ |
Values are means ± SE; n indicates sample size. EDD, end-diastolic dimension; ESD, end-systolic dimension; FS, fractional shortening; HR, heart rate; IWT, infarct wall thickness in systole.
P < 0.05 vs. day 0 wild-type (WT) control;
P < 0.05 vs. day 0 heterozygous (HET) control;
P < 0.05, WT vs. HET.
Reduced post-MI LV hypertrophy and pulmonary edema in HET mice.
Infarct area analysis for the WT and HET mice at days 1, 3, 5, 7, and 28 post-MI showed that infarct areas did not differ by time or genotype, indicating that all mice received a similar ischemic injury (Table 2 and Fig. 2E). An increase in post-MI LV mass and LV mass normalized to tibia indicate LV hypertrophy, whereas an increase in lung wet weight and right ventricle masses are indexes of pulmonary edema. As shown in Table 2, the LV mass to body weight ratio increased in WT mice, and this increase was significantly reduced in the HET mice (P < 0.05). Right ventricle and lung mass to body weight ratios were significantly increased in WT mice compared with HET mice at day 28 post-MI (P < 0.05 all). The necropsy analysis of right ventricle, LV, and lung mass to body weight ratios indicated reduced post-MI LV hypertrophic response and pulmonary edema in the HET post-MI mice.
Table 2.
Necropsy results
|
Day 0 Control |
Day 1 |
Day 3 |
Day 5 |
Day 7 |
Day 28 |
|||||||
|---|---|---|---|---|---|---|---|---|---|---|---|---|
| WT | HET | WT | HET | WT | HET | WT | HET | WT | HET | WT | HET | |
| n | 11 | 11 | 10 | 18 | 10 | 11 | 10 | 11 | 10 | 12 | 8 | 9 |
| BW, g | 29.3 ± 0.6 | 33.0 ± 1.3‡ | 29.0 ± 0.9 | 33.8 ± 1.0‡ | 24.4 ± 0.5 | 28.7 ± 0.8‡ | 25.3 ± 0.8 | 27.7 ± 0.6 | 26.3 ± 1.1 | 29.2 ± 0.9 | 28.3 ± 0.5 | 33.0 ± 1.3‡ |
| LV, mg | 90 ± 2 | 95 ± 4 | 101 ± 4* | 103 ± 2 | 99 ± 2 | 108 ± 3 | 108 ± 3* | 112 ± 2† | 104 ± 2* | 106 ± 2 | 105 ± 2* | 105 ± 2† |
| LV/BW, mg/g | 3.1 ± 0.06 | 2.9 ± 0.1 | 3.5 ± 0.1* | 3.1 ± 0.07 | 4.1 ± 0.1* | 3.7 ± 0.0† | 4.4 ± 0.1* | 4.1 ± 0.1† | 4.0 ± 0.1* | 3.7 ± 0.1† | 3.7 ± 0.1* | 3.2 ± 0.1†,‡ |
| LV/Tibia, mg/mm | 5.0 ± 0.1 | 5.3 ± 0.2 | 5.5 ± 0.2* | 5.7 ± 0.1 | 5.5 ± 0.1* | 6.0 ± 0.2 | 6.0 ± 0.1* | 6.1 ± 0.1 | 6.0 ± 0.1* | 6.0 ± 0.1 | 6.1 ± 0.1* | 6.0 ± 0.1 |
| LV/BW, mg/g | 0.6 ± 0.01 | 0.5 ± 0.01 | 0.6 ± 0.01 | 0.5 ± 0.02 | 0.7 ± 0.01* | 0.6 ± 0.01†,‡ | 0.7 ± 0.02* | 0.6 ± 0.00† | 0.6 ± 0.0* | 0.6 ± 0.02 | 0.6 ± 0.01 | 0.5 ± 0.01 |
| LV/Tibia, mg/mm | ||||||||||||
| RV, mg | 18 ± 1 | 19 ± 1 | 19 ± 1 | 20 ± 1 | 19 ± 1 | 20 ± 1 | 20 ± 1 | 20 ± 1 | 21 ± 1 | 20 ± 1 | 31 ± 2* | 24 ± 1†,‡ |
| RV/BW, mg/g | 0.6 ± 0.02 | 0.5 ± 0.02 | 0.6 ± 0.03 | 0.6 ± 0.02 | 0.8 ± 0.03* | 0.7 ± 0.02 | 0.8 ± 0.04* | 0.7 ± 0.03 | 0.8 ± 0.04* | 0.7 ± 0.04 | 1.1 ± 0.07* | 0.7 ± 0.05‡ |
| LW/BW, mg/g | 4.7 ± 0.2 | 4.4 ± 0.3 | 5.3 ± 0.4 | 4.3 ± 0.3 | 7.3 ± 0.5 | 5.3 ± 0.2 | 8.2 ± 1.2* | 7.0 ± 0.5 | 8.4 ± 1.0* | 7.9 ± 0.7† | 9.4 ± 1.0* | 5.6 ± 0.8†,‡ |
| Infarct, % | 46 ± 1 | 50 ± 1 | 49 ± 1 | 43 ± 1 | 43 ± 3 | 43 ± 1 | 45 ± 1 | 46 ± 1 | 51 ± 1 | 47 ± 1 | ||
Values are means ± SE; n indicates sample size. BW, body weight; Infarct, infarct area; LV, left ventricle mass; RV, right ventricle mass; LW, lung weight; Tibia, tibia length.
P < 0.05 vs. day 0 WT control;
P < 0.05 vs. day 0 HET control;
P < 0.05, WT vs. HET.
Plasma proteomic profiling revealed reduced inflammatory markers in HET mice.
We used plasma proteomic profiling to gain mechanistic insight into how a reduction in BDNF levels could translate to improved outcomes post-MI. Out of 58 analytes examined, 27 were statistically different between the WT and HET mice for any of the time points examined. Of these, 24 were increased and 3 were decreased in the HET mice (Fig. 3). At day 0, endothelin-1 was the only analyte significantly reduced in HET mice compared with WT mice (P < 0.05).
Fig. 3.
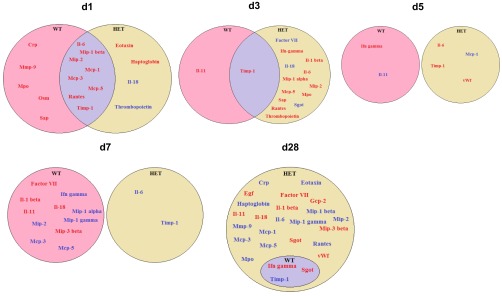
Venn diagrams of the post-MI plasma proteomic profiling comparison between WT and HET mice. Red, ↑protein levels; Blue, ↓protein level; purple, intersection protein levels modified in both WT and HET. In the WT mice at day 1 post-MI, increased levels of myeloperoxidase (MPO) and matrix metalloproteinase-9 (MMP-9) are prominent changes. In the HET mice, there are delayed inflammatory responses seen at days 3 and 28 post-MI.
At day 1 post-MI, MMP-9, MPO, and VEGF-A levels all increased from day 0 values in WT mice, and these increases were attenuated in the HET mice (Fig. 4, A and B; both P < 0.05). Likewise, monocyte chemotactic protein (MCP)-1 and -5 levels were both elevated from day 0 values in WT mice, but levels were further increased in the HET mice (Fig. 4, C and D; both P < 0.05). These results suggest that reduced BDNF attenuated the early inflammatory response. Elevated MCP-1 could improve post-MI wound healing by signaling an earlier monocyte recruitment into the infarcted LV to stimulate the phagocytosis of dead cardiomyocytes (43).
Fig. 4.

Plasma proteomic profiling demonstrated an attenuated inflammatory response in HET mice. Out of 58 analytes, 27 were altered and of these 4 were genotype dependent. Plasma MPO (A) and MMP-9 (B) levels were significantly lower in HET mice compared with WT mice at day 1 post-MI. Furthermore, plasma monocyte chemotactic protein-1 (MCP-1; C) and monocyte chemotactic protein-5 (MCP-5; D) were increased in HET mice, compared with WT mice. Black triangles indicate WT and the white triangles indicate HET. Values are means ± SE, n = 9–18/group/time point. *P < 0.05 vs. day 0 WT control; ΦP < 0.05 vs. day 0 HET control; #P < 0.05 vs. WT for respective time point.
Reduced BDNF delayed post-MI neutrophil infiltration into the infarct region.
Neutrophil infiltration is a primary early response in post-MI wound healing (19). As expected from plasma MPO and MMP-9 levels, post-MI neutrophil infiltration was robust in the WT infarct area, peaking at days 1–3 (Fig. 5, A and B). The rate of neutrophil infiltration in HET mice was significantly impaired at day 1 but caught up to WT levels by day 3 post-MI. Of interest, neutrophils were essentially cleared from the infarct area by day 7 post-MI in the HET mice, whereas a small number of neutrophils persisted in the WT mice. The neutrophil is the major source of MPO and MMP-9 early post-MI, and the delayed infiltration of neutrophils in the infarcted area of HET mice is consistent with the reduced plasma MMP-9 and MPO levels observed in the plasma. Reduced levels of BDNF, therefore, delayed the initial neutrophil infiltration but stimulated an earlier clearance of neutrophils.
Fig. 5.
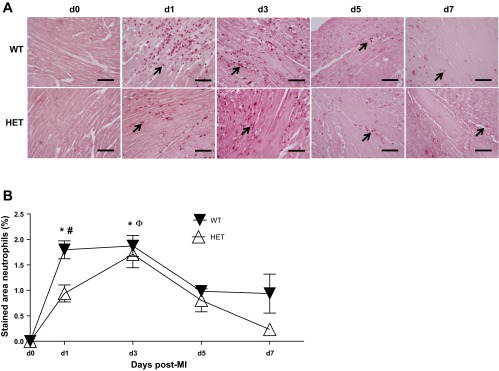
Post-MI, early neutrophil infiltration was delayed in HET mice. A: representative images of neutrophil-stained sections from day 0 (control) and days 1, 3, 5, and 7 post-MI. Arrows show positive-stained cells. B: quantification of neutrophils (%stained area) in the LV infarcted area. Post-MI, HET mice showed delayed neutrophil infiltration. Values are means ± SE, n = 5–7/group/day time point; scale bar = 100 μm. *P < 0.05 vs. day 0 WT control; ΦP < 0.05 vs. day 0 HET control; #P < 0.05 vs. WT for respective time point.
Reduced BDNF increased post-MI macrophage infiltration into the infarct region.
Neutrophil infiltration is followed by macrophage entry into the infarcted area, which serves to engulf necrotic myocytes and apoptotic neutrophils (18). In WT mice, macrophages infiltrated into the LV at days 3–7 post-MI, with a peak in infiltration rates seen at day 5 post-MI (Fig. 6, A and B). The HET mice showed a similar kinetic time pattern, but peak macrophage numbers were higher at day 5 compared with WT. By day 28 post-MI, macrophages were effectively cleared from the infarcted area of both WT and HET mice. The increased infiltration of macrophages at day 5 in the HET mice is consistent with the increased plasma levels of MCP-1 and -5 at day 1 post-MI.
Fig. 6.

Macrophage infiltration was higher in HET mice at day 5 post-MI. A: representative images of macrophage-stained sections at days 0, 3, 5, and 7 post-MI. Arrows show positive-stained cells. B: quantification of macrophage infiltration (%stained area) in the infarcted regions. At day 5 post-MI, the HET mice showed enhanced macrophage infiltration. Values are means ± SE, n = 3–7/group/day time point; scale bar = 100 μm. *P < 0.05 vs. day 0 WT control; ΦP < 0.05 vs. day 0 HET control; #P < 0.05 vs. WT for respective time point.
Reduced BDNF promoted the expression of macrophage recruitment factors in the post-MI LV.
Optimal post-MI wound healing requires the coordinated biphasic inflammatory response comprised primarily of neutrophil and macrophage infiltration (19, 33). Post-MI, 24 out of the 84 inflammatory genes examined were modified, as shown in the venn diagrams (Fig. 7).
Fig. 7.
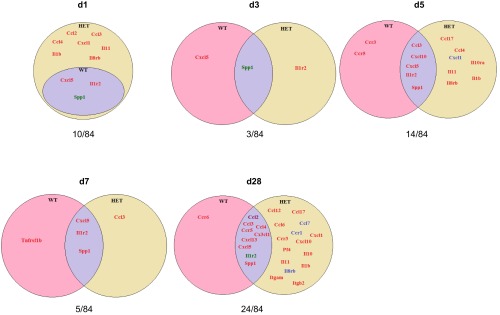
Venn diagrams showing post-MI inflammatory gene expression in WT and HET infarcted [infarct region of LV (LVI)] regions. All post-MI time points gene expression are normalized to day 0 control. Out of 84 genes examined, 24 genes changed. Red, increased gene expression at the respective day; blue, reduced gene expression at the respective day; purple, increased gene expression in both WT and HET and reduced gene expression in both WT and HET; brown, increased gene expression in WT and reduced in HET; green, reduced gene expression in WT and increased in HET. The overall result indicates divergent early and late inflammatory response in WT LVI and HET LVI.
At day 1 post-MI, the WT LVI showed increased Cxcl5 expression, consistent with stimulated neutrophil recruitment in the infarct region. Interestingly, the day 1 HET LVI showed enhanced expression of several additional factors, including Ccl2, Ccl3, Ccl4, Cxcl1, Il1b, Il11, and Il8rb, compared with both day 1 WT and day 0 HET controls. The enhanced expression of Ccl2, Ccl3, Ccl4, and Cxcl1 would stimulate an earlier recruitment of monocytes and explain the increased numbers of macrophages at day 5 in the HET LVI. As shown in the Venn diagram at day 5 post-MI, WT LVI showed increased levels of two inflammatory genes compared with day 0 controls, and these genes were Ccr3 and Ccr5 (Fig. 7). In contrast, the HET LVI showed higher expression of Ccl4, Ccl17, Il11, Il1b, and Il8rb, as well as lower expression of Cxcl1. Decreased Cxcl levels in the HET LVI suggest a feedback loop to lower macrophage influx, and higher Ccl17 levels promote the resolution of inflammation (Fig. 7). This divergent inflammatory gene expression in the HET LVI is consistent with the reduced neutrophil influx, higher macrophage recruitment, and reduction in plasma inflammatory analytes such as MCP-1 and MCP-5 seen at day 1 post-MI.
At day 28 post-MI, inflammatory gene expression in the WT LVI returned to baseline for the most part, with only Ccr6 showing increased levels compared with day 0 WT controls. In the HET LVI, however, several inflammatory genes were elevated compared with day 0 HET and day 28 WT LVI controls, including Ccl6, Ccl12, Ccl17,Ccr3, Cxcl1, Cxcl10, Pf4, Il10, Il11, Il1b, and Itgam, whereas Ccl7, Ccr1 and Il8rb were lower in the day 28 HET LVI compared with day 28 WT LVI.
Reduced BDNF decreases post-MI neovascularization.
To evaluate whether BDNF alters the angiogenic response post-MI, histological sections were stained with Griffonia simplicifolia lectin-1 (GSL-1) to detect blood vessel density. When compared with WT, the HET LVs showed an almost 50% reduction in vessel density at day 0 (Fig. 8, A and B). In response to MI, vessel density decreased in the remote region of the WT LV compared with day 0 controls, with levels falling toward what were seen in the HET. In contrast, vessel densities increased in the WT infarct regions post-MI. At days 7 and 28 post-MI, vessel densities in the infarct region were significantly lower in HET mice compared with WT counterparts (Fig. 8, C and D; P < 0.05). At day 1 post-MI, VEGF-A levels in the plasma were elevated in WT mice and remained elevated through day 28 post-MI. At all time points, VEGF-A levels were consistently lower in the plasma of the HET mice. Thus reduced blood vessel density and plasma VEGF-A levels in HET mice indicate an angiogenic role of BDNF.
Fig. 8.
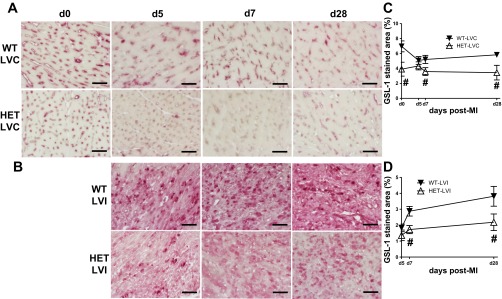
HET mice have lower vessel density that results into reduced neovascularization in the noninfarcted and infarct area at days 7 and 28 post-MI. A: LV sections were stained with Griffonia (Bandeiraea) simplicifolia lectin-I (GSL-I). Representative images for day 0 control, remote region of LV (LVC; A) and LVI (B) at days 5, 7, and 28 post-MI are shown. HET mice had reduced vessel density at baseline and post-MI at day 7 and 28 in LVC; also, the vessel density was reduced in HET LVI compared with WT LVI at days 7 and 28 post-MI. Quantification of the GSL-1 staining (%area) for LVC (C) and LVI (D). Values are means ± SE; scale =100 μm; n = 5/group/day time point. #P < 0.05 vs. WT for respective time point.
Reduced BDNF results in reduced active MMP-9 in the LV infarct region.
Infiltrating neutrophils are a major source of MMP-9 (28). At day 1 post-MI, MMP-9 levels were elevated in the infarct region of WT mice, and this increase was attenuated in the HET mice (Fig. 9, A and B). These results indicate that reduced BDNF levels likely reduce MMP-9 levels at day 1 post-MI by delaying neutrophil infiltration.
Fig. 9.

Post-MI, MMP-9 is reduced in the infarcted area of HET mice. Immunoblot (A) and densitometry (B) values of MMP-9 are shown, normalized to the densitometry of the total protein in the lane. Values are normalized means ± SE, n = 4/group. *P < 0.05 vs. WT and HET day 0; #P < 0.05 vs. WT day 1.
MPO administration partially rescued the BDNF HET phenotype by increasing VEGF-A and reducing vascular endothelial cell adhesion molecule-1 levels.
Because the HET mice showed reduced MPO expression levels at day 1 post-MI, we evaluated whether exogenous MPO administration could rescue the BDNF phenotype. We administered MPO (1 mg/kg ip) to the HET mice at 3-h post-MI. As expected, MPO injection in the HET mice increased MPO levels (Fig. 10D), indicating that the MPO injected at 3 h was still present at day 1 post-MI. Exogenous MPO administration did not stimulate neutrophil infiltration into the infarct area, as neutrophil numbers remained significantly lower than WT levels at day 1 post-MI (Fig. 10, A and B). Administration of MPO also did not increase MMP-9 levels or lower MCP-1 and MCP-5 levels (Fig. 10C). MPO administration, however, increased VEGF-A and reduced vascular endothelial cell adhesion molecule-1 (Fig. 10, E and F). Additionally, there was no significant difference in day 1 post-MI LV functional outcomes in WT- and MPO-treated HET mice. These results suggest that BDNF effects on MPO levels serve to primarily affect VEGF-A and vascular endothelial cell adhesion molecule-1, which are important neovascularization factors.
Fig. 10.
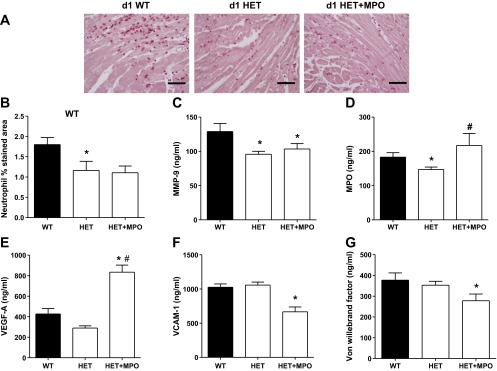
MPO administration stimulated VEGF-A in HET mice without stimulating neutrophil infiltration at day 1 post-MI. MPO (1 mg/kg body wt ip) was given 3 h post-MI to HET mice. A: representative images of neutrophil staining. B: quantification of stained area (in %) in WT, HET, and HET + MPO. Plasma MMP 9 (C), MPO (D), VEGF-A (E), VCAM-1 (F), and Von Willebrand factor (G) levels in response to MPO treatment are shown. Values are means ± SE; scale =100 μm; n = 6/group/day time point. *P < 0.05 vs. WT LVI day 1; #P < 0.05 vs. HET at day 1.
DISCUSSION
BDNF increases in heart failure patients, but whether BDNF has roles in post-MI remodeling has not been explored. The goal of this study, therefore, was to determine whether reduced BDNF levels would modify the LV response to MI. The major findings of this study were that active BDNF is robustly induced post-MI and that reduced BDNF levels 1) improved post-MI survival and attenuated LV remodeling, 2) decreased the inflammatory response by reducing neutrophil infiltration and enhancing macrophage infiltration, and 3) reduced the angiogenic response to MI. The exogenously administered MPO stimulated VEGF-A in the post-MI setting. Together, our findings demonstrate a net negative chemotactic role for BDNF in early post-MI LV remodeling (Fig. 11).
Fig. 11.

Diagrammatic sketch illustrating the role of BDNF in response to MI. BDNF regulates polymorphonuclear neutrophils (PMN) infiltration, which increase MPO and MMP-9 levels. HET mice show improved survival by modulating the early inflammatory response to MI.
This is the first report to document the post-MI time course of BDNF. BDNF is cleaved extracellularly by the serine protease plasmin and by MMP-3 to generate an active mature 14-kDa form (26). Active BDNF elevated in the infarct region significantly at earlier time points examined. This finding is consistent with the previous report by Eriji and colleagues (15), who showed that that macrophages, α-smooth muscle cells, and fibroblasts are major sources of BDNF in the atherosclerotic plaques in humans. The fact that BDNF remained elevated through days 1–5 post-MI indicates that it likely serves chemotactic role in early LV remodeling.
MI induces a robust inflammatory response that involves leukocyte recruitment (18), and reduced BDNF altered several aspects of the inflammatory response. Infiltrating neutrophils are an early source of locally active MMP-9 and MPO, and both of these factors were reduced in the HET mice (3, 28). Following MI, the early induction of Cxcl5 in WT mice may stimulate recruitment of neutrophils and Ly-6Chi monocytes to delay wound healing (11, 34, 42). Macrophage infiltration serves to remove necrotic myocytes and apoptotic neutrophils, a necessary component of the wound healing response. Morimoto and colleagues (31) showed that cardiac overexpression of MCP-1 induced macrophage infiltration and stimulated the accumulation of cardiac myofibroblasts, resulting in the attenuation of LV dysfunction and remodeling post-MI. Reduced BDNF levels increased Ccl2 gene expression at day 1 and enhanced macrophage numbers at day 5 post-MI, indicating the one role of BDNF is to stimulate increased MCP-1 levels. Overall, our results suggest that reduced BDNF levels modify the biphasic inflammatory response by decreasing neutrophil recruitment and increasing macrophage infiltration, which may explain the improved post-MI survival rate. Of note, HET mice showed increased macrophage numbers in the infarcted area compared with WT mice at day 5 post-MI, which suggests a delayed resolution of inflammation in the HET mice. It is possible that reduced BDNF has an early beneficial effect to limit neutrophil infiltration; however, long-term BDNF deletion might contribute to an increase in the proinflammatory response. The overall effect is contextual, depending on the time and presence of specific cell types in the infarcted area.
Neovascularization is a hallmark response of the myocardium to MI (21). BDNF plays dual proangiogenic roles, one through local activation of tropomyosin kinase B receptor expressed on endothelial cells and the other by recruitment of bone marrow-derived cells that contribute to neovascularization (21, 23, 24). Increased VEGF-A in the post-MI WT mice likely impairs vascular integrity, and this increased vascular leakage facilitates infiltration of inflammatory cells that destabilize the granulation tissue during the reparative phase (10). VEGF-A, in combination with BDNF, may provide a mechanism to stimulate endothelial cell survival. MMP-9 degrades extracellular matrix proteins to release bound growth factors, including VEGF-A (4). VEGF-A has been shown to stimulate neutrophils recruitment in response to an inflammatory stimulus (9). The exogenous administration of MPO in HET mice increased plasma VEGF-A levels, without stimulating MMP-9 levels. Indeed, the HET control mice showed 40–50% reduced LV vessel density compared with WT control, which lowers the availability of vessels for the leukocytes to extravasate (18). Moreover, the reduced VEGF-A prevents adhesion of passing neutrophils and transmigration into infarcted area in the early post-MI inflammatory response (18). VEGF-A stimulates neovessel formation within the first hours of MI and stimulates the development of neovessels in the infarct region that are hyperpermeable, proinflammatory, and devoid of a pericyte coat (16, 18, 27). This indicates that reduced BDNF levels may attenuate the angiogenic response by reducing the VEGF-A activation. Therefore, it is likely that BDNF coordinates several aspects of the inflammatory and neovascularization processes in the post-MI setting.
This investigation answers an obvious key question, namely, whether BDNF plays a beneficial or detrimental role in post-MI remodeling. Based on our substantial data on its roles in the inflammatory response, it appears that a reduction in active BDNF levels in the HET mice blunted the early inflammatory response. Simultaneously, VEGF-A levels were also decreased in the early post-MI setting. How a reduction in BDNF decreases vessel density in the post-MI setting to exert a beneficial role remains to be determined. The post-MI maturation of the vascular system may be within the infarcted area positively influenced by the reduced BDNF levels to improve LV function. Regardless of whether additional mechanisms occur, limiting BDNF levels to attenuate the post-MI inflammatory response may prove beneficial in the clinical setting. Although we noticed lower blood vessel density in HET mice, long-term effects of lower BDNF and further consequences on cellular and molecular events in the post-MI setting are areas of active research.
Recent evidence from Okada and colleagues (37) elucidated a post-MI cardioprotective action of BDNF via afferent nerve stimulation increasing neuronal BDNF expression. Deletion of BDNF disrupted high-affinity tyrosine kinase B receptor signaling in the heart. In the post-MI setting, cardiac afferent nerve fibers transmit injury signals from the heart to the central nervous system, which lead to an increase in circulating BDNF. Thus BDNF increases factors that promote the survival of cardiomyocytes and stimulate angiogenesis to reduce cardiac remodeling in hearts examined at 14 days post-MI (37). Katare et al. (22) found a similar phenotype at 14 days post-MI in rats that had been intermittently fasted. Abe et al. (1) also showed a post-MI protective effect of nerve growth factors through sympathetic cardiac innervation. Our study extends these previous reports to examine the early inflammatory response in the setting of reduced BDNF. The prime difference between our results and past reports are that we observed a beneficial role of reducing BDNF levels at this early time point. An additional important difference is that we used 6-9-mo-old adult obese mice, whereas previous studies were performed in very young 3- to 4-mo-old mice (37) and rats (22). Manni and colleagues (30) reported reduced levels of BDNF in acute coronary syndrome patients (n = 31), however, these results did not differentiate between pro and active BDNF forms because of the technological limitation of the ELISA assay and the age of the patients was not disclosed. Both forms of BDNF are essential for neuronal survival, differentiation, and proliferation to maintain homeostasis. Only the mature active BDNF is associated with major depressive disorder. In our study, we measured decreased levels of pro-BDNF and increased levels of active BDNF. In a recent study conducted at the National Institute of Aging, Golden and colleagues (20) showed that elevated circulating BDNF levels in middle-aged and elderly adults (mean age of 70 yr; n = 496) increase the risk of high blood pressure and cardiometabolic dysfunction (20). Therefore, additional research to determine BDNF activity levels in the post-MI setting is warranted.
In summary, the present investigation demonstrated that reduced BDNF levels improve post-MI survival and attenuate LV remodeling by altering the kinetics of leukocyte infiltration as well as the angiogenic response. The beneficial effects of reduced BDNF were partially reversed by MPO infusion. These results suggest that therapeutic options that lower BDNF or MPO levels in the early inflammatory phase may be beneficial for the post-MI patient.
GRANTS
We acknowledge support from National Center for Complementary and Alternative Medicine, National Institutes of Health (NIH) for R00AT006704 (to G. V. Halade), NIH EB009496 and 1SC2 HL101430 (to Y.-F. Jin), and NIH HHSN268201000036C (N01-HV-00244) for the San Antonio Cardiovascular Proteomics Center and R01-HL-075360, and from the Biomedical Laboratory Research and Development Service of the Veterans Affairs Office of Research and Development Award 5I01BX000505 (to M. L. Lindsey).
DISCLOSURES
No conflicts of interest, financial or otherwise, are declared by the author(s).
AUTHOR CONTRIBUTIONS
G.V.H., J.G.H., and M.L.L. conception and design of research; G.V.H., T.A.R., J.Z., Q.D., and O.G. performed experiments; G.V.H., T.A.R., J.Z., Q.D., E.F.L., O.G., Y.-f.J., and M.L.L. analyzed data; G.V.H., Y.M., Y.-f.J., and M.L.L. interpreted results of experiments; G.V.H. prepared figures; G.V.H. and M.L.L. drafted manuscript; G.V.H., Y.-f.J., and M.L.L. edited and revised manuscript; G.V.H. approved final version of manuscript.
REFERENCES
- 1.Abe T, Morgan DA, Gutterman DD. Protective role of nerve growth factor against postischemic dysfunction of sympathetic coronary innervation. Circulation 95: 213–220, 1997 [DOI] [PubMed] [Google Scholar]
- 2.Alroy J, Goyal V, Skutelsky E. Lectin histochemistry of mammalian endothelium. Histochemistry 86: 603–607, 1987 [DOI] [PubMed] [Google Scholar]
- 3.Baldus S, Heeschen C, Meinertz T, Zeiher AM, Eiserich JP, Munzel T, Simoons ML, Hamm CW. Myeloperoxidase serum levels predict risk in patients with acute coronary syndromes. Circulation 108: 1440–1445, 2003 [DOI] [PubMed] [Google Scholar]
- 4.Bergers G, Brekken R, McMahon G, Vu TH, Itoh T, Tamaki K, Tanzawa K, Thorpe P, Itohara S, Werb Z, Hanahan D. Matrix metalloproteinase-9 triggers the angiogenic switch during carcinogenesis. Nat Cell Biol 2: 737–744, 2000 [DOI] [PMC free article] [PubMed] [Google Scholar]
- 5.Cai D, Holm JM, Duignan IJ, Zheng J, Xaymardan M, Chin A, Ballard VL, Bella JN, Edelberg JM. BDNF-mediated enhancement of inflammation and injury in the aging heart. Physiol Genomics 24: 191–197, 2006 [DOI] [PubMed] [Google Scholar]
- 6.Caporali A, Emanueli C. Cardiovascular actions of neurotrophins. Physiol Rev 89: 279–308, 2009 [DOI] [PMC free article] [PubMed] [Google Scholar]
- 7.Cheng Y, Church GM. Biclustering of expression data. Proc Int Conf Intell Syst Mol Biol 8: 93–103, 2000 [PubMed] [Google Scholar]
- 8.Chiao YA, Dai Q, Zhang J, Lin J, Lopez EF, Ahuja SS, Chou YM, Lindsey ML, Jin YF. Multi-analyte profiling reveals matrix metalloproteinase-9 and monocyte chemotactic protein-1 as plasma biomarkers of cardiac aging. Circ Cardiovasc Genet 4: 455–462, 2011 [DOI] [PMC free article] [PubMed] [Google Scholar]
- 9.Christoffersson G, Vagesjo E, Vandooren J, Liden M, Massena S, Reinert RB, Brissova M, Powers AC, Opdenakker G, Phillipson M. VEGF-A recruits a proangiogenic MMP-9-delivering neutrophil subset that induces angiogenesis in transplanted hypoxic tissue. Blood 120: 4653–4662, 2012 [DOI] [PMC free article] [PubMed] [Google Scholar]
- 10.Cursiefen C, Chen L, Borges LP, Jackson D, Cao J, Radziejewski C, D'Amore PA, Dana MR, Wiegand SJ, Streilein JW. VEGF-A stimulates lymphangiogenesis and hemangiogenesis in inflammatory neovascularization via macrophage recruitment. J Clin Invest 113: 1040–1050, 2004 [DOI] [PMC free article] [PubMed] [Google Scholar]
- 11.Dewald O, Zymek P, Winkelmann K, Koerting A, Ren G, Abou-Khamis T, Michael LH, Rollins BJ, Entman ML, Frangogiannis NG. CCL2/monocyte chemoattractant protein-1 regulates inflammatory responses critical to healing myocardial infarcts. Circ Res 96: 881–889, 2005 [DOI] [PubMed] [Google Scholar]
- 12.Donovan MJ, Lin MI, Wiegn P, Ringstedt T, Kraemer R, Hahn R, Wang S, Ibanez CF, Rafii S, Hempstead BL. Brain derived neurotrophic factor is an endothelial cell survival factor required for intramyocardial vessel stabilization. Development 127: 4531–4540, 2000 [DOI] [PubMed] [Google Scholar]
- 13.Drake CJ, Little CD. Exogenous vascular endothelial growth factor induces malformed and hyperfused vessels during embryonic neovascularization. Proc Natl Acad Sci USA 92: 7657–7661, 1995 [DOI] [PMC free article] [PubMed] [Google Scholar]
- 14.Duan W, Guo Z, Jiang H, Ware M, Mattson MP. Reversal of behavioral and metabolic abnormalities, and insulin resistance syndrome, by dietary restriction in mice deficient in brain-derived neurotrophic factor. Endocrinology 144: 2446–2453, 2003 [DOI] [PubMed] [Google Scholar]
- 15.Ejiri J, Inoue N, Kobayashi S, Shiraki R, Otsui K, Honjo T, Takahashi M, Ohashi Y, Ichikawa S, Terashima M, Mori T, Awano K, Shinke T, Shite J, Hirata K, Yokozaki H, Kawashima S, Yokoyama M. Possible role of brain-derived neurotrophic factor in the pathogenesis of coronary artery disease. Circulation 112: 2114–2120, 2005 [DOI] [PubMed] [Google Scholar]
- 16.Ferrara N, Alitalo K. Clinical applications of angiogenic growth factors and their inhibitors. Nat Med 5: 1359–1364, 1999 [DOI] [PubMed] [Google Scholar]
- 17.Fox EA, Byerly MS. A mechanism underlying mature-onset obesity: evidence from the hyperphagic phenotype of brain-derived neurotrophic factor mutants. Am J Physiol Regul Integr Comp Physiol 286: R994–R1004, 2004 [DOI] [PubMed] [Google Scholar]
- 18.Frangogiannis NG. Regulation of the inflammatory response in cardiac repair. Circ Res 110: 159–173, 2012 [DOI] [PMC free article] [PubMed] [Google Scholar]
- 19.Frangogiannis NG, Smith CW, Entman ML. The inflammatory response in myocardial infarction. Cardiovasc Res 53: 31–47, 2002 [DOI] [PubMed] [Google Scholar]
- 20.Golden E, Emiliano A, Maudsley S, Windham BG, Carlson OD, Egan JM, Driscoll I, Ferrucci L, Martin B, Mattson MP. Circulating brain-derived neurotrophic factor and indices of metabolic and cardiovascular health: data from the Baltimore Longitudinal Study of Aging. PLoS One 5: e10099, 2010 [DOI] [PMC free article] [PubMed] [Google Scholar]
- 21.Hoeben A, Landuyt B, Highley MS, Wildiers H, Van Oosterom AT, De Bruijn EA. Vascular endothelial growth factor and angiogenesis. Pharmacol Rev 56: 549–580, 2004 [DOI] [PubMed] [Google Scholar]
- 22.Katare RG, Kakinuma Y, Arikawa M, Yamasaki F, Sato T. Chronic intermittent fasting improves the survival following large myocardial ischemia by activation of BDNF/VEGF/PI3K signaling pathway. J Mol Cell Cardiol 46: 405–412, 2009 [DOI] [PubMed] [Google Scholar]
- 23.Kermani P, Hempstead B. Brain-derived neurotrophic factor: a newly described mediator of angiogenesis. Trends Cardiovasc Med 17: 140–143, 2007 [DOI] [PMC free article] [PubMed] [Google Scholar]
- 24.Kermani P, Rafii D, Jin DK, Whitlock P, Schaffer W, Chiang A, Vincent L, Friedrich M, Shido K, Hackett NR, Crystal RG, Rafii S, Hempstead BL. Neurotrophins promote revascularization by local recruitment of TrkB+ endothelial cells and systemic mobilization of hematopoietic progenitors. J Clin Invest 115: 653–663, 2005 [DOI] [PMC free article] [PubMed] [Google Scholar]
- 25.Kreusser MM, Buss SJ, Krebs J, Kinscherf R, Metz J, Katus HA, Haass M, Backs J. Differential expression of cardiac neurotrophic factors and sympathetic nerve ending abnormalities within the failing heart. J Mol Cell Cardiol 44: 380–387, 2008 [DOI] [PubMed] [Google Scholar]
- 26.Lee R, Kermani P, Teng KK, Hempstead BL. Regulation of cell survival by secreted proneurotrophins. Science 294: 1945–1948, 2001 [DOI] [PubMed] [Google Scholar]
- 27.Li J, Brown LF, Hibberd MG, Grossman JD, Morgan JP, Simons M. VEGF, flk-1, and flt-1 expression in a rat myocardial infarction model of angiogenesis. Am J Physiol Heart Circ Physiol 270: H1803–H1811, 1996 [DOI] [PubMed] [Google Scholar]
- 28.Lindsey M, Wedin K, Brown MD, Keller C, Evans AJ, Smolen J, Burns AR, Rossen RD, Michael L, Entman M. Matrix-dependent mechanism of neutrophil-mediated release and activation of matrix metalloproteinase 9 in myocardial ischemia/reperfusion. Circulation 103: 2181–2187, 2001 [DOI] [PubMed] [Google Scholar]
- 29.Madeira SC, Oliveira AL. Biclustering algorithms for biological data analysis: a survey. IEEE/ACM Trans Comput Biol Bioinform 1: 24–45, 2004 [DOI] [PubMed] [Google Scholar]
- 30.Manni L, Nikolova V, Vyagova D, Chaldakov GN, Aloe L. Reduced plasma levels of NGF and BDNF in patients with acute coronary syndromes. Int J Cardiol 102: 169–171, 2005 [DOI] [PubMed] [Google Scholar]
- 31.Morimoto H, Takahashi M, Izawa A, Ise H, Hongo M, Kolattukudy PE, Ikeda U. Cardiac overexpression of monocyte chemoattractant protein-1 in transgenic mice prevents cardiac dysfunction and remodeling after myocardial infarction. Circ Res 99: 891–899, 2006 [DOI] [PubMed] [Google Scholar]
- 32.Nagahara AH, Tuszynski MH. Potential therapeutic uses of BDNF in neurological and psychiatric disorders. Nat Rev Drug Discov 10: 209–219, 2011 [DOI] [PubMed] [Google Scholar]
- 33.Nahrendorf M, Pittet MJ, Swirski FK. Monocytes: protagonists of infarct inflammation and repair after myocardial infarction. Circulation 121: 2437–2445, 2010 [DOI] [PMC free article] [PubMed] [Google Scholar]
- 34.Nahrendorf M, Swirski FK, Aikawa E, Stangenberg L, Wurdinger T, Figueiredo JL, Libby P, Weissleder R, Pittet MJ. The healing myocardium sequentially mobilizes two monocyte subsets with divergent and complementary functions. J Exp Med 204: 3037–3047, 2007 [DOI] [PMC free article] [PubMed] [Google Scholar]
- 35.Nakahashi T, Fujimura H, Altar CA, Li J, Kambayashi J, Tandon NN, Sun B. Vascular endothelial cells synthesize and secrete brain-derived neurotrophic factor. FEBS Lett 470: 113–117, 2000 [DOI] [PubMed] [Google Scholar]
- 36.Nakamura K, Martin KC, Jackson JK, Beppu K, Woo CW, Thiele CJ. Brain-derived neurotrophic factor activation of TrkB induces vascular endothelial growth factor expression via hypoxia-inducible factor-1alpha in neuroblastoma cells. Cancer Res 66: 4249–4255, 2006 [DOI] [PubMed] [Google Scholar]
- 37.Okada S, Yokoyama M, Toko H, Tateno K, Moriya J, Shimizu I, Nojima A, Ito T, Yoshida Y, Kobayashi Y, Katagiri H, Minamino T, Komuro I. Brain-derived neurotrophic factor protects against cardiac dysfunction after myocardial infarction via a central nervous system-mediated pathway. Arterioscler Thromb Vasc Biol 32: 1902–1909, 2012 [DOI] [PubMed] [Google Scholar]
- 38.Pang PT, Teng HK, Zaitsev E, Woo NT, Sakata K, Zhen S, Teng KK, Yung WH, Hempstead BL, Lu B. Cleavage of proBDNF by tPA/plasmin is essential for long-term hippocampal plasticity. Science 306: 487–491, 2004 [DOI] [PubMed] [Google Scholar]
- 39.Rios M, Fan G, Fekete C, Kelly J, Bates B, Kuehn R, Lechan RM, Jaenisch R. Conditional deletion of brain-derived neurotrophic factor in the postnatal brain leads to obesity and hyperactivity. Mol Endocrinol 15: 1748–1757, 2001 [DOI] [PubMed] [Google Scholar]
- 40.Rosas-Vargas H, Martinez-Ezquerro JD, Bienvenu T. Brain-derived neurotrophic factor, food intake regulation, and obesity. Arch Med Res 42: 482–494, 2011 [DOI] [PubMed] [Google Scholar]
- 41.Tinsley FC, Taicher GZ, Heiman ML. Evaluation of a quantitative magnetic resonance method for mouse whole body composition analysis. Obes Res 12: 150–160, 2004 [DOI] [PubMed] [Google Scholar]
- 42.Turner NA, Das A, O'Regan DJ, Ball SG, Porter KE. Human cardiac fibroblasts express ICAM-1, E-selectin and CXC chemokines in response to proinflammatory cytokine stimulation. Int J Biochem Cell Biol 43: 1450–1458, 2011 [DOI] [PubMed] [Google Scholar]
- 43.Xia Y, Frangogiannis NG. MCP-1/CCL2 as a therapeutic target in myocardial infarction and ischemic cardiomyopathy. Inflamm Allergy Drug Targets 6: 101–107, 2007 [DOI] [PubMed] [Google Scholar]
- 44.Zamilpa R, Lopez EF, Chiao YA, Dai Q, Escobar GP, Hakala K, Weintraub ST, Lindsey ML. Proteomic analysis identifies in vivo candidate matrix metalloproteinase-9 substrates in the left ventricle post-myocardial infarction. Proteomics 10: 2214–2223, 2010 [DOI] [PMC free article] [PubMed] [Google Scholar]
- 45.Zhao T, Zhao W, Chen Y, Ahokas RA, Sun Y. Vascular endothelial growth factor (VEGF)-A: role on cardiac angiogenesis following myocardial infarction. Microvasc Res 80: 188–194, 2010 [DOI] [PMC free article] [PubMed] [Google Scholar]