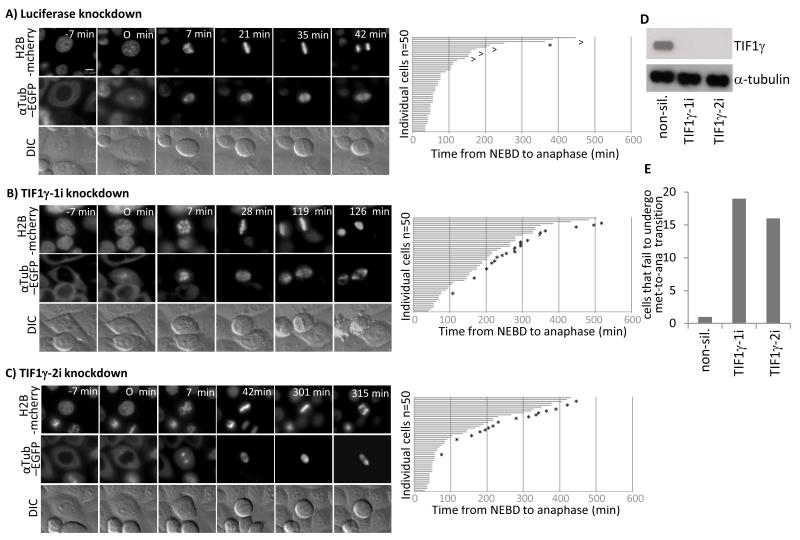
Figure 4. TIF1γ knockdown delays progression through mitosis from NEBD to anaphase.
HeLa cells expressing Histone H2B mCherry and α-tubulin-EGFP were treated with either an siRNA specific for luciferase or siRNAs specific for TIF1γ 48h post-knockdown cells were subjected to a thymidine block for 16 h, whereupon cells were released back into cycle and video imaging began 9 h later. Video images representative of treatments with (A) luciferase siRNA (B) TIF1γ-1i siRNA and (C) TIF1γ-2i siRNA are presented. Corresponding bar charts illustrating the time taken for cells to progress from NEBD to anaphase are also presented. ^ represents cells that failed to exit mitosis during filming. * represents cells that failed to undergo successful metaphase-to-anaphase transition during filming (depicted in Fig. 4E). DIC and immunofluorescent imaging revealed that those cells that failed to undergo metaphase-to-anaphase transition were characterized at late times by plasma membrane blebbing, compacted chromatin and aberrant mitotic spindle formation. Video imaging was therefore terminated at this time, and the time taken from NEBD to this point was recorded. The mean values calculated for time taken from NEBD to anaphase are therefore, underestimated for those cells that failed to undergo metaphase-to-anaphase transition. (D) Western blot for TIF1γ and α-tubulin in cells treated with luciferase siRNA, TIF1γ-1i or TIF1γ-2i siRNAs.

