

Abstract
Knowledge of miRNA expression and function in specific cell types in solid organs is limited because of difficulty in obtaining appropriate specimens. We used laser capture microdissection to obtain nine tissue regions from rats, including the nucleus of the solitary tract, hypoglossal motor nucleus, ventral respiratory column/pre-Bötzinger complex, and midline raphe nucleus from the brain stem, myocardium and coronary artery from the heart, and glomerulus, proximal convoluted tubule, and medullary thick ascending limb from the kidney. Each tissue region consists of or is enriched for a specific cell type. Differential patterns of miRNA expression obtained by deep sequencing of minute amounts of laser-captured cells were highly consistent with data obtained from real-time PCR analysis. miRNA expression patterns correctly clustered the specimens by tissue regions and then by primary tissue types (neural, muscular, or epithelial). The aggregate difference in miRNA profiles between tissue regions that contained the same primary tissue type was as large as one-half of the aggregate difference between primary tissue types. miRNAs differentially expressed between primary tissue types are more likely to be abundant miRNAs, while miRNAs differentially expressed between tissue regions containing the same primary tissue type were distributed evenly across the abundance spectrum. The tissue type-enriched miRNAs were more likely to target genes enriched for specific functional categories compared with either cell type-enriched miRNAs or randomly selected miRNAs. These data indicate that the role of miRNAs in determining characteristics of primary tissue types may be different than their role in regulating cell type-specific functions in solid organs.
Keywords: microRNA, sequencing, gene expression, brain, kidney
several hundred cell types can be found in a mammalian organism. These cell types form four primary tissue types: neural, muscular, epithelial, and connective. A solid organ typically contains a large number of distinct cell types and a full representation of all four primary tissue types. microRNAs (miRNAs) regulate a wide variety of cellular functions. It would be important to understand the role that miRNAs play in the regulation or maintenance of physiological characteristics of various cell types and primary tissue types in solid organs.
Genome-wide or near genome-wide miRNA expression profiles have been compared between whole organs, partial organs, cell types that can be readily separated (such as blood cells), and cultured cells (1, 3, 13, 14, 16, 17, 19, 22, 25). These studies support an important role of miRNAs in the regulation or maintenance of mRNA expression and other biological characteristics of organs and cell types (24).
miRNA profile data, however, are much more scarce for specific cell types or tissue types in solid organs. This may be in part because it is difficult to obtain from solid organs sufficient specimens enriched for a specific cell type. Cellular localization of miRNAs in solid organs is typically analyzed by in situ hybridization, which can only be used to analyze a small number of miRNAs and has limited ability to quantify miRNA abundance. The scarcity of miRNA data in specific cell and tissue types in solid organs creates a significant knowledge gap.
A small number of studies have attempted to obtain genome-wide or near genome-wide miRNA expression data from specific cell types in solid organs. He et al. (7) identified argonaute 2-interacting miRNAs in glutamatergic and GABAergic neurons and subtypes of GABAergic neurons in mouse neocortex and cerebellum. The cell type specificity was achieved by placing argonaute 2 in a fusion gene construct activated by cell type-specific Cre recombinase. Mladinov et al. (20) used manual microdissection to isolate proximal convoluted tubules and medullary thick ascending limbs, two physiologically distinct epithelial cell types in the kidney, and analyzed >100 miRNAs by real-time PCR. They concluded that miRNAs contribute to maintaining subtle yet physiologically crucial differences in cell type characteristics. These studies support the idea of there being important roles of miRNAs in cell type-specific regulatory networks and highlight the value of identifying miRNA profiles in specific cell and tissue types in solid organs.
In the present study, we utilized laser-capture microdissection to obtain nine tissue regions from three rat organs. Each tissue region contained or was enriched for a specific cell type. Three primary tissue types (neural, muscular, and epithelial) were selectively represented in the nine tissue regions. Deep sequencing analysis of miRNA expression revealed distinct characteristics of miRNAs differentially expressed between similar cell types compared with those differentially expressed between primary tissue types.
METHODS
Tissue preparation.
The study was approved by Institutional Animal Care and Use Committee. Six 8 wk old male Sprague-Dawley rats (Harlan) were anesthetized and killed, and heart, kidney, and brain tissues were rapidly removed (<4 min). Heart tissues were cut in cross section, midpapillary. Kidney tissues were hemisected coronally along the renal papilla. Tissue halves were mounted in cryomolds filled with O.C.T. compound (Tissue-Tek), with the cut surface down. Brain tissues were coated in O.C.T. All tissues were flash-frozen in 2-methylbutane in dry ice and stored at −80°C. Prior to sectioning, frozen tissues were brought from −80 to −20°C overnight.
MembraneSlides 0.17 PEN (Carl Zeiss Microscopy) were treated with UV light at 254 nm for 30 min before being used to collect tissue sections. Heart and kidney tissues were sectioned onto the slides at 10 μm beginning at their cut surface. Brain tissues were cryosectioned (25 μm) coronally onto the slides. Tissue sections were gently dried onto the slides with compressed air. Kidney and heart tissues were rehydrated in 70% ethanol for 2 min and double-distilled (dd) H2O for 30 s and contrast-stained in eosin (Sigma) for 10 s. Brain sections underwent rehydration (70% ethanol for 2 min followed by 5 min ddH2O), staining with cresyl violet (filtered 2% working solution) for 5 min to visualize brain-stem nuclei, and a 1 min wash in ddH2O. After respective staining protocols, tissues were rapidly dehydrated in an ethanol gradient (1 min in 70, 96, and 100% ethanol) and dried with compressed air. Sections were allowed to air dry at least an additional 30 min prior to laser capture.
Laser-capture microdissection.
Laser capture of specified structures was performed with a Zeiss P.A.L.M. Microbeam III laser-capture microdissection system (Carl Zeiss Microscopy) housed at the Children's Research Institute Imaging Core. Cut regions were captured on the adhesive caps of 200 μl AdhesiveCap tubes (Carl Zeiss Microscopy). Approximately 225,000–450,000 μm2 of tissue was collected from each biological sample for the tissue regions described below and in Fig. 1, unless otherwise stated. Renal structures collected included glomeruli, proximal convoluted tubules, and medullary thick ascending limb (Fig. 1A). Cardiac structures collected included left ventricle coronary arteries and myocardial regions devoid of arteries or veins (Fig. 1B). A total of four brain-stem regions were collected by laser capture (Fig. 1C). The nucleus of the solitary tract was collected bilaterally from obex (bregma −13.3 mm) to +0.5 mm using a 0.25 × 0.5 mm rectangular capture region. The hypoglossal motor nucleus was collected bilaterally from obex to +0.5 mm using a 0.25 × 0.5 mm rectangular capture region beginning at 0.2 mm below the floor of the 4th ventricle and 0.2 mm lateral to the midline. The ventral respiratory column including but not limited to the pre-Bötzinger complex was collected bilaterally from 0.5 to 1.0 mm rostral to obex using a 0.5 mm diameter circular capture region centered immediately below nucleus ambiguus. The midline raphe was collected using a 0.5 × 0.25 mm rectangular capture region centered on the midline and beginning ∼0.3 mm from the central surface from 1.5 to 2.0 mm rostral to obex, which included raphe pallidus and raphe magnus.
Fig. 1.

Tissue regions (highlighted in colors) collected from the kidney (A), the left ventricle (LV) (B), and brain stem (C) by laser-capture microscopy. PCT, proximal convoluted tubule; mTAL, medullary thick ascending limb; NTS, nucleus of the solitary tract; MN, motor nucleus; VMC, ventral respiratory column; OM, outer medulla.
Small RNA library preparation and sequencing.
Samples were stored at −80°C until the time of RNA extraction. The captured tissues underwent RNA extraction by the TRIzol method (Invitrogen), as previously described (10, 11, 18), and resuspended in 12 μl of nuclease-free water. Total extracted RNA was quantified using 2100 Bioanalyzer and a Pico Chip 6000 kit (Agilent). Equal amounts of RNA from three rats were combined to make two pools of RNA for each tissue region. Small RNA libraries were prepared with the TruSeq Small RNA Sample Preparation Kit from Illumina largely following the vendor's instructions. In brief, 200 pg–2.4 ng of total RNA were ligated with 3′- and 5′-adapters and reverse-transcribed to cDNA by SuperScript II reverse transcriptase. The cDNA was amplified with 19–21 cycles of PCR during which index sequences were incorporated. PCR products that were 140–160 bp long were purified and recovered by 5% TBE polyacrylamide gel and ethanol precipitation. The recovered PCR products were validated and quantified with 2100 Bioanalyzer and DNA 1000 Chip. Cluster generation was done at the Human and Molecular Genetics Center Sequencing Core using TruSeq PE Cluster Kit v3-cBot-HS (Illumina), and sequencing was performed on an Illumina HiSeq 2000 using TruSeq SBS kit v3-HS.
miRNA real-time PCR.
miRNA real-time PCR was carried out with Taqman Chemistry as we described previously (11, 18, 20). We used online tools available at Invitrogen to design primers for a newly identified miRNA. RNU6B was used as internal normalizer.
Analysis of small RNA deep sequencing data.
We developed an in-house analytical pipeline to analyze small RNA deep sequencing data. Raw sequencing reads were trimmed (base quality <13) and mapped against miRBase v17 (9) to identify known miRNAs using Bowtie, including rat miRNAs and homologs of miRNAs known in species other than the rat (15). Sequence reads that did not map to miRBase were then mapped against mRNA database, Rfam (for other noncoding RNA), and RepBase (for repetitive elements) to remove reads corresponding to transcribed sequences that were not miRNAs. The remaining reads were used to predict new miRNAs with miRanalyzer (6). miRanalyzer employs a machine learning approach based on the random forest method. With the default parameter setting, miRanalyzer can obtain the area under the curve value of 97.9% with a true positive rate of 0.79 and a false positive rate of 0.007 for predicting new mammalian miRNAs. To normalize and test differential expression, we used number of reads of known and newly identified miRNAs as input for the Bioconductor DESeq package (2). DESeq uses a negative binomial distribution to model reads of miRNAs and to test for differential expression in deep sequencing datasets. The Benjamini-Hochberg method was used to control false discovery rate (FDR) in all statistical tests (4). The heatmap was created using the R function “heatmap” with default parameter setting. Specifically, 1-r was used for measuring the column distance where r was the Pearson correlation between samples. miRNA expression was normalized by total mapped reads in each sample to generate the heatmap.
Analysis of predicted target genes of miRNAs.
miRNA targets were predicted using TargetScan (http://www.targetscan.org/). We chose target genes with conserved miRNA target sites and having context+ score <−0.1. The context+ score for a specific site is calculated as the sum of the contribution of six features including site-type, 3′-pairing, local AU, position, target site abundance, and seed-pairing stability (5). Predicted target genes were then analyzed for functional term enrichment with the program DAVID (http://david.abcc.ncifcrf.gov/) (8). Fisher exact test was used to examine the significance of enrichment of gene annotation terms. The Benjamini-Hochberg method was used to control FDR in multiple comparisons.
RESULTS AND DISCUSSION
Cell and tissue type characteristics of the tissue regions analyzed.
Nine tissue regions were collected from each of six Sprague-Dawley rats by laser-capture microdissection as depicted in Fig. 1. Laser-capture microdissection is a powerful tool for obtaining specific cell or tissue regions from solid organs. The technique in conjunction with real-time PCR or microarray has been used to analyze miRNAs in pathological samples or different cellular compartments (12, 23). Other techniques for isolating a specific cell population from solid organs include cell sorting and manual microdissection. Each technique has its advantages and disadvantages. Cell sorting relies on native or experimentally introduced markers that are expressed in a cell type-specific manner. It has the potential of producing a homogenous cell population. However, it would only work for cell types for which a highly specific marker protein, and, in the case of antibody-based sorting, a highly specific antibody were available. Moreover, cells in solid organs would have to be dissociated by enzymatic digestion and sorted, stressful processes that could alter molecular profiles in the isolated cells. Manual microdissection of nonsectioned tissues allows isolation of intact cells. But it works only for cells that can be visually identified under a dissecting microscope. Manual microdissection often requires enzymatic digestion as well. Laser-capture microdissection works well for cell types showing clear spatial enrichment in a tissue section, allows fast cooling of tissues, and does not require any enzymatic digestion of the tissue.
The cell type and tissue type characteristics of the tissue regions collected are summarized in Table 1. The nine tissue regions collectively were enriched for three of the four primary tissue types. Each tissue region consists of, or is enriched for, one cell type. Specifically, the four regions collected from the brain stem contain primarily neural tissue. Each of these four regions is enriched for a specific type of neurons. Coronary arteries and myocardium devoid of arteries or veins contain primarily muscular tissue and are enriched for smooth muscle cells and cardiomyocytes, respectively. Glomeruli contain primarily vascular endothelium, which is a special type of epithelial tissue. proximal convoluted tubules and medullary thick ascending limbs contain only epithelial tissue and consist of a single cell type each.
Table 1.
Cell type and tissue type characteristics of the tissue regions analyzed
| Tissue Region | Organ | Primary Cell Type | Other Cell Types | Primary Tissue Type | Other Tissue Types |
|---|---|---|---|---|---|
| NTS | brain stem | glutamatetergic/GABAergic neurons | catecholaminergic/nitric oxide synthase expressing neurons, nonneuronal cells | neural | connective, epithelial |
| Motor | brain stem | motor neurons | interneurons, nonneuronal cells | neural | connective, epithelial |
| Ventral respiratory column/PBC | brain stem | glutamatergic/GABAergic (premotor and motor neurons) | somatostatinergic neurons, nonneuronal cells | neural | connective, epithelial |
| Raphe | brain stem | serotonergic neurons | cholinergic neurons, nonneuronal cells | neural | connective, epithelial |
| Cardiac | heart | cardiomyocyte | fibroblast, endothelial cell | muscular | connective, epithelial |
| Coronary | heart | smooth muscle cell | endothelial cell, fibroblast | muscular | epithelial, connective |
| Glom | kidney | endothelial cell | mesangial cell, podocyte | epithelial | connective |
| PCT | kidney | proximal tubule cell | epithelial | ||
| mTAL | kidney | mTAL cell | epithelial |
NTS, nucleus of the solitary tract; motor, hypoglossal motor nucleus; PBC, ventral respiratory column including the pre-Bötzinger complex; raphe, midline raphe nucleus; cardiac, myocardium; coronary, coronary artery; glom, glomerulus; PCT, proximal convoluted tubule; mTAL, medullary thick ascending limb.
While miRNA expression profiles have been examined in numerous studies, the samples included in the present study were unique in that they were enriched for specific cell types, were obtained from in vivo solid organs, and selectively represented three of the four primary tissue types.
Reliability of deep sequencing data obtained from laser-captured samples.
We carried out small RNA deep sequencing in each of the nine tissue regions collected. The preparation and sequencing output for each library are summarized in Table 2, and the complete sequencing result was provided in the Supplemental Dataset.1 As expected, the amount of total RNA obtained from each specimen was in the picogram to low nanogram range (Table 2). The number of PCR amplification cycles was adjusted slightly (19 to 21 cycles) for each RNA sample to generate amplicon material for deep sequencing. Two approaches were taken to confirm that the miRNA profiles obtained from the minute amounts of RNA were reliable.
Table 2.
Preparation and sequencing output of the small RNA libraries
| Sample ID | RNA Used, pg | PCR Cycles | Total Unique Reads | Mapped Unique Reads | Total Reads | Mapped Reads | % Mapped Reads |
|---|---|---|---|---|---|---|---|
| SD-1,2,3 cardiac muscle | 804 | 21 | 1,226,152 | 754,457 | 4,006,394 | 2,459,968 | 61.4 |
| SD-1,2,3 coronary art. | 253 | 21 | 585,286 | 254,472 | 2,301,621 | 1,114,533 | 48.4 |
| SD-1,2,3 Glomeruli | 778 | 21 | 781,028 | 336,350 | 2,882,808 | 1,495,291 | 51.9 |
| SD-1,2,3 motor neurons | 1,584 | 20 | 899,047 | 391,611 | 4,125,814 | 1,976,818 | 47.9 |
| SD-1,2,3 mTAL | 1,242 | 20 | 693,747 | 387,164 | 2,001,318 | 1,120,863 | 56.0 |
| SD-1,2,3 NTS | 2,165 | 19 | 648,343 | 285,069 | 2,192,208 | 1,045,875 | 47.7 |
| SD-1,2,3 PBC | 1,523 | 20 | 786,203 | 347,686 | 3,026,431 | 1,463,181 | 48.3 |
| SD-1,2,3 PCT | 2,427 | 19 | 710,934 | 319,035 | 2,499,110 | 1,201,937 | 48.1 |
| SD-1,2,3 raphe | 1,409 | 20 | 789,088 | 334,718 | 2,951,797 | 1,378,774 | 46.7 |
| SD-4,5,6 cardiac muscle | 495 | 21 | 1,291,628 | 816,024 | 4,220,853 | 2,657,804 | 63.0 |
| SD-4,5,6 coronary art. | 603 | 21 | 768,816 | 326,119 | 2,757,642 | 1,302,535 | 47.2 |
| SD-4,5,6 glomeruli | 1,272 | 20 | 769,608 | 328,739 | 3,623,300 | 1,688,898 | 46.6 |
| SD-4,5,6 motor neurons | 761 | 21 | 567,616 | 251,110 | 1,946,549 | 962,678 | 49.5 |
| SD-4,5,6 mTAL | 2,110 | 19 | 1,017,645 | 569,339 | 3,182,099 | 1,732,774 | 54.5 |
| SD-4,5,6 NTS | 1,212 | 20 | 839,085 | 364,717 | 3,491,454 | 1,640,938 | 47.0 |
| SD-4,5,6 PBC | 1,710 | 20 | 722,936 | 317,117 | 2,454,720 | 1,156,330 | 47.1 |
| SD-4,5,6 PCT | 1,485 | 20 | 773,456 | 353,786 | 3,240,590 | 1,538,509 | 47.5 |
| SD-4,5,6 raphe | 572 | 21 | 859,367 | 362,616 | 3,684,170 | 1,723,481 | 46.8 |
SD-1,2,3 and SD-4,5,6 referred to libraries prepared from RNA pooled from rats #1, 2, 3, and #4, 5, 6, respectively.
First, the miRNA profile data obtained from laser-captured glomeruli, proximal convoluted tubules, and medullary thick ascending limbs were compared with real-time PCR data obtained in a previous study of manually microdissected tissues (20). Hand-dissection requires enzymatic digestion of the tissue but yielded a larger amount of tissue than laser capture. For 34 miRNAs for which data were available in both studies, glomeruli-proximal convoluted tubule ratios were highly consistent between the two studies (r = 0.91, Fig. 2A). Similarly, high consistency between the two studies was found for proximal convoluted tubule-medullary thick ascending limb ratios for 31 miRNAs for which data were available (r = 0.92, Fig. 2B). Abundance levels in each tissue region, however, were not highly correlated between the two studies (79 miRNAs, r = 0.16 for glomeruli, r = 0.36 for proximal tubules, r = 0.38 for medullary thick ascending limbs).
Fig. 2.
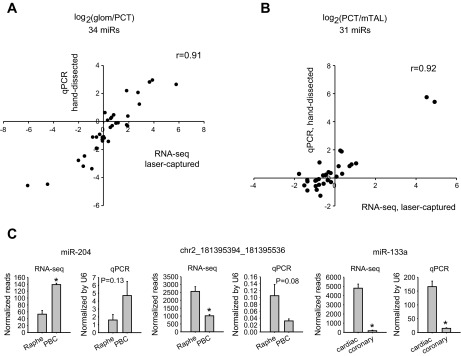
MicroRNA (miRNA, also miR) abundance ratios obtained by deep sequencing of minute amounts of laser-captured specimens were highly consistent with those obtained by real-time PCR analysis of hand-dissected or laser-captured specimens. A: glomeruli-proximal tubule ratios. The segments were hand-dissected. B: proximal tubule-mTAL ratios. The segments were hand-dissected. The real-time PCR (qPCR) data in A and B were taken from Ref. 20. See Ref. 20 for a detailed description of the qPCR experiment. C: additional qPCR validation using individual laser-captured specimens. PBC, pre-Bötzinger complex. N = 6 for qPCR. *P < 0.05 vs. the other tissue in the graph.
In addition, we carried out real-time PCR analysis for miR-204 and a newly identified miRNA, chr2_181395394_181395536, in the pre-Bötzinger complex and the midline raphe and for miR-133a in the cardiac tissue and coronary arteries. Individual laser-captured specimens (n = 6) were analyzed. The real-time PCR result generally confirmed the differential expression identified by deep sequencing (Fig. 2C).
The result suggests that the laser-capture and deep sequencing approach was accurate in detecting relative differences in miRNA abundance between samples. The ability of deep sequencing and real-time PCR to quantify abundance of miRNA within a single sample, however, requires further investigation.
In the second approach to assessing the reliability of the data, the specimens were clustered based on the expression profiles of known miRNAs. The cluster analysis correctly grouped the two biological replicates of each tissue region (Fig. 3). The four specimens from the brain stem (primarily neural tissue), the two from the heart (primarily muscular tissue), and the three from the kidney (primarily epithelial tissue) were then grouped together as expected (Fig. 3). It suggests that cell type- and tissue type-specific miRNA profiles were preserved and detected by the laser-capture and deep sequencing approach.
Fig. 3.

Clustering of tissue regions and miRNAs based on expression profiles of known miRNAs. The heatmap was created using the R function “heatmap” with default parameter setting. Specifically, 1-r was used for measuring the column distance where r was the Pearson correlation between samples. miRNA expression was normalized by total mapped reads in each sample. Colors ranging from dark red to white indicate low to high abundance levels.
Characteristics of miRNAs detectable in the tissue regions.
Approximately 125–190 known miRNAs (279 in total) and 80–130 new miRNAs (193 in total) were identified in each tissue region (Table 3 and Supplemental Dataset). The detected known miRNAs included 188 known rat miRNAs and 91 homologs of known miRNAs in other species in the miRBase database. Overlaps of detectable miRNAs between any two tissue regions ranged from 64.7 to 86.0% (averaging 73.2%) for known miRNAs and 59.3 to 78.7% (averaging 69.6%) for newly identified miRNAs. The % overlap was slightly higher for known miRNAs than newly identified miRNAs in 25 of the 36 pair-wise comparisons (Table 3). It suggests that the newly identified miRNAs might be more likely to be cell type specific, which might be part of the reason why they had not been identified previously. On the other hand, most of the newly identified miRNAs were detected in at least two tissue regions, suggesting they were unlikely to be spurious sequence reads.
Table 3.
Number of detectable miRNAs and overlaps between tissue regions
| Number of overlap | Cardiac | Coronary | Glom | Motor | mTAL | NTS | PBC | PCT | Raphe |
|---|---|---|---|---|---|---|---|---|---|
| Known miRNAs | |||||||||
| Cardiac | 172 | 128 | 141 | 124 | 135 | 124 | 134 | 126 | 122 |
| Coronary | 143 | 130 | 117 | 122 | 112 | 122 | 119 | 116 | |
| Glom | 214 | 132 | 160 | 137 | 145 | 146 | 134 | ||
| Motor | 191 | 121 | 158 | 169 | 120 | 155 | |||
| mTAL | 183 | 126 | 132 | 143 | 122 | ||||
| NTS | 194 | 169 | 120 | 152 | |||||
| PBC | 202 | 128 | 160 | ||||||
| PCT | 165 | 119 | |||||||
| Raphe | 183 | ||||||||
| Newly identified miRNAs | |||||||||
| Cardiac | 148 | 89 | 94 | 80 | 81 | 83 | 88 | 92 | 83 |
| Coronary | 115 | 90 | 82 | 81 | 81 | 87 | 85 | 86 | |
| Glom | 145 | 82 | 89 | 81 | 91 | 100 | 90 | ||
| Motor | 122 | 71 | 90 | 88 | 86 | 91 | |||
| mTAL | 103 | 73 | 82 | 87 | 77 | ||||
| NTS | 114 | 91 | 80 | 91 | |||||
| PBC | 124 | 86 | 89 | ||||||
| PCT | 118 | 87 | |||||||
| Raphe | 122 | ||||||||
| % of overlap, known/new miRNAs | |||||||||
| Cardiac | 1.00 | 1.20 | 1.14 | 1.15 | 1.18 | 1.07 | 1.11 | 1.08 | 1.12 |
| Coronary | 1.00 | 1.05 | 1.01 | 1.01 | 0.94 | 0.97 | 1.06 | 0.98 | |
| Glom | 1.00 | 1.06 | 1.12 | 1.07 | 1.03 | 1.01 | 1.00 | ||
| Motor | 1.00 | 1.03 | 1.08 | 1.20 | 0.94 | 1.11 | |||
| mTAL | 1.00 | 0.99 | 0.95 | 1.04 | 0.97 | ||||
| NTS | 1.00 | 1.12 | 0.97 | 1.05 | |||||
| PBC | 1.00 | 0.98 | 1.15 | ||||||
| PCT | 1.00 | 0.94 | |||||||
| Raphe | 1.00 | ||||||||
See Table 1 for abbreviations. The known/new microRNA (miRNA) ratio for % overlap was calculated as [kC1/2/(kC1 + kC2)]/[nC1/2/(nC1 + nC2)], in which k refers to known miRNAs, n refers to new miRNAs, and C1, C2, and C1/2 refer to the number of miRNAs detected in tissue region 1, 2, and both 1 and 2, respectively. Ratios >1 are shown in italics.
The distribution of miRNA abundance was largely similar in all tissue region, but apparently different for known and newly identified miRNAs. Known miRNAs showed a peak between 3 and 100 reads in the histogram for each tissue regions (Fig. 4A). Compared with known miRNAs, a larger fraction of newly identified miRNAs were detected at fewer than three reads. Some of these low-abundance, new “miRNAs” could be spurious sequence reads or technical noise. On the other hand, some newly identified miRNAs were highly abundant (100–1,000 reads), making the newly identified miRNAs distributed roughly evenly between 10 and 1,000 reads (Fig. 4B). The significance of these highly abundant, new miRNAs remains to be determined.
Fig. 4.

Distribution of miRNAs across the abundance spectrum. A: known miRNAs. B: new miRNAs. miRNA abundance expressed as log(reads + 1) was divided into bins. The number of miRNAs falling into each bin in each tissue region was plotted as frequency. See Table 1 for abbreviations.
We examined differences in overall miRNA profiles between tissue regions. For tissue regions containing the same primary tissue type, we focused on comparisons between the ventral respiratory column/pre-Bötzinger complex and the midline raphe nuclei, both enriched for neurons involved in respiratory control, and the proximal convoluted tubules and medullary thick ascending limbs, both consisting of epithelial cells involved in vectorial transport in the kidney. For comparisons between primary tissue types, we grouped neural specimens, muscular specimens, and epithelial specimens and compared them against each other.
Aggregate difference in miRNA profiles was calculated as the sum of either the absolute differences or the absolute log-transformed ratios (tissue region 1 over tissue region 2) of all miRNAs. The aggregate difference between primary tissue types was approximately twice as large as that between similar cell types (Fig. 5). The larger difference between primary tissue types was consistent with the presence of substantial physiological differences. The difference between muscle tissues and epithelial tissues ranked as the largest according to sum of absolute read differences but a distant second according to sum of absolute log ratios. It suggests the differences between muscle and epithelial tissues might be more likely to involve abundant miRNAs.
Fig. 5.

The aggregate difference between primary tissue types was approximately twice as large as that between tissue regions containing the same primary tissue type. Aggregate difference was calculated as the sum of either the read differences [absolute value of (tissue 1 − tissue 2)] or log ratios [absolute value of log(tissue 1/tissue 2)] for all miRNAs. Read counts were normalized across samples before read differences and ratios were calculated.
It was interesting, however, that the difference in miRNA profiles between similar cell types such as proximal convoluted tubules and medullary thick ascending limbs was as large as about one-half of the difference between dramatically different tissue types such as neural tissue and epithelial tissue. It suggests that miRNAs might play important roles in not only the determination of large developmental or functional differences between primary tissue types but also the determination or maintenance of cell type-specific characteristics that may appear subtle but are physiologically significant. This is consistent with the findings of Mladinov et al. (20) that miRNAs could target and regulate numerous transporters that characterize the proximal convoluted tubule and the medullary thick ascending limb.
Tissue type-enriched miRNAs, but not cell type-enriched miRNAs, were more likely to be abundant miRNAs.
The numbers of miRNAs showing unadjusted P values of < 0.05 in comparisons between primary tissue types were roughly twice as many as in comparisons between similar cell types (Table 4). This is consistent with the aggregate differences shown in Fig. 5. However, it should be noted that the comparisons had different sample sizes (n = 2 for cell-type comparisons and n = 4 to 8 for tissue-type comparisons) and thus different statistical power for detecting significant differences.
Table 4.
Number of miRNAs differentially expressed between cell types or primary tissue types
| n | P < 0.05 | Adjusted P < 0.05 | Adjusted P < 0.05, Known Rat miRNA | |
|---|---|---|---|---|
| Neural vs. epithelial | 8 vs. 6 | 212 | 147 | 82 |
| Muscle vs. neural | 4 vs. 8 | 126 | 57 | 39 |
| Muscle vs. epithelial | 4 vs. 6 | 118 | 18 | 3 |
| PCT vs. mTAL | 2 vs. 2 | 57 | 11 | 5 |
| PBC vs. Raphe | 2 vs. 2 | 69 | 3 | 1 |
miRNAs differentially expressed between muscular and epithelial tissues or between neural and epithelial tissues were significantly more likely to be abundant miRNAs (defined as 200–2,000 reads) than the abundance distribution of all detectable miRNAs (Fig. 6). The abundance distribution of miRNAs differentially expressed between tissue regions containing the same primary tissue type (raphe nuclei vs. pre-Bötzinger complex or proximal tubules vs. medullary thick ascending limbs) was indistinguishable from that of all detectable miRNAs (Fig. 6). High-abundance miRNAs may have a greater chance to suppress their target genes (21). The functional significance of low-abundance miRNAs cannot be dismissed since the functional impact of a miRNA can be affected by additional factors such as miRNA subcellular localization, target mRNA accessibility, and target binding efficiency. Nevertheless, the enrichment of high-abundance miRNAs may suggest an important role of differentially expressed miRNAs in determining or maintaining the unique characteristics of a primary tissue type.
Fig. 6.

miRNAs differentially expressed between primary tissue types are more likely to be abundant miRNAs than miRNAs differentially expressed between tissue regions containing the same primary tissue type. The frequency of miRNAs within each abundance bin was calculated for all miRNAs, miRNAs with unadjusted P < 0.05, and, for tissue type comparisons, miRNAs with adjusted P < 0.05. The number of miRNAs with adjusted P < 0.05 between tissue regions containing the same primary tissue type was too small to analyze. The enrichment of miRNAs with unadjusted P < 0.05 in the 200–2,000 read range, relative to all miRNAs, was then calculated and shown in the last panel. *P < 0.05 vs. 1.
Tissue type-enriched miRNAs were more likely to preferentially target genes in specific functional categories.
We examined characteristics of predicted target genes of differentially expressed miRNAs, focusing on miRNAs that were known in rat and ranked in the top 80% in overall abundance. We first examined miRNAs with adjusted P values < 0.05 (Table 4). Of 908 Gene Ontology biological process terms represented in the predicted targets of miRNAs differentially expressed between neural tissues and epithelial tissues, 412 terms were significantly enriched with Benjamini P values < 0.05. The most significantly enriched terms were related to transcriptional regulation, cell metabolism, and development. Of 805 terms represented in the predicted targets of miRNAs differentially expressed between muscular tissues and neural tissues, 327 terms were significantly enriched. The most significantly enriched terms were related to cell metabolism and transcriptional regulation. Target enrichment analysis was not performed for the other comparisons shown in Table 4 because the number of known rat miRNAs with adjusted P values < 0.05 was fewer than five in these comparisons.
We then examined predicted targets of known rat miRNAs that ranked in the top 10% in the degree of significance of differential expression (Fig. 7). The number of miRNAs analyzed was similar for all comparisons, which allowed us to compare tissue type-enriched and cell type-enriched miRNAs and avoid the implication of different sample sizes. All of the miRNAs analyzed had unadjusted P values < 0.05. In addition, a set of 16 miRNAs was randomly selected for comparison with tissue type- and cell type-enriched miRNAs. The random selection was repeated five times to estimate variations in random selection.
Fig. 7.

Top 10% differentially expressed known rat miRNAs. Log(reads) data were plotted for miRNAs with P values that ranked (smallest on the top) in the top 10% of all known rat miRNAs detectable in the tissues shown in each panel of the figure. All of the miRNAs plotted had unadjusted P values < 0.05.
As shown in Fig. 8A, miRNAs differentially expressed between neural tissues and epithelial tissues or muscular tissues were more likely to target genes that were enriched for specific functional terms compared with random miRNAs. This was observed for the number of enriched functional terms (Benjamini P < 0.05) related to protein properties, protein sequence characteristics, Gene Ontology biological processes, cellular components, or molecular functions, and Kyoto Encyclopedia of Genes and Genomes pathways. The increased likelihood for enrichment was observed for the percentage of enriched functional terms related to protein properties and Gene Ontology biological processes or cellular components. For miRNAs differentially expressed between muscular and epithelial tissues, a greater enrichment of specific functional terms was observed for the number of enriched terms related to protein sequence characteristics and Gene Ontology molecular functions or the percentage of enriched terms related to protein properties. In contrast, the number or percentage of enriched terms in any category was not higher for miRNAs differentially expressed between similar cell types (proximal convoluted tubules vs. medullary thick ascending limbs or raphe nuclei vs. pre-Bötzinger complex) than for randomly selected miRNAs.
Fig. 8.

Target genes of top differentially expressed known rat miRNAs. Predicted target genes of the miRNAs shown in Fig. 7 were analyzed for enrichment of gene annotation terms (A) or cluster of gene annotation terms (B) using DAVID. *Greater or smaller than random miRNAs (median ± 1.5 × interquartile range); #P < 0.05 vs. cell type comparisons (PCT vs. mTAL and PBC vs. Raphe) (Fisher exact test). Clusters with enrichment factor >3 are shown in C. The percentage values shown in C are the same as those shown in the last panel of B. Number in parentheses is the number of clusters sharing the indicated theme.
To reduce the redundancy in functional terms, the term clustering tool in DAVID was used. Similar to the analysis of individual functional terms shown in Fig. 8A, miRNAs differentially expressed between neural and epithelial tissues were more likely to target genes that fell into specific clusters of functional terms than randomly selected miRNAs (Fig. 8B). Moreover, miRNAs differentially expressed between neural and epithelial or muscular tissues were more likely to target genes enriched for specific clusters of functional terms than miRNAs differentially expressed between similar cell types. This was also true for miRNAs differentially expressed between muscular and neural tissues for clusters with enrichment factor >2. The degree of enrichment of functional clusters in target genes of miRNAs differentially expressed between similar cell types was not different than randomly selected miRNAs.
Development, cell signaling, cell metabolism and/or trafficking, and transcriptional regulation were the most consistently enriched functional categories in target genes of miRNAs differentially expressed between tissue types or cell types (Fig. 8C). The enrichment of these categories was most dramatic in genes targeted by miRNAs differentially expressed between neural tissues and epithelial tissues.
We compared predicted target genes of miRNAs differentially expressed between the proximal tubule and the medullary thick ascending limb to mRNAs previously reported as differentially expressed between the two nephron segments (26). Both nephron segments expressed 6,311 genes with official gene symbols. Of these genes, 1,479, or 23%, were expressed differently in the two segments (absolute log2 ratio > 0.5, absolute signal difference > 2). Of 793 genes that were expressed in both nephron segments and predicted to be targeted by miRNAs differentially expressed between the two segments, a slightly larger portion (26% or 205 genes) were expressed differently in the two segments. Genes targeted by the differentially expressed miRNAs were as likely as all genes in general to be expressed in one segment but not the other (18%).
These results indicate that miRNAs differentially expressed between primary tissue types are more likely than other miRNAs to preferentially target genes in certain functional categories. The high degree of enrichment of development related genes suggests that these miRNAs might be particularly important in maintaining the differentiation state of primary tissue types. A recurring theme of genes targeted by miRNAs differentially expressed between tissue or cell types was regulation of transcription. Interestingly, the enrichment of genes involved in transcriptional regulation was not unique to tissue or cell type-specific miRNAs. The enrichment was observed for target genes of randomly selected miRNAs as well. It suggests transcriptional regulation might be a common target pathway for miRNAs in general and that the functional impact of miRNAs could involve extensive secondary effects as miRNAs target genes that regulate the expression of additional genes.
miRNAs differentially expressed between similar cell types may regulate a wider variety of cellular functions and more subtle cellular characteristics in addition to maintaining differentiation states. A functional theme unique to target genes of miRNAs differentially expressed between raphe nuclei and pre-Bötzinger complex was cell adhesion (Fig. 8C), which might be relevant to interactions between neurons and different types of nonneuronal cells in the two brainstem regions. However, cell type-specific miRNAs do not share functional themes as strongly as tissue type-specific miRNAs. It suggests that understanding how miRNAs regulate cell type-specific functions would, in most cases, require analysis of individual miRNAs. An example would be miR-192, which was found enriched in the proximal tubule compared with the medullary thick ascending limb. As we recently reported, miR-192 regulates renal tubular transport and fluid homeostasis, processes that the proximal tubule and the medullary thick ascending limb contribute to via different mechanisms and to different extents (20). It is likely that additional miRNAs are involved in the regulation of vectorial transport of solutes or fluid, which is the primary physiological function of renal tubules. In summary, we have used a uniquely powerful approach combining laser capture microdissection with deep sequencing to analyze miRNA expression in nine tissue regions in rat solid organs, each enriched for a specific cell type and the neural, muscular, or epithelial tissue type. Reliable miRNA expression data were obtained from the minute amounts of material. The aggregate difference in miRNA profiles between tissue regions containing the same primary tissue type was as large as one-half of the aggregate difference between primary tissue types. Compared with miRNAs differentially enriched between tissue regions containing the same primary tissue type, miRNAs differentially expressed between primary tissue types were more likely to be abundant miRNAs and to target genes in specific functional categories. These data indicate that miRNAs may play distinct roles in determining characteristics of primary tissue types and specific cell types in solid organs.
GRANTS
This work was supported by National Heart, Lung, and Blood Institute Grants HL-082798, HL-111580, HL-029587 (M. Liang), and HL-097033 (M. R. Hodges) and Advancing a Healthier Wisconsin Fund Grants FP1701 and FP1703 (P. Liu).
DISCLOSURES
No conflicts of interest, financial or otherwise, are declared by the author(s).
AUTHOR CONTRIBUTIONS
Author contributions: A.J.K., Y.L., M.A.B., and M.R.H. performed experiments; A.J.K., Y.L., P.L., M.A.B., M.R.H., and M.L. interpreted results of experiments; A.J.K., P.L., M.R.H., and M.L. prepared figures; A.J.K., Y.L., P.L., M.A.B., M.R.H., and M.L. edited and revised manuscript; A.J.K., Y.L., P.L., M.A.B., M.R.H., X.H., and M.L. approved final version of manuscript; P.L., M.A.B., X.H., and M.L. analyzed data; M.L. conception and design of research; M.L. drafted manuscript.
Supplementary Material
Footnotes
The online version of this article contains supplemental material.
REFERENCES
- 1.Allantaz F, Cheng DT, Bergauer T, Ravindran P, Rossier MF, Ebeling M, Badi L, Reis B, Bitter H, D'Asaro M, Chiappe A, Sridhar S, Pacheco GD, Burczynski ME, Hochstrasser D, Vonderscher J, Matthes T. Expression profiling of human immune cell subsets identifies miRNA-mRNA regulatory relationships correlated with cell type specific expression. PLoS One 7: e29979, 2012 [DOI] [PMC free article] [PubMed] [Google Scholar]
- 2.Anders S, Huber W. Differential expression analysis for sequence count data. Genome Biol 11: R106, 2010 [DOI] [PMC free article] [PubMed] [Google Scholar]
- 3.Baskerville S, Bartel DP. Microarray profiling of microRNAs reveals frequent coexpression with neighboring miRNAs and host genes. RNA 11: 241–247, 2005 [DOI] [PMC free article] [PubMed] [Google Scholar]
- 4.Benjamini Y, Hochberg Y. Controlling the false discovery rate: a practical and powerful approach to multiple testing. J Royal Stat Soc Ser B Meth 57: 289–300, 1995 [Google Scholar]
- 5.Garcia DM, Baek D, Shin C, Bell GW, Grimson A, Bartel DP. Weak seed-pairing stability and high target-site abundance decrease the proficiency of lsy-6 and other microRNAs. Nat Struct Mol Biol 18: 1139–1146, 2011 [DOI] [PMC free article] [PubMed] [Google Scholar]
- 6.Hackenberg M, Rodríguez-Ezpeleta N, Aransay AM. miRanalyzer: an update on the detection and analysis of microRNAs in high-throughput sequencing experiments. Nucleic Acids Res 39: W132–W138, 2011 [DOI] [PMC free article] [PubMed] [Google Scholar]
- 7.He M, Liu Y, Wang X, Zhang MQ, Hannon GJ, Huang ZJ. Cell-type-based analysis of microRNA profiles in the mouse brain. Neuron 73: 35–48, 2012 [DOI] [PMC free article] [PubMed] [Google Scholar]
- 8.Huang DW, Sherman BT, Lempicki RA. Bioinformatics enrichment tools: paths toward the comprehensive functional analysis of large gene lists. Nucl Acids Res 37: 1–13, 2009 [DOI] [PMC free article] [PubMed] [Google Scholar]
- 9.Kozomara A, Griffiths-Jones S. miRBase: integrating microRNA annotation and deep-sequencing data. Nucl Acids Res 39: D152–D157, 2011 [DOI] [PMC free article] [PubMed] [Google Scholar]
- 10.Kriegel AJ, Fang Y, Liu Y, Tian Z, Mladinov D, Matus IR, Ding X, Greene AS, Liang M. MicroRNA-target pairs in human renal epithelial cells treated with transforming growth factor beta 1: a novel role of miR-382. Nucl Acids Res 38: 8338–8347, 2010 [DOI] [PMC free article] [PubMed] [Google Scholar]
- 11.Kriegel AJ, Liu Y, Cohen B, Usa K, Liu Y, Liang M. MiR-382 targeting of kallikrein 5 contributes to renal inner medullary interstitial fibrosis. Physiol Genomics 44: 259–267, 2012 [DOI] [PMC free article] [PubMed] [Google Scholar]
- 12.Kye MJ, Liu T, Levy SF, Xu NL, Groves BB, Bonneau R, Lao K, Kosik KS. Somatodendritic microRNAs identified by laser capture and multiplex RT-PCR. RNA 13: 1224–1234, 2007 [DOI] [PMC free article] [PubMed] [Google Scholar]
- 13.Ladewig E, Okamura K, Flynt AS, Westholm JO, Lai EC. Discovery of hundreds of mirtrons in mouse and human small RNA data. Genome Res 22: 1634–1645, 2012 [DOI] [PMC free article] [PubMed] [Google Scholar]
- 14.Landgraf P, Rusu M, Sheridan R, Sewer A, Iovino N, Aravin A, Pfeffer S, Rice A, Kamphorst AO, Landthaler M, Lin C, Socci ND, Hermida L, Fulci V, Chiaretti S, Foà R, Schliwka J, Fuchs U, Novosel A, Müller RU, Schermer B, Bissels U, Inman J, Phan Q, Chien M, Weir DB, Choksi R, De Vita G, Frezzetti D, Trompeter HI, Hornung V, Teng G, Hartmann G, Palkovits M, Di Lauro R, Wernet P, Macino G, Rogler CE, Nagle JW, Ju J, Papavasiliou FN, Benzing T, Lichter P, Tam W, Brownstein MJ, Bosio A, Borkhardt A, Russo JJ, Sander C, Zavolan M, Tuschl T. A mammalian microRNA expression atlas based on small RNA library sequencing. Cell 129: 1401–1414, 2007 [DOI] [PMC free article] [PubMed] [Google Scholar]
- 15.Langmead B, Trapnell C, Pop M, Salzberg SL. Ultrafast and memory-efficient alignment of short DNA sequences to the human genome. Genome Biol 10: R25, 2009 [DOI] [PMC free article] [PubMed] [Google Scholar]
- 16.Lee EJ, Baek M, Gusev Y, Brackett DJ, Nuovo GJ, Schmittgen TD. Systematic evaluation of microRNA processing patterns in tissues, cell lines, and tumors. RNA 14: 35–42, 2008 [DOI] [PMC free article] [PubMed] [Google Scholar]
- 17.Liang Y, Ridzon D, Wong L, Chen C. Characterization of microRNA expression profiles in normal human tissues. BMC Genomics 8: 166, 2007 [DOI] [PMC free article] [PubMed] [Google Scholar]
- 18.Liu Y, Taylor NE, Lu L, Usa K, Cowley AW, Jr, Ferreri NR, Yeo NC, Liang M. Renal medullary microRNAs in Dahl salt-sensitive rats: miR-29b regulates several collagens and related genes. Hypertension 55: 974–982, 2010 [DOI] [PMC free article] [PubMed] [Google Scholar]
- 19.McCall MN, Kent OA, Yu J, Fox-Talbot K, Zaiman AL, Halushka MK. MicroRNA profiling of diverse endothelial cell types. BMC Med Genomics 4: 78, 2011 [DOI] [PMC free article] [PubMed] [Google Scholar]
- 20.Mladinov D, Liu Y, Mattson DL, Liang M. MicroRNAs contribute to the maintenance of cell type-specific physiological characteristics: miR-192 targets Na+/K+-ATPase β1. Nucl Acids Res 41: 1273–1283, 2013 [DOI] [PMC free article] [PubMed] [Google Scholar]
- 21.Mullokandov G, Baccarini A, Ruzo A, Jayaprakash AD, Tung N, Israelow B, Evans MJ, Sachidanandam R, Brown BD. High-throughput assessment of microRNA activity and function using microRNA sensor and decoy libraries. Nat Meth 9: 840–846, 2012 [DOI] [PMC free article] [PubMed] [Google Scholar]
- 22.Sempere LF, Freemantle S, Pitha-Rowe I, Moss E, Dmitrovsky E, Ambros V. Expression profiling of mammalian microRNAs uncovers a subset of brain-expressed microRNAs with possible roles in murine and human neuronal differentiation. Genome Biol 5: R13, 2004 [DOI] [PMC free article] [PubMed] [Google Scholar]
- 23.Sengupta S, den Boon JA, Chen IH, Newton MA, Stanhope SA, Cheng YJ, Chen CJ, Hildesheim A, Sugden B, Ahlquist P. MicroRNA 29c is down-regulated in nasopharyngeal carcinomas, up-regulating mRNAs encoding extracellular matrix proteins. Proc Natl Acad Sci USA 105: 5874–5878, 2008 [DOI] [PMC free article] [PubMed] [Google Scholar]
- 24.Sood P, Krek A, Zavolan M, Macino G, Rajewsky N. Cell-type-specific signatures of microRNAs on target mRNA expression. Proc Natl Acad Sci USA 103: 2746–2751, 2006 [DOI] [PMC free article] [PubMed] [Google Scholar]
- 25.Tian Z, Greene AS, Pietrusz JL, Matus IR, Liang M. microRNA-target pairs in rat kidneys identified through microRNA microarray, proteomic, and bioinformatic analysis. Genome Res 18: 404–411, 2008 [DOI] [PMC free article] [PubMed] [Google Scholar]
- 26.Yu MJ, Miller RL, Uawithya P, Rinschen MM, Khositseth S, Braucht DW, Chou CL, Pisitkun T, Nelson RD, Knepper MA. Systems-level analysis of cell-specific AQP2 gene expression in renal collecting duct. Proc Natl Acad Sci USA 106: 2441–2446, 2009 [DOI] [PMC free article] [PubMed] [Google Scholar]
Associated Data
This section collects any data citations, data availability statements, or supplementary materials included in this article.