

Abstract
MiRNAs are post-transcriptional regulators that contribute to the establishment and maintenance of gene expression patterns. Although their biogenesis and decay appear to be under complex control, the implications of miRNA expression dynamics for the processes that they regulate are not well understood. We derived a mathematical model of miRNA-mediated gene regulation, inferred its parameters from experimental data sets, and found that the model describes well time-dependent changes in mRNA, protein and ribosome density levels measured upon miRNA transfection and induction. The inferred parameters indicate that the timescale of miRNA-dependent regulation is slower than initially thought. Delays in miRNA loading into Argonaute proteins and the slow decay of proteins relative to mRNAs can explain the typically small changes in protein levels observed upon miRNA transfection. For miRNAs to regulate protein expression on the timescale of a day, as miRNAs involved in cell-cycle regulation do, accelerated miRNA turnover is necessary.
Keywords: gene expression regulation, kinetics, miRNAs, modeling, protein turnover
Introduction
The cellular abundance of proteins appears to be controlled to a substantial extent at the level of translation (Schwanhäusser et al, 2011). Among post-transcriptional regulators, miRNAs are short, evolutionarily conserved, non-protein-coding RNAs that modulate the rates of both protein translation and mRNA decay (Bartel, 2009; Fabian et al, 2010; Huntzinger and Izaurralde, 2011). MiRNAs guide Argonaute (Ago) proteins to specific elements that are located mostly in the 3′ untranslated regions (UTRs) of mRNAs and are typically complementary to the miRNAs’ ‘seed’ region (7–8 nucleotides at the 5′ end) (Bartel, 2009). They are involved in virtually every cellular process, from early development (Wightman et al, 1993; Kanellopoulou et al, 2005; Song et al, 2011) to organ function, and their perturbed expression has been associated with numerous human diseases, such as diabetes (Trajkovski et al, 2011), cancer (Lu et al, 2005) and viral infection (Pfeffer et al, 2004). Furthermore, miRNAs appear to be able to initiate, on their own, the complex process of reprogramming somatic cells into pluripotent stem cells (Anokye-Danso et al, 2011).
Evidence for context-specific modulation of both miRNA biogenesis (Heo et al, 2009) and decay (Chatterjee and Grosshans, 2009; Krol et al, 2010; Rissland et al, 2011) has started to emerge. Yet, the implications of a flexible modulation of miRNA expression dynamics for the dynamics of the controlled processes remain largely unexplored. Rather, from a kinetic stand point, miRNAs are generally viewed as fast regulators of gene expression, in contrast to transcription factors, whose expression additionally requires protein synthesis (Shimoni et al, 2007; Hobert, 2008). Here, we use a variety of low- and high-throughput data sets to uncover the kinetics of various steps in the miRNA-dependent regulatory cascade. Contrary to the expectation that miRNAs are fast regulators, we find that miRNAs may not be acting as rapidly as commonly assumed due to two bottlenecks, one at the level of miRNA loading into Ago and the other at the level of protein decay. The derived quantitative model enables us to predict the effect of manipulating miRNA expression on mRNA, protein and ribosome density levels, to uncover these effects from experimental data sets and to make predictions about the dynamics of miRNA-dependent gene regulation in various physiological scenarios.
Results
Inference of a kinetic model of miRNA-dependent regulation
A stumbling block for a quantitative description of miRNA-dependent gene regulation is that the parameters of miRNA expression dynamics and of miRNA–target interaction are generally unknown. The fluorescence cross-correlation spectroscopy experiments of Ohrt et al (2008) offer a possible solution. This study measured the fraction of small-interfering RNA (siRNA) in complex with Ago as well as the fraction of Ago in complex with siRNAs, as a function of the time after siRNA micro-injection into cells. Because the siRNA and miRNA pathways share many components, these data allow us to obtain initial estimates of the dynamics of Ago loading, which we can then use to predict the dynamics of miRNA-induced changes in miRNA targets.
Figure 1A illustrates the structure of the Ago-loading model that we constructed. At time t=0, X0 siRNAs are micro-injected into the cytoplasm from where they either decay at a rate d or associate with free Ago at a rate γ=b f0, with b being the rate of binding and f0 the fraction of free Argonaute proteins. Ago-complexed siRNAs dissociate at a rate u. With reasonable assumptions supported by experimental evidence (Khan et al, 2009), namely that the fraction of free Ago f0 is small and that siRNAs load into Ago by competing out endogenous miRNAs, the fraction of Ago proteins loaded with the injected siRNA can be described by a bi-exponential function. This form facilitates the modeling of mRNA and protein dynamics of miRNA targets, as will be described shortly. We obtained maximum-likelihood estimates and confidence intervals on the model parameters γ, d, u, X0 by Markov Chain Monte Carlo (Supplementary Figure S1) and found a good agreement between the data and the model (Figure 1B). Therefore, Ago loading upon small RNA micro-injection can be well approximated by a bi-exponential function.
Figure 1.

The amount of siRNA-loaded Ago following siRNA micro-injection can be modeled by a bi-exponential function. (A) Cartoon illustrating the model parameters: at time t=0, X0 siRNAs are injected into the cell, after which the siRNAs X either decay with rate d or load into a free Ago f0F with rate b to form siRNA-loaded Ago complexes A. Small RNAs dissociate from Ago at rate u. (B) Measured (dots) and fitted (lines) fractions of complexed Ago and complexed siRNAs from the data set of Ohrt et al (2008). Error bars represent the 95% confidence interval on the mean measured fraction of Ago and siRNA in complex. Maximum-likelihood parameter estimates also appear in the figure. γ=bf0 is the Ago–siRNA association rate b normalized to the fraction of free Ago f0. See also Supplementary Figure S1.
Does this model describe well the dynamics of Ago loading upon miRNA transfection? The above model predicts that the peak in Ago loading would be about 10 h after the delivery of the small RNA (Figure 1B). However, the peak in mRNA repression in miRNA transfection experiments, which should occur at the peak of Ago loading with the miRNA, appears to be considerably delayed. For example, in the experiments of Grimson et al (2007) target mRNAs are typically more repressed at 24 h than at 12 h after miRNA transfection (Supplementary Figure S2A). This is likely due to a delayed delivery of transfected miRNAs to the Ago proteins (Broderick and Zamore, 2011; Stalder et al, 2013) compared with the situation in which the small RNAs were directly micro-injected into cells. To investigate the dynamics of miRNA loading into Ago under transfection conditions, we therefore used the fine-grained time series of mRNA expression of Wang and Wang (2006) who transfected miR-124 in HepG2 cells. However, because up to this point our model only describes the dynamics of Ago loading with a small RNA, we first need to derive the consequences of Ago-loading dynamics for the mRNA and protein level of the small RNA targets.
The abundance of transcripts and proteins associated with individual genes is frequently described in terms of the rates of mRNA transcription, decay and translation and the rate of protein decay (e.g., Hargrove and Schmidt, 1989; Schwanhäusser et al, 2011; and Khanin and Higham, 2009). A large body of evidence indicates that miRNAs modulate both the decay and translation rates of mRNAs. How these rates respond to changes in miRNA expression is not known. However, because the studies of Djuranovic et al (2012) and Béthune et al (2012) showed that once loaded in Ago, miRNAs find their targets relatively fast, we can assume that the relative changes in mRNA decay and translation are proportional to the fraction of miRNA-loaded Ago. The resulting model, describing the mRNA and protein abundance of a given miRNA target, is parametrized by two proportionality factors δ and λ that relate the fraction of loaded Ago to the relative increase in mRNA decay and decrease in translation (see Materials and methods). λ>1 indicates that miRNAs predominantly affect the translation of the message, while λ between 0 and 1 corresponds to the case where miRNAs impact mostly the mRNA decay.
We first fitted the mRNA expression dynamics in response to miR-124 transfection measured by Wang and Wang (2006). To do so, we fixed the Ago-loading parameters γ, d, u to the values inferred from the fluorescence cross-correlation spectroscopy measurements of Ohrt et al (2008) (Figure 2A, in green). As a result, the fraction of loaded Ago can be described by a bi-exponential function of time. One can show that mRNA expression dynamics are driven by a single free parameter X0δ: the product of the initial concentration of the small RNA X0 and the maximum change in mRNA decay rate that can be induced by the small RNA δ. Alternatively, to account for the presumed delays in Ago loading upon miRNA transfection, we modified the Ago-loading model to include an additional compartment (presumably the endosomes) in which V0 miRNAs are loaded at the time of transfection (Figure 2A, in red). From this compartment, miRNAs are either degraded or translocate to the cytoplasm where they can associate with Ago. These assumptions lead to a tri-exponential Ago-loading function. In this alternative model, describing the miRNA-induced changes in mRNA abundance requires two free parameters:  , the experiment-specific rate with which miRNAs are cleared from endosomes through degradation or transfer to the cytoplasm, and rV0δ, the gene-specific influence of the transfected miRNAs on mRNA degradation.
Figure 2.

Changes in mRNA levels in the miR-124 transfection time course of Wang and Wang (2006) can be modeled assuming a tri-exponential Ago-loading function. (A) Cartoon illustrating two models of miRNA transfection experiments and their parameters. Free, fitted parameters appear in black, fixed parameters from Figure 1 in gray. The bi-exponential model (in green) is the same as in Figure 1A. Also shown is a tri-exponential model of Ago loading (in red), which is identical to the bi-exponential model, except for the addition of an extra compartment (V) in which V0 miRNAs are loaded at time t=0, and two additional rates: rate of miRNA decay in this compartment ( ) and rate of transfer to the Ago-accessible environment (r). (B) Log-likelihood profile of the clearance parameter
  given the mRNA profiling time-course data. The log-likelihood of the tri-exponential model (red line) is compared with that of the bi-exponential model (green line). (C) Cumulative distribution of the per-gene relative error between the model and the time-course data. The x-axis represents the per-gene relative error between the model prediction and the measurements. For any chosen cutoff on the relative error, the fraction of genes whose regulation following miRNA transfection could be predicted at the chosen error cutoff or less can be read on the y-axis. The dotted line marks a 20% error on the fold change typically observed in miRNA transfection experiments. (D) Boxplots of the model residual on log2 fold changes for genes that fit the measured mRNA fold changes with less than a 20% error. Boxes span the interquartal range and whiskers extending up to 1.5 times the interquartal range. See also Supplementary Figure S2.
We compared the goodness of fit of both models by fitting their free parameters—X0δ for the bi-exponential model, or  and rV0δ for the tri-exponential model i—to 1098 genes that had a miR-124 seed match in the 3′ UTR and were repressed on average 4, 8, 16, 24 and 32 h post transfection. This represents a total of 5490 data points. With a maximum log-likelihood of 877.3, the tri-exponential Ago-loading model fitted better the mRNA profiling data than the bi-exponential model (log-likelihood of −2994.6; Figure 2B; Supplementary Figure S2B). Replicate experiments would allow us to estimate an upper bound on the goodness of fit that can in principle be achieved, but unfortunately, the time series experiment did not include replicates. Nonetheless, we used a data set of six replicate experiments in which miR-124 was transfected into human embryonic kidney 293 (HEK293) cells and mRNA expression was subsequently profiled by microarrays (Karginov et al, 2007) to estimate this upper bound. The average standard deviation on the log2 mRNA fold change was σ=0.26 (Supplementary Figure S2C), corresponding to a 20% uncertainty on the fold change. At this cutoff, the tri-exponential model fitted 83.8% of the genes (Figure 2C), and the prediction error was uniform across time points (Figure 2D; Supplementary Figure S2D–F). Therefore, accounting for delays in Ago loading is necessary to model changes in gene expression following miRNA transfection.
Validation of the derived models of mRNA and protein abundance changes in response to miRNA transfection and induction
To test whether the models derived above can describe the change in abundances of both mRNAs and proteins following miRNA perturbation, we selected a ‘prototypical’ miRNA, miR-199a, that is not normally expressed in HEK293 cells and established a cell line in which the expression of miR-199a is inducible with doxycylin from a pRTS-1 episomal vector (Bornkamm et al, 2005). We further cloned the 3′ UTR of the kinectin (KTN1) gene, containing a miR-199a-3p binding site, downstream of the stop codon of the renilla luciferase in a psiCHECK-2 vector and stably integrated this construct in the genome of cells containing the miR-199 expression vector. We then investigated the response of the KTN1 gene at both the mRNA and protein level upon induction of miR-199a or transfection of miR-199-3p mimic. For Ago loading, we used the tri-exponential model for the transfection experiment, while for miRNA induction experiment, we changed the one-time micro-injection represented in Figure 1A to add constant miRNA synthesis into the Ago-accessible compartment X. The measured and predicted mRNA and protein-level dynamics for both miRNA transfection and induction are shown in Figure 3 and Supplementary Figure S3.
Figure 3.

The kinetic model fits measured changes in mRNA and protein levels following miR-199a transfection (A) or induction (B) in HEK293 cells. The 3′ UTR of the KTN1 miR-199a target was cloned downstream of the stop codon of a luciferase reporter gene. Changes in mRNA expression following miR-199a transfection or induction were quantified by qPCR whereas changes in protein levels were determined by measuring luciferase activity. In the transfection experiment, changes in mRNA and protein levels were then fitted assuming the previously introduced three-exponential Ago-loading model. In the induction experiment, we assumed constant miRNA synthesis into an Ago-accessible environment. The best-fitted model appears as a continuous line and error bars represent 95% confidence intervals on the measured changes in mRNA and protein abundance. See also Supplementary Figure S3.
From the perspective of the measured changes, we found that the transfection experiment had higher variability, presumably because the transfection efficiency varied to some extent between the replicate experiments. The changes in mRNA expression, measured by qPCR, also showed higher variability compared with changes in protein expression, which were estimated based on the luciferase activity. Nonetheless, the models give a reasonable fit to the mean observed changes. Furthermore, the protein-level changes, which are the final readout of our models’ dynamics and whose prediction depends on all of the assumptions that our models make, are remarkably well described by the models. These results indicate that our models predict well mRNA and protein-level changes in response to changes in miRNA expression. Furthermore, as data from other groups also suggest (Karginov et al, 2007), controlling variability in transfection experiments is difficult, and miRNA target identification could therefore be more accurate in experiments in which the miRNA is induced instead of transfected.
As additional validation of our model, we further tested its ability to explain changes in mRNA abundance and translation efficiency (estimated through Ribosome Protected Fragment (RPF) sequencing) measured at two time points (12 and 32 h) after miR-155 and miR-1 transfection by Guo et al (2010). Indeed, we found that the maximum-likelihood estimates of both  and rV0δ were in the range of those previously observed in Wang’s miR-124 and our miR-199 transfection experiments (Supplementary Figure S4A). The proportion of genes whose mRNA-level and RPF dynamics was fitted at the expected accuracy was 67.5% and 48.3% in the miR-155 and miR-1 transfections, respectively (Figure 4A). These numbers are lower than those we obtained for the Wang and Wang (2006) data, which could be due to the lower reproducibility of translation efficiency measurements by RPF—30% variability on the log2 fold change according to Ingolia et al (2009)—compared with mRNA profiling. Thus, our models that link the dynamics of the miRNA to the dynamics of its target at the mRNA and protein level explain well kinetic data from reporter systems as well as from high-throughput measurements.
Figure 4.

The kinetic model explains temporal changes in mRNA abundance, protein abundance and translation efficiency of most miRNA targets. Cumulative distributions of the relative error between the model prediction and the measurements in different transfection experiments. (A) Ribosome Protected Fragment (RPF) sequencing and mRNAseq experiments upon transfection of miR-155 and miR-1 by Guo et al (2010). (B) SILAC and microarray experiments upon miRNA transfection of miR-124, miR-1 and miR-181a by Baek et al (2008). (C) pSILAC and microarray experiments following the transfection of let-7b, miR-155, miR-16, miR-1 and miR-30a by Selbach et al (2008). The x-axis of each panel represents the per-gene relative error between the model prediction and the measurements. For any chosen cutoff on the relative error, the fraction of genes whose regulation following miRNA transfection could be predicted at the chosen error cutoff or less can be read on the y-axis. The dotted, vertical bars mark a 20% error cutoff on the fold change. This error level is typically observed in miRNA transfection experiments. See also Supplementary Figure S4.
Implications of Ago-loading kinetics and protein turnover for miRNA-dependent gene regulation
To explore the implications of our models for miRNA-dependent gene regulation, we investigated currently open questions in the field. One intensely debated aspect is the extent to which miRNAs affect the decay as opposed to the translation rate of target mRNAs. To answer this question, a few studies obtained direct, high-throughput measurements of mRNA as well as protein-level changes upon miRNA transfection (Baek et al, 2008; Selbach et al, 2008). The general conclusion was that miRNAs predominantly affect the mRNA decay rate. If this were the case, then one would expect a strong correlation between the changes in levels of mRNA and in protein of individual genes, which is not what one typically observes. Rather, changes in protein abundance appear uncoupled from changes in mRNA abundance and miRNA targets typically change less at the protein compared with the mRNA level (see Section 3.4 of the Supplementary Material). By measuring protein decay rates by Selected Reaction Monitoring, we further found that fast-decaying proteins were preferentially detected as miRNA targets in these experiments (Section 3.4 of the Supplementary Material). Additionally, in the one experiment in which mRNA and protein-level changes were measured a week after the expression of a miRNA was abrogated yielded a much stronger correlation. All of these observations suggested that the mRNA and protein-level changes were measured far from steady state, and we re-analyzed these data in the framework of our kinetic model.
The three Stable Isotope Labeling by Amino acids in Cell culture (SILAC) experiments of Baek et al (2008) fitted the model very well. The dynamics of >80% of genes with a seed match to the transfected miRNA and downregulated 24 h post transfection was perfectly described by the model (Figure 4B; Supplementary Figure S4B). This included genes for which the mRNA was more strongly regulated than the protein (Supplementary Figure S4D). In addition, the values of the fitted parameters were consistent with the values obtained from the other data sets (Supplementary Figure S4). Application of the model to the pulsed SILAC (pSILAC) data from the five transfection experiments of Selbach et al (2008) revealed a similar picture, with 50–90% of downregulated mRNAs with seed match to the transfected miRNA fitting the model (Figure 4C; Supplementary Figure S4C), including genes for which protein levels were less affected than mRNA levels (Supplementary Figure S4E). Thus, our model explains to a large extent the measured effects of miRNA on mRNAs and protein levels. Dissecting the relative contribution of translational repression and mRNA decay to the miRNA-mediated repression of individual targets (Supplementary Figure S4A–C) we found that on average ≈25% of the putative targets on a miRNA undergo predominantly translation repression. Thus, our analysis supports the previous assertions that miRNAs have a stronger impact on mRNA decay compared with translation (Baek et al, 2008, Guo et al, 2010). It further indicates that the discrepancy between the measured mRNA and protein-level responses of individual miRNA targets was due to the expression dynamics of the transfected miRNAs and to the confounding effect of protein decay rates on protein levels.
The second question that we sought to address relates to the observation that the expression of some miRNAs changes rapidly as a function of cellular state. In particular, Krol et al (2010) showed that the expression of miRNAs from the miR-183/96/182 cluster (but not of other miRNAs) changes rapidly in response to illumination and that these changes are important for the regulation of gene expression in the retina. Circadian changes in miRNA expression levels in the liver have also been described (Gatfield et al, 2009) and, examining the relative abundance of miRNAs in Ago2-immunoprecipitation samples prepared from HeLa cells in M phase and unsynchronized cells (Kishore et al, 2013) we also found that miRNAs of the let-7 family are two-fold upregulated during the M phase while miR-21 is 66% downregulated (Supplementary Table S1). In all of these circumstances the targets of the miRNAs whose expression is modulated should respond rapidly, on the timescale of about a day. We therefore asked under what conditions would the protein-level dynamics of miRNA targets reflect the rapid dynamics of the miRNA itself.
We used the model for miRNA induction experiments that was introduced in the previous section to compute the amplitude in the oscillation of a target protein level as a function of the protein decay rate and miRNA kinetics. To emulate the qPCR time series of Krol et al (2010), we explored a regulatory scenario in which miRNA synthesis switched between two regimes during a 24-h cycle (Supplementary Figure S5A): the first 12 h of low miRNA expression (synthesis rate: half of its maximum level) and the next 12 h of high expression (maximal synthesis rate). Although it does not come as a surprise that proteins with median half-life (48 h; Schwanhäusser et al, 2011) undergo oscillations of <1% in amplitude (Figure 5A), increasing the protein turnover rate by two orders of magnitudes still only leads to a modest increase in the amplitude of protein oscillations (<10%; Figure 5D). Responsible for these small changes are the slow kinetics of Ago loading and miRNA decay. It is only when fast protein turnover is combined with fast miRNA kinetics (rates of Ago association, dissociation, and of miRNA decay) that substantial oscillations in protein levels (60% of the baseline level assuming no translation repression and up to 2.5-fold with translation repression; Figure 5B) ensue.
Figure 5.

Parameter ranges that are compatible with a specific dynamic of protein targets. (A) Changes in protein levels induced by a miRNA whose synthesis switches between half-induction and full induction in 24 h cycles. Simulations were performed assuming the default kinetic parameter (48 h protein half-life, miRNA loading and decay rates estimated from biophysics data, red line) or faster kinetics (30 min protein half-life, 14-fold speed-up in miRNA loading and decay, black line). (B) Amplitude (fold change) of the oscillations in protein abundance as a function of protein decay and miRNA kinetics. The color bars correspond to the case where miRNA only affect mRNA decay (λ=0) or equally regulate mRNA decay and translation (λ=1). (C) Changes in protein levels following a sudden drop in miRNA synthesis given default kinetic parameter (48 h protein half-life, miRNA loading and decay rates from biophysics data, red line) or faster kinetics (5 h protein half-life, three-fold speed-up in miRNA loading and decay, black line). (D) Protein recovery time as a function of protein decay and miRNA kinetics. The color bars correspond to the case where miRNA only affect mRNA decay (λ=0) or equally regulate mRNA decay and translation (λ=1). See also Supplementary Figure S5.
Another highly relevant regulatory scenario is when the synthesis of a miRNA is abrogated at the transition between cell types or states. For example, rapid synthesis and subsequent clearance of the dre-miR-430 miRNA is important for proper zebrafish development (Chen et al, 2005; Giraldez et al, 2005). We thus investigated how fast target proteins are expected to change in response to a sudden block in miRNA synthesis (Supplementary Figure S5B). We again used the model introduced in the previous section for miRNA induction experiments and computed the time necessary for proteins to reach 90% of their steady-state level in the absence of the miRNA—the recovery time—as a function of the protein decay rate and of the miRNA kinetics. As expected, simulations revealed that the main factor limiting the recovery time is the protein decay rate (Figure 5C and D). However, they additionally allowed us to estimate the timescale of the protein response. Namely, proteins with a median half-life of 48 h (Schwanhäusser et al, 2011) would have a recovery times larger than 140 h (6 days). This implies that miRNAs are a slow means of regulating the levels of typical proteins. It may thus be expected that miRNAs preferentially target proteins with rapid turnover. We tested this hypothesis by comparing the decay rates of top compared with weakest predicted miRNA targets (highest and lowest, respectively, prediction scores according to the ElMMo algorithm (Gaidatzis et al, 2007) that estimates the strength of evolutionary selection of the miRNA-complementary sites) measured by Cambridge et al (2011). Indeed, we found that the highest scoring targets had significantly higher protein decay rates than low-scoring targets. This indicates that miRNAs preferentially target fast-decaying proteins, on whose expression they have a rapid regulatory impact (Supplementary Figure S5C). Alternatively, mechanisms such as increased protein turnover or cell division would need to be recruited to diminish the recovery time of miRNA targets. Similar considerations apply to the situation when a miRNA is strongly induced to repress its targets.
Discussion
By contrast to transcription factors, miRNAs are often viewed as rapid means of regulating gene expression. Although synthesizing a miRNA likely requires less time than synthesizing a protein, miRNAs only function as part of complexes with Ago proteins. Some studies (Khan et al, 2009) already suggested that Ago levels within cells are limiting, implying that for a miRNA to exert its function, it has to displace other miRNAs from Ago. The models we introduced here abstract much of the molecular complexity of the miRNA pathway, but their parameters can be fitted from presently available data sets. As a result, it remains challenging to pinpoint the precise steps (binding the double-stranded miRNA to Ago, expelling the passenger/miR* strand, etc.) that are most responsible for the inferred bottlenecks. Nevertheless, our analysis indicates that it is the overall Ago-loading process that determines the timescale of miRNA-dependent gene regulation. At an estimated Ago-dissociation rate of u=0.116 h−1, the half-life of Ago residency is ∼6 h, which sets a lower bound on the time that miRNAs need to regulate their target.
Re-analysis of data from experiments in which both mRNA and protein levels were measured after miRNA transfection shows that mRNAs underwent more pronounced changes than the proteins. The underlying explanation appears to be different in different experimental settings. In the SILAC experiments, it is the slow rate of protein decay that does not allow the full extent of protein downregulation to be reached before the miRNA is degraded. In contrast, in the pSILAC experiments the change of labeling medium, done 8 h post transfection, occurred before the full Ago loading with the transfected miRNA was reached (20–30 h post transfection). Thus, the proteins were labeled before the miRNA fully exerted its inhibitory effects and the confounding effect of protein decay rate was only partially circumvented. This suggests that changing the labeling medium at a later time point would better capture the effect of miRNAs of protein synthesis by pSILAC.
Simulating changes in mRNA and protein levels for two biological realistic scenarios, namely circadian oscillation of miRNA expression and a sudden change in miRNA synthesis, we found that protein decay rates critically limit the efficiency of miRNA regulation. Importantly, we found that oscillations of large amplitude in protein levels in response to an oscillating miRNA are predicted to be achievable only when the miRNA undergoes fast turnover and when the miRNA–Ago loading kinetics is fast, much faster than micro-injected siRNAs were found to load and unload from Ago. This is not a reflection of differences between siRNA and miRNA dynamics, because the siRNA–Ago loading model allows a very good fit to mRNA and protein-level data from a variety of experiments in which the miRNA expression was manipulated. Rather, our results suggest that active mechanisms increase miRNA turnover in specific in vivo conditions. The rate of Ago loading with a specific miRNA can be increased by activating the miRNA’s transcription. Exonucleases such as Xrn2 (Chatterjee and Grosshans, 2009), RRP41 (Bail et al, 2010), PNPase(old-35) (Das et al, 2010) and Xrn1 (Chatterjee et al, 2011), which have been implicated in active miRNA degradation as well as destabilization by a complementary miRNA (Chen et al, 2011; De et al, 2013) can destabilize the miRNA, thereby critically regulating miRNA residency in Ago.
Large oscillations in protein levels in response to an oscillating miRNA require a fast protein turnover rate. This situation is probably exemplified by the miR-16 family of miRNAs that regulates the cell cycle (Linsley et al, 2007), directly targeting Cyclin D3, Cyclin E1 (Liu et al, 2008) and likely also Cyclin D2, the latter being one of the top predicted ElMMo (Gaidatzis et al, 2007) targets of these miRNAs with three conserved binding sites. Indeed, cell-cycle proteins do undergo fast decay (Schwanhäusser et al, 2011), and these cyclins have been shown to undergo proteolysis at different points of the cell cycle (Russell et al, 1999; Strohmaier et al, 2001; Kida et al, 2007). Thus, miRNAs should be able to meaningfully modulate the expression of these proteins if they can rapidly load and unload from the Ago protein and decay. A natural timescale for the decay of proteins is set by cell division. In cells that undergo substantial clonal expansion, the miRNA-induced repression can take hold on the timescale of protein dilution by cell division. In non-dividing retinal neurons (Krol et al, 2010) however, miRNA-based regulation of protein levels would be slow unless the miRNA targets have a high turnover rate.
In conclusion, we constructed a unifying mathematical framework of the kinetics of miRNA-mediated gene regulation starting with Ago loading, going through miRNA-dependent change in mRNA abundance, translation efficiency and protein abundance. We inferred the model parameters from various types of experiments and showed that it accurately describes regulatory dynamics in miRNA micro-injection, induction and transfection experiments. This framework will help in further designing miRNA target identification experiments and in characterizing miRNA function away from the steady state such as in development, cell cycle and circadian rhythms.
Materials and methods
Modeling the kinetics of Ago loading
We briefly outline the models describing Ago loading with small RNAs that we use in our study. Full derivations can be found in Section 3.2 of the Supplementary Material.
Modeling Ago loading following siRNA micro-injection
In a micro-injection experiment, X0 siRNAs enter the cell at time t=0 h. A fraction f0 of the R Ago molecules is not bound to endogenous miRNAs (Khan et al, 2009) and therefore available for binding to siRNAs. If we assume that the fraction of free Ago f0 remains fairly constant during the experiment—that is, if siRNAs load mostly by displacing miRNAs from Ago—and that the amount of free endogenous miRNAs is not significantly affected by the small RNAs micro-injection, that siRNAs only decay if they are not bound to Ago and that Ago–siRNA association and dissociation rates happen on a fast timescale compared with processes such as synthesis and degradation, then we can write the dynamics of loaded Ago A and free siRNAs X as
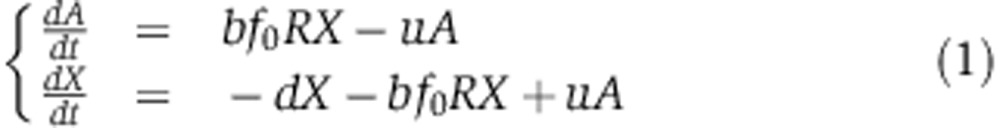 |
where free siRNAs X decay at rate d, associate with a free Ago at rate b and unload from a loaded Ago A at rate u. The equation for A specifies that the production rate of loaded Ago depends on the amount of free X, on the amount of free Ago f0R and on the binding rate b. Loaded Ago A is then lost by dissociation that happens at rate u. In the equation that defines the dynamics of free siRNA X, the first term accounts for first-order decay (at rate d), the second for the association with a free Ago and the last for the release from a loaded Ago. For convenience when fitting the biophysical data of Ohrt et al (2008), we can rewrite these equations in terms of the fraction of loaded Ago 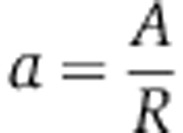 and substitute γ=bf0 which gives
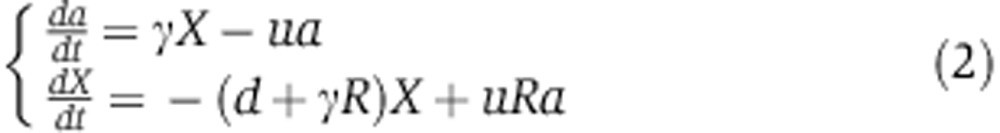 |
The analytical solution for the Ago-loading function a(t) can be shown to be bi-exponential where each exponential accounts for a different phase of the Ago-loading dynamics. The initial phase corresponds to the displacement of endogenous miRNAs by the siRNAs, and the second phase corresponds to the slow clearance of siRNAs from cells.
Modeling the loading of Ago with miRNAs upon miRNA transfection
In miRNA transfection experiments, miRNAs are delivered with liposomes as vectors as opposed to being directly injected into cells. This likely introduces an additional delay as miRNAs need to traffic from liposomes to endosomes and cytoplasm (Stalder et al, 2013). To account for that delay, we introduce an additional compartment V to our model. V0 miRNAs are delivered to V at time t=0 h, and from there they can either decay with rate  or transfer to the cytoplasm X with rate r. The ordinary differential equation (ODE) system describing these dynamics can be written as
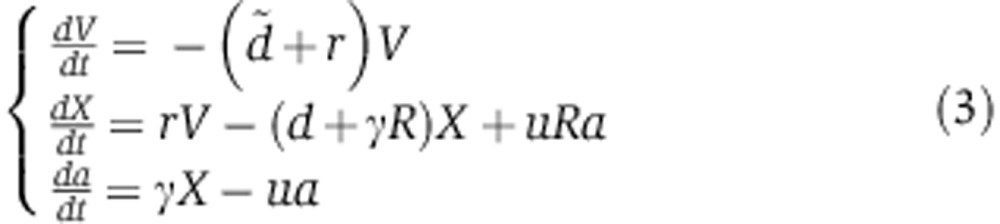 |
The analytical solution for the Ago-loading function is tri-exponential,
 |
whose parameters  can be computed from the biophysical parameters illustrated in Figure 2A (see below).
Modeling Ago loading upon miRNA induction.
When the miRNA is induced (by doxycyclin in the case of our experiment), there is no need to account for the endosomal compartment. We therefore start from Equation (2) and slightly alter the model by assuming that miRNA synthesis c(t) is inactive before 0 h and follows 0th order kinetics upon doxycyclin induction, that is
 |
with
 |
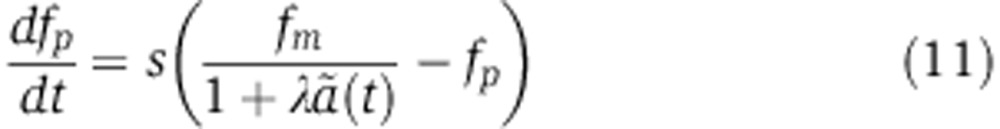
The fraction of loaded Ago a(t) is then coupled to changes in mRNA decay and translation as will be described below (Equation 8).
Modeling miRNA-induced changes in mRNA and protein abundance
We modeled mRNA and protein dynamics using an ODE model along the lines of those previously introduced by Hargrove and Schmidt (1989) and Khanin and Higham (2009)
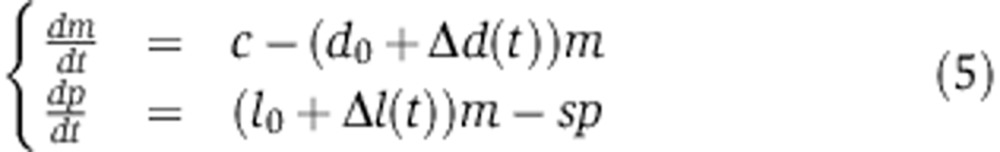 |
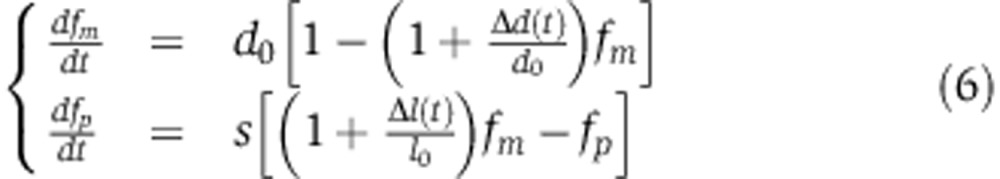
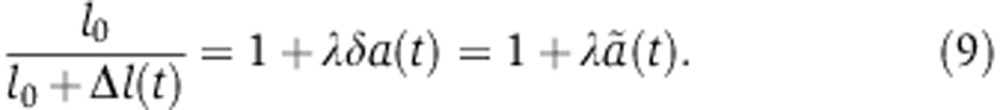
where m is the mRNA abundance, p the protein abundance, c the transcription rate, d0 and l0 the mRNA decay and translation rates in the absence of the miRNA, s the protein decay rate, and Δd(t) and Δl(t) represent the time-dependent changes in mRNA decay and translation rates induced by the miRNA.
Assuming that mRNA and protein abundances are at steady state before miRNA transfection, that is, 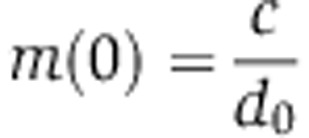 and
and 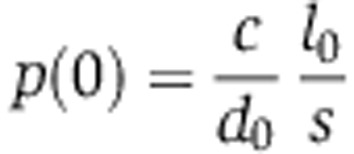 , Equation (5) can be rewritten in terms of the fold change in mRNA and protein abundances fm and fp, that do not depend on the transcription rate c:
 |
If after transfection the miRNA was to persist at a constant level until a new steady state was reached, then the change in protein abundance relative to the initial state would be given by 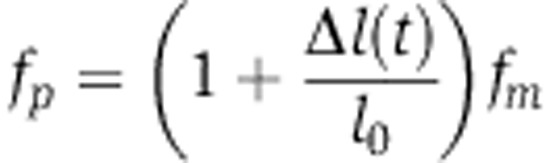 , that is proportional to the change in mRNA abundance, the proportionality factor being the change in translation rate of the mRNA. The timing with which the protein abundance changes and how closely it follows the mRNA abundance will depend on the decay rate of the protein, s; fast-decaying proteins will reach the steady state faster in response to the miRNA compared with slow-decaying proteins.
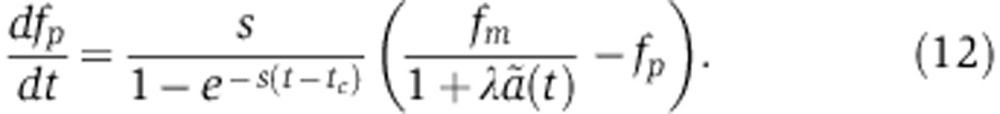
Of the two approaches to measure protein abundance changes upon miRNA transfection, SILAC (Baek et al, 2008) measurements can be described directly by Equation (6). pSILAC (Selbach et al, 2008), on the other hand, measures newly synthesized proteins. That is, at tc=8 h after transfection, the growth medium was changed and the amount of protein synthesized between 8 and 32 h after either miRNA or mock transfection was estimated. The difference between the amount of protein produced in miRNA- and mock-transfected cells between 8 and 32 h is given by
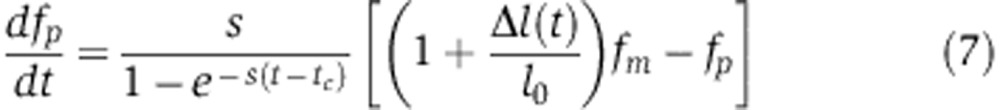 |
Compared with Equation (6), the magnitude of measured changes in protein abundance no longer depends on the protein decay rate s, but rather on the factor  , which is larger than s, particularly shortly after the medium change (t=tc). Consequently, pSILAC amplifies changes in protein levels by a factor
  that decreases with time. In addition, at constant time t, the strongest amplification occurs when
  is small, that is for stable proteins (small s). The change of a stable protein is therefore amplified more than that of an unstable protein, and therefore the regulatory impact of a miRNA will be revealed whether the protein is stable or unstable (Supplementary Figure S5D). As a consequence, for a miRNA target to appear as a ‘non-responder’ in a pSILAC experiment, its decay rate has to be extremely small, which we could verify experimentally (see Supplementary Material). The similarity in the fold-change trajectories of fast- and slow-decaying miRNA targets is of course a main rationale of the pSILAC approach (Schwanhäusser et al, 2009) which by reducing the confounding effect of protein decay rates leads to higher correlation between mRNA and protein fold changes (average of r=0.27 and r=0.41 for all genes and genes with seed match, respectively, compared to an average of r=0.18, for both categories of genes in SILAC, see Supplementary Table S2).
Assuming that the relative increase in mRNA decay and the decrease in translation is proportional to the fraction of Ago molecules loaded with the miRNA a(t) yields
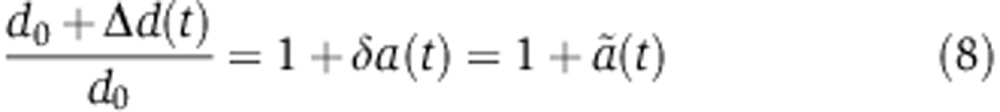 |
 |
where δ and λ are proportionality factors. Because miRNAs increase mRNA decay and repress translation, both λ and δ should be positive.  represents the relative change in the mRNA decay rate as a function of time.
Combining Equation (8), that relates the amount of miRNA-loaded Ago to changes in the rate of mRNA decay with Equation (6), that describes changes in mRNA level, we obtain a relationship between the change in mRNA level fm and the time-dependent change in the mRNA decay rate  ,
,
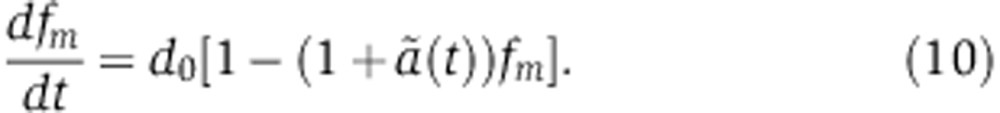 |
Friedel et al (2009); Schwanhäusser et al (2009), measured mRNA decay rates in high-throughput. Although we can use the per-gene measurements of mRNA decay rates from these studies, the data reveal a fairly tight distribution around a median of 0.12/h (5.8 h half-life). For simplicity, we set the mRNA decay rate d0 to 0.12/h in the above relation to analyze the mRNA response to miRNA transfection.
Similarly, by substituting Equations (8) and (9), that relate the amount of miRNA-loaded Ago to changes in the rates of mRNA decay and translation, into Equation (6) which describes changes in protein levels, we obtain
 |
which describes the change in protein level that would be measured as a function of time in an SILAC experiment. A similar equation can be derived for pSILAC measurements by substituting Equation (8) into Equation (7) to yield
 |
Because the protein decay rates have a much wider distribution than mRNA decay rates, in both models we used the measured (in HeLa cells) decay rates s of individual proteins Cambridge et al (2011) rather than a median decay rate.
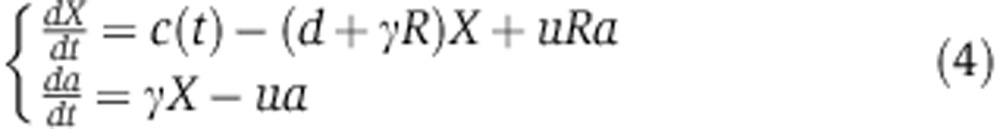
Changes in mRNA and protein abundance fm are driven by the relative change in mRNA decay  which depends on how the miRNA is delivered. In the case of a transfection experiment, one can solve Equation (3) to show that
  takes the form
 |
with
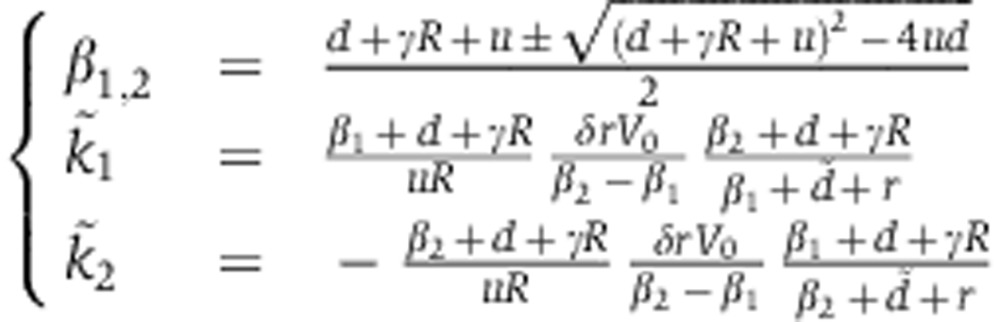 |
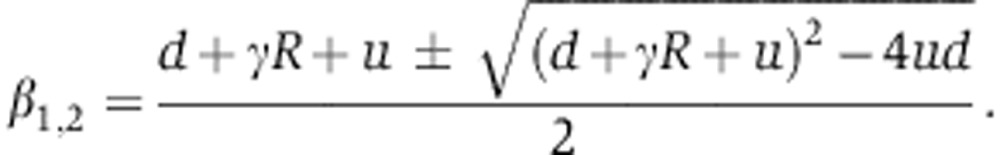
The parameters d, γ, R, u specify the kinetics of Ago loading and can be fitted from the experiments of Ohrt et al (2008) (see below). As a result, mRNA dynamics following miRNA transfection are determined by two free parameters, δrV0 and  . Modeling changes in protein abundance requires an additional parameter λ.
In the case of an induction experiment, solving Equation (4) shows that the function  takes the form of bi-exponential
 |
with
 |
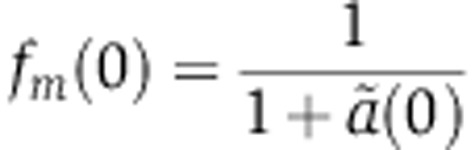
There too, we use the values of the Ago-loading parameters d, γ, R, u inferred from the experiments of Ohrt et al (2008) (see below). From Equation (14), we see that mRNA changes upon miRNA induction fm(t) are driven by one free parameter X0δ. As in the transfection case, modeling protein dynamics fp(t) require an additional parameter λ, which accounts for the effect of miRNAs on translation relative to mRNA decay.
Measuring changes in target protein and mRNA abundance upon miR-199 transfection and induction by luciferase assays and qPCR
Establishing a cell line stably expressing a miRNA target as well as inducibly expressing the cognate miRNA
We generated a stable HEK293T cell line that simultaneously expresses hsa-miR-199a-3p (miRBase accession MIMAT0000232) and its target 3′UTR (Kinectin 1, KTN1, RefSeqID NM_004986). KTN1 was chosen among the hsa-miR-199a-3p targets predicted by ElMMo (Gaidatzis et al, 2007) that had at least one binding site with high probability of being under selective pressure (P>0.7) and a 3′ UTR shorter than 1500 nts so that it could be cloned efficiently. The approach we took is illustrated in Supplementary Figure S6. We PCR amplified the primary hsa-miR-199a-3p and the target KTN1 3′ UTR and cloned them into pGEM-T Easy vector (Promega). The hsa-miR-199a-3p insert was sequenced and subsequently cloned into an inducible pRTS-1 vector (Bornkamm et al, 2005), replacing the luciferase gene at SfiI restriction sites. We then transfected HEK293T cells with the miR-199a-3p-pRTS-1 plasmid and selected colonies after 2 weeks of culture in the presence of hygromycin B (Calbiochem, 100 μg/ml). Selected colonies were subsequently propagated in the presence of hygromycin B.
The cell line was tested for hsa-miR-199a-3p expression after the addition of doxycycline (1 μg/ml) with northern blotting (Supplementary Figure S7). The small RNA Northern was performed as previously described (Pall and Hamilton, 2008), with a minor change: we used the conventional TBE buffer instead of an MOPS-NaOH buffer.
The KTN1 3′ UTR insert from the pGEM-T Easy vector was sequenced and subsequently cloned downstream of the open reading frame of renilla luciferase in a psi-CHECK2 vector (Promega). The miR-199a-3p-pRTS-1 cell line was then used for co-transfection of KTN1-psiCHECK-2 and pPUR (Clontech) plasmids in a 3:1 ratio. Stable colonies were isolated after 2 weeks of culture in the presence of hygromycin B and puromycin (Sigma-Aldrich, 0.75 μg/ml). Selected colonies were subsequently propagated in DMEM with 10% FCS, penicillin-streptomycin (Sigma-Aldrich), hygromycin B and puromycin. We confirmed the genomic integration of the KTN1 3′ UTR by PCR (see Supplementary Figure S8).
MiRNA transfections and luciferase assay
KTN1 cells were split in 12-well plates for both transfection and induction experiments. hsa-miR-199a-3p mimic (c-300536-07-0005) and miRNA mimic negative control (CN-002000-01-05, Thermo Fisher Scientific) were transfected with a final concentration of 25 nM using lipofectamine 2000 (Invitrogen) transfection reagent according to the manufacturer’s protocol. At the same time in a different set of experiment, hsa-miR-199a-3p expression was induced with doxycycline (Sigma-Aldrich, 1 μg/ml). Cells were collected at different time points (0, 2, 4, 8, 16, 24, 32 and 48 h). Both luciferase and qRT-PCR were performed with cells from a single well. Renilla and firefly activities were measured with the dual luciferase reporter assay system (Promega) with a luminometer (Centro LB960, Berthold Technologies). Firefly luciferase was used as an internal control.
Quantitative real-time PCR
We extracted total RNA with the TRI reagent (Sigma) as per the manufacturer’s protocol, and then applied DNase digestion with RQ1DNase (Promega) followed by phenol-chloroform purification and cDNA synthesis with SuperScriptIII (invitrogen) reverse transcriptase according to the manufacturer’s protocol. We measured mRNA levels with the Step One Plus real-time PCR system (Applied Biosystems) employing Power SYBR Green PCR Master Mix (Applied Biosystems). Firefly expression was used as an internal control. The primers for KTN1 3′ UTR were forward—GGGG CTCGAG TGGGAAACTGTTCATTTGAGG, reverse—TATT GCGGCCGC TTGCTGACGCCATTACAAAA. Primers for hsa-miR-199a-3p were miR-199a-3p_1_forward—AAAAGGCCTCACTGGCCCCTCCCCCACTCTTTAGGAT, miR-199a-3p_1_reverse—AAAAGGCCTCACTGGCCGTGGGGATGGCAGACTGATA. Primers for KTN1 cell line were GAGCGCGTGCTGAAGAACGAG (forward) and TTGCTGACGCCATTACAAAA (reverse). qRT-PCR primers were for firefly luciferase: hFluc-RT-rev—CGGTAGACCCAGAGCTGTTC, hFluc-RT-for—TGCAGAAGATCCTGAACGTG, and for renilla luciferase: hRluc-RT-rev—CTAACCTCGCCCTTCTCCTT and hRluc-RT-for—TCGTCCATGCTGAGAGTGTC.
In the qPCR data, the standard deviation on the log2 fold change was on average 0.31 (corresponding to a 23.8% uncertainty on the fold change), as typically observed in miRNA transfection experiments (Supplementary Figure S2).
Fitting kinetic parameters
We now describe the strategies we used to fit the kinetic parameters to the different data sets. Table I provides an overview of all parameters and documents how we determined their values.
Table 1. Parameters were either obtained from previous measurements or fitted to the data.
| Figure 1 | Figure 2 | Figure 3 | Figure 3 | Figure 4 | Figure 4 | Figure 4 | ||
|---|---|---|---|---|---|---|---|---|
| Ohrt | Wang | Transfection | Induction | Guo | Baek | Selbach | ||
| γ | miRNA–Ago association | Fitted | Fixeda | Fixeda | Fixeda | Fixeda | Fixeda | Fixeda |
| d | miRNA decay | Fitted | Fixeda | Fixeda | Fixeda | Fixeda | Fixeda | Fixeda |
| u | miRNA–Ago dissociation | Fitted | Fixeda | Fixeda | Fixeda | Fixeda | Fixeda | Fixeda |
| X 0 | Amount of micro-injected miRNAs | Fitted | ||||||
| d 0 | mRNA decay | Fixedb | Fixedb | Fixedb | Fixedb | Fixedb | Fixedb | |
| s | Protein decay | Fixedc | Fixedc | Fixedd | Fixedd | |||

|
Clearance from endosomes | Fitted | Fitted | Fitted | Fitted | Fitted | ||
| rV0δ | miRNA-induced change in mRNA decay (transfection) | Fitted | Fitted | Fitted | Fitted | Fitted | ||
| X0δ | miRNA-induced change in mRNA decay by miRNAs (induction) | Fitted | ||||||
| λ | Translation repression | Fitted | Fitted | Fitted | Fitted | Fitted |
Rows correspond to parameters and columns to data sets. Parameters were either fitted, fixed to the indicated reference. Empty cells represent cases in which a given parameter is irrelevant to the data set. To give an overview, we briefly indicate the references used to set the parameters. The main and Supplementary Methods sections describe how we determined them.
aThe Ago-loading parameters γ, d, u were fixed to the values inferred from the micro-injection and fluorescence cross-correlation spectroscopy experiments of Ohrt et al (2008).
bThe mRNA decay rate d0 was fixed to 0.12/h, a value determined from the measurements of Friedel et al (2009) and Schwanhäusser et al (2011).
cThe decay rate s of the luciferase was set to 0.14/h, (https://tinyurl.com/promegaBatesLuciferase).
dProtein decay rates were obtained from the mass-spectrometry measurements of Cambridge et al (2011).
Fitting the parameters of Ago loading from the fluorescence cross-correlation spectroscopy siRNA micro-injection time course
We obtained the fractions of cytoplasmic Ago in complex with the siRNA and the cytoplasmic fractions of siRNAs in complex with Ago 0, 1, 3, 6, 12, 24 and 48 h after siTK3 micro-injection together with the standard errors on these fractions (Ohrt et al, 2008). This experiment was the largest of those performed by Ohrt et al (2008). We subtracted the fraction of bound Ago and bound siRNA at 0 h from all the measurements so that the fraction of bound Ago and siRNA was 0% at 0 h.
To fit the parameters, we simulated the fraction of Ago in complex with the siRNA and the fraction of siRNA in complex with Ago using Equation (2). Initial parameter space exploration by gradient ascent methods on the likelihood assuming a Gaussian error model suggested initial parameter estimates: γ=10−5, d=0.12, u=0.12 and X0=16 000. We then refined these estimates and determined their uncertainty by Markov Chain Monte Carlo. The chain was initialized at 10% of our initial estimates. From there, we performed Gaussian moves with standard deviation set to 33% of our initial parameter estimates, with a uniform prior that only allowed positive parameter values. The chain ran for 106 sampling steps and visual inspection of the sampling traces suggested that sampling was at equilibrium (Supplementary Figure S1). Acceptance probability was 20.8%. The parameter set with highest likelihood was γ=3.05 × 10⁻⁶/molecule/h, d=0.102/h, u=0.116/h and X0=18 661.67 molecules. Finally, we determined the posterior probability distributions of the parameters from the MCMC samples, excluding the first 50 000 samples to ensure that the chain was ‘burnt-in’ (Supplementary Figure S1).
The product of the miRNA–Ago association rate b and the fraction of free Ago f0, γ=bf0, was in the range of 10−6/molecule/h suggesting that the rate of small RNA binding to Ago is small or that there is little free Ago at steady state. In contrast, small RNA dissociation from Ago (u) appears to be about as fast as their decay (d), of the order of 10−1/h. mRNA decay rates are in a similar range (Friedel et al, 2009; Schwanhäusser et al, 2011). Finally, we estimated that X0≃19 000 molecules of small RNA were injected in the cell at time t=0 h.
Fitting changes in mRNA, protein and RPF abundance upon miRNA transfection by previous studies, and in the present study through luciferase activity and qPCR of a reporter gene
We fixed the baseline mRNA decay rate d0 to the average of previously estimated values. That is, Friedel et al (2009) estimated a median decay rate of 0.15/h in murine fibroblasts and 0.13/h in human B cells, while Schwanhäusser et al (2011) reported a median mRNA decay rate of 0.08/h in murine fibroblasts. We used the average of these values, 0.12/h for d0, corresponding to a mRNA half-life of 5.8 h. For the dynamics of miRNA loading into Ago, we assumed that the rates of association (b)/dissociation (u) of the Ago–miRNA complex, the miRNA decay rate d, and the fraction of free Ago at steady state f0 were the same as in the experiment of Ohrt et al (2008). Hence, we fixed the parameters γ=bf0, u and d to the values mentioned in Figure 1B. The remaining parameters X0, the initial amount of miRNA and δ, the factor that relates the fraction of loaded Ago to the relative change in the mRNA decay rate, most certainly vary between experiments. Under the bi-exponential Ago-loading model, δ and X0 always occur as a product in the analytical expression of  (Equation 7 of the Supplementary Material). The model has hence one free parameter δX0 which we estimated by fitting mRNA profiling time-series data. Similarly, the analytical expression of
  under the tri-exponential Ago-loading model (Equation 13) depends on two parameters:
  , the rate with which miRNAs are cleared from endosomes through degradation or by transferring to the cytoplasm, and rV0δ, that quantifies the influence of the transfected miRNAs on mRNA degradation.
For each transfection experiment (Wang and Wang, 2006; Baek et al, 2008; Selbach et al, 2008; Guo et al, 2010), we scanned 25 values of  between 0.003/h and 0.6/h, equally spaced on a logarithmic scale. For each of these values and for each gene, we first obtained the rV0δ parameter by maximum likelihood from the mRNA profiling data, assuming a Gaussian error model on the measured log2 mRNA fold change. To set the standard deviation of the error model in the case of the data of Wang and Wang (2006); Baek et al (2008); Selbach et al (2008); Guo et al (2010) where biological replicates were not performed, we used the value 0.25 from the miRNA transfection data of Karginov et al (2007) (Supplementary Figure S2C). In the case of our luciferase and qPCR measurements, we used the standard error computed from triplicate measurements. We focused on genes that carried a seed match to the transfected miRNA and whose cognate mRNA levels were downregulated following miRNA transfection, averaging log2 fold changes when several time points were available. When analyzing the qPCR measurements of the present study, we also discarded data points for which changes in mRNA and protein levels could not be determined in triplicates because the machine failed to amplify the target. We maximized the log-likelihood with respect to rV0δ by a combination of golden section searches and successive parabolic interpolations implemented in the optimize() function of the R software (R Development Core Team, 2006). Finally, by repeating this procedure for the different values of
  , we determine the value of
  that maximized the likelihood of each transfection experiment, as well as of the gene-specific rV0δ parameters. With only one time point of mRNA and protein measurement in the experiments of Baek et al (2008), the parameter estimation problem is under-determined. As a result, the experiments of Baek et al (2008) do not suggest a single, most-likely estimate for
  but rather a range of values that are consistent with the measurements (Supplementary Figure S4B). The values of
  that we inferred from Wang’s miR-124 transfection, our miR-199 transfection, and Guo’s miR-155 and miR-1 transfections were within these ranges. Fixing the value of this parameter to 0.014/h—a value inferred from Wang’s miR-124 transfection (Figure 2)—we then estimated the rV0δ and λ parameters for each gene, based on the measured change in mRNA level at 24 h and protein change 48 h post transfection.
In experiments that also featured protein quantification or RPF profiling data, we further obtained maximum-likelihood estimates of the λ parameter for each gene given the previously determined  and rV0δ parameters and assuming the same Gaussian error model on the log2 fold change as for the mRNA data. When fitting the SILAC data of Baek et al (2008) and luciferase activities in our reporter system, we used the protein dynamics defined by Equation (6) while Equation (7) was used with the pSILAC data of Selbach et al (2008). In total, we thereby analyzed 117, 154 and 106 genes with seed matches to miR-124, miR-1 and miR-181 in Baek et al (2008) and 139, 211, 319, 197 and 157 genes in the let-7, miR-155, miR-16, miR-1 and miR-30a transfections of Selbach et al (2008) for which protein turnover measurements were available (Cambridge et al, 2011). In the case of the RPF profiling experiments of Guo et al (2010), we first computed the log2 fold change in translation efficiency ri–mi from the log2 fold change in RPF ri and mRNA abundance mi. In the case of our qPCR and luciferase measurements, we set the decay rate s of the luciferase to 0.14/h (see https://tinyurl.com/promegaBatesLuciferase). We then fitted λ by comparing the measured log2 fold change in translation efficiency to the model prediction
  assuming the previously described Gaussian error model, where
  is the change in the mRNA decay rate (Equation 3).
Fitting changes in luciferase activity and mRNA abundance upon miRNA induction
We first fitted the X0δ parameter from temporal changes in the mRNA level by maximum likelihood assuming a Gaussian error model on the measured log2 fold change. The standard deviation was set to the standard error computed from triplicate measurements. By the same method as in the previous paragraph, we first determined the maximum-likelihood estimate of X0δ from the qPCR data based on the Ago-loading dynamics of Equations (14) and (10), and then estimated λ from the luciferase activities using Equation (11).
Simulations
We simulated the dynamics of miRNAs and their targets under two regulatory scenarios using the same model as in an induction experiment (Equations 14, 10 and 11), where a miRNA is synthesized into an Ago accessible compartment X. We used parameter estimates from the biophysics data of Ohrt et al (2008) for association γ, dissociation u and decay d. δ was set to 7.32 (see below for the justification). Protein decay rate s was initially set to 0.015/h (48 h half-life).
Simulating protein recovery after a sudden block in miRNA expression
We set X(0) to 18 000 which in the context of the other parameters implied that 50% of Agos are loaded with the miRNA at steady state (Supplementary Figure S5). This is representative of the case of highly expressed miRNAs such as miR-430 in the zebrafish embryo (Chen et al, 2005) or miR-122 in liver (Landgraf et al, 2007). We used measurements made on the miR-223 knockout neutrophils (Baek et al, 2008) to determine δ; namely, from the observations that miR-223 represents 5% of all miRNAs in neutrophils (Baek et al, 2008) and that miR-223 targets are upregulated by 37% upon miR-223 knock-out (log2 value of 0.45 in Supplementary Table S2), we can use Equation (9) to infer that the miRNA can change the rate of mRNA decay by a factor  when Ago is fully saturated with the miRNA. The protein decay rate s was initially set to 0.015/h (48 h half-life). At t=0 h, miRNA synthesis stops, that is c(t)=0. Initial conditions were computed under the scenario that all variables are at steady state at t=0 h. By solving Equations (10), (11) and (4) at steady state, we obtain
  ,
,  and
and 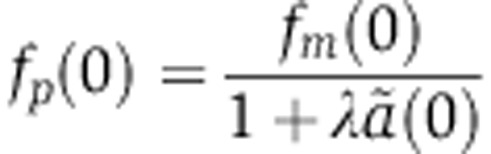 . We then simulated free miRNAs X, loaded Ago a, mRNA fm and proteins fp according to Equations (10), (11) and (4) (see Supplementary Figure S5). In the absence of the miRNA, the fold change in protein level is fp=1 by definition, but the value 1 is reached only as t tends toward infinity. We defined the recovery time as the amount of time necessary for fp(t) to exceed 0.9. We then monitored the recovery time as a function of the protein decay rate which we varied between 0.014/h and 0.14/h (corresponding to half-lives ranging from 5 to 48 h), and general miRNA kinetics where we multiplied γ=bf0, u and d by a common factor k ranging from 1 to 3. Finally, simulations were performed under two scenarios: no translation repression λ=0 and equal contribution of translation repression and mRNA decay λ=1.
Computing the amplitude of oscillations in protein abundance in response to a miRNA with cyclic expression pattern
In this simulation, we sought to reproduce the observations of Krol et al (2010) by implementing the scenario in which miRNA synthesis was half-activated during the first 12 h of a 24-h cycle, and then fully activated during the second half of the cycle. We thus considered the miRNA synthesis function
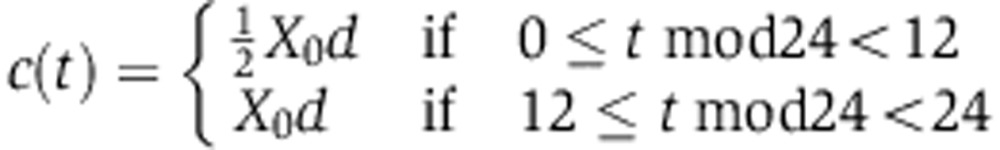 |
We again set X0 to 18 000 which in the context of the other parameters implies that 50% of Agos would be loaded with the miRNA if miRNA synthesis remained fully active long enough for steady state to be reached. Note that defining miRNA synthesis as a function of the miRNA decay rate d makes it possible to change the rate d without changing the amount of free miRNA and loaded Ago. Initial conditions were computed numerically by simulating free miRNAs X, loaded Ago a, mRNA fold change fm and protein fold change fp according to Equations (10), (11) and (4) for 100 cycles (2400, h). From these initial conditions, we then simulated another three cycles (72 h) for visualization purposes (see Supplementary Figure S5). We then defined the amplitude of the oscillations as the ratio 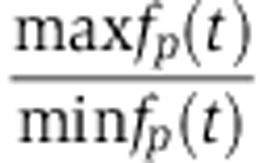 between the highest and smallest protein levels achieved in these three cycles. We monitored the amplitude of protein oscillations as a function of the protein decay rate which we varied between 0.014/h and 1.39/h (corresponding to half-lives ranging from 30 min to 48 h). In addition, the measurements of Krol et al (2010) suggest that miRNAs responding to light-dark adaptation undergo fast turnover, with half-lives as short as 30 min, 14 times faster than the observed decay in the fluorescence cross-correlation spectroscopy experiments of Ohrt et al (2008) and used in our model. We therefore varied the miRNA decay rate, Ago association rate and Ago dissociation rates between their original values up to a 14-fold increase. Thereby, we varied the miRNA decay rate from d=0.10/h to 1.39/h, the Ago dissociation rate from u=0.12/h to 1.61/h and the normalized association rate from γ=3.11 × 10⁻⁶/molecule/h to 4.27 × 10⁻⁵/molecule/h.
Supplementary Material
Supplementary Figures S1–17, Supplementary Tables S1–2
Kinetic model to simulate and fit measured changes in mRNA and protein abundance following miR-199a transfection and induction. The file includes source code (in R) and experimental data.
Acknowledgments
We thank Lukas Burger (Bioinformatics platform, FMI Basel), Julien Béthune (Filipowicz lab, FMI Basel), Annecke Brümmer and members of the Zavolan and van Nimwegen group for input and stimulating discussions. We also thank Nitish Mittal for valuable input in the design and analysis of the reporter experiments and Helge Grosshans (FMI Basel) for constructive comments on the manuscript. JH acknowledges the support of the Swiss National Science Foundation (PBBSP3_146961) and EMBO (ALTF 1160-2012). Work in the Zavolan laboratory was supported by the Swiss National Science foundation grant #31003A_127307. RA is supported by the European Research Council (ERC-2008-AdG 233226). MZ and RA were further supported by SystemsX.ch, the Swiss Initiative for Systems Biology.
Author contributions: NS and RA designed the mass spectrometry experiments and NS performed the SRM measurements with the help of LJ for sample preparation. NS and JH analyzed the mass spectrometry measurements to estimate protein decay rates. JH performed all other analyses. APS, LJ, JH and MZ designed the luciferase/qPCR time-series experiments following miRNA transfection/induction and APS performed the experiments. EvN inspired the use of the kinetic approach and designed the miRNA loading model. JH and MZ designed the research and wrote the paper with input from all authors.
Footnotes
The authors declare that they have no conflict of interest.
References
- Anokye-Danso F, Trivedi CM, Juhr D, Gupta M, Cui Z, Tian Y, Zhang Y, Yang W, Gruber PJ, Epstein JA, Morrisey EE (2011) Highly efficient miRNA-mediated reprogramming of mouse and human somatic cells to pluripotency. Cell Stem Cell 8: 376–388 [DOI] [PMC free article] [PubMed] [Google Scholar]
- Baek D, Villén J, Shin C, Camargo F, Gygi S, Bartel DP (2008) The impact of microRNAs on protein output. Nature 455: 64–71 [DOI] [PMC free article] [PubMed] [Google Scholar]
- Bail S, Swerdel M, Liu H, Jiao X, Goff LA, Hart RP, Kiledjian M (2010) Differential regulation of microRNA stability. RNA (New York, NY) 16: 1032–1039 [DOI] [PMC free article] [PubMed] [Google Scholar]
- Bartel DP (2009) MicroRNAs: target recognition and regulatory functions. Cell 136: 215–233 [DOI] [PMC free article] [PubMed] [Google Scholar]
- Béthune J, Artus-Revel CG, Filipowicz W (2012) Kinetic analysis reveals successive steps leading to miRNA-mediated silencing in mammalian cells. EMBO Rep 13: 1–8 [DOI] [PMC free article] [PubMed] [Google Scholar]
- Bornkamm GW, Berens C, Kuklik-Roos C, Bechet JM, Laux G, Bachl J, Korndoerfer M, Schlee M, Hölzel M, Malamoussi A, Chapman RD, Nimmerjahn F, Mautner J, Hillen W, Bujard H, Feuillard J (2005) Stringent doxycycline-dependent control of gene activities using an episomal one-vector system. Nucleic Acids Res 33: e137. [DOI] [PMC free article] [PubMed] [Google Scholar]
- Broderick JA, Zamore PD (2011) MicroRNA therapeutics. Gene Therapy 18: 1104–1110 [DOI] [PMC free article] [PubMed] [Google Scholar]
- Cambridge SB, Gnad F, Nguyen C, Bermejo JL, Krüger M, Mann M (2011) Systems-wide proteomic analysis in mammalian cells reveals conserved, functional protein turnover. J Proteome Res 10: 5275–5284 [DOI] [PubMed] [Google Scholar]
- Chatterjee S, Fasler M, Büssing I, Grosshans H (2011) Target-mediated protection of endogenous microRNAs in C. elegans. Dev Cell 20: 388–396 [DOI] [PubMed] [Google Scholar]
- Chatterjee S, Grosshans H (2009) Active turnover modulates mature microRNA activity in Caenorhabditis elegans. Nature 461: 546–549 [DOI] [PubMed] [Google Scholar]
- Chen PS, Su JL, Cha ST, Tarn WY, Wang MY, Hsu HC, Lin MT, Chu CY, Hua KT, Chen CN, Kuo TC, Chang KJ, Hsiao M, Chang YW, Chen JS, Yang PC, Kuo ML (2011) miR-107 promotes tumor progression by targeting the let-7 microRNA in mice and humans. J Clin Invest 121: 3442–3455 [DOI] [PMC free article] [PubMed] [Google Scholar]
- Chen PY, Manninga H, Slanchev K, Chien M, Russo JJ, Ju J, Sheridan R, John B, Marks DS, Gaidatzis D, Sander C, Zavolan M, Tuschl T (2005) The developmental miRNA profiles of zebrafish as determined by small RNA cloning. Genes Dev 19: 1288–1293 [DOI] [PMC free article] [PubMed] [Google Scholar]
- Das SK, Sokhi UK, Bhutia SK, Azab B, Su ZZ, Sarkar D, Fisher PB (2010) Human polynucleotide phosphorylase selectively and preferentially degrades microRNA-221 in human melanoma cells. Proc Natl Acad Sci USA 107: 11948–11953 [DOI] [PMC free article] [PubMed] [Google Scholar]
- De N, Young L, Lau PW, Meisner NC, Morrissey DV, Macrae IJ (2013) Highly complementary target RNAs promote release of guide RNAs from human Argonaute2. Mol Cell 50: 344–355 [DOI] [PMC free article] [PubMed] [Google Scholar]
- Djuranovic S, Nahvi A, Green R (2012) miRNA-mediated gene silencing by translational repression followed by mRNA deadenylation and decay. Science 336: 237–240 [DOI] [PMC free article] [PubMed] [Google Scholar]
- Fabian MR, Sonenberg N, Filipowicz W (2010) Regulation of mRNA translation and stability by microRNAs. Annu Rev Biochem 79: 351–379 [DOI] [PubMed] [Google Scholar]
- Friedel CC, Dölken L, Ruzsics Z, Koszinowski UH, Zimmer R (2009) Conserved principles of mammalian transcriptional regulation revealed by RNA half-life. Nucleic Acids Res 37: e115. [DOI] [PMC free article] [PubMed] [Google Scholar]
- Gaidatzis D, van Nimwegen E, Hausser J, Zavolan M (2007) Inference of miRNA targets using evolutionary conservation and pathway analysis. BMC Bioinformatics 8: 69. [DOI] [PMC free article] [PubMed] [Google Scholar]
- Gatfield D, Le Martelot G, Vejnar CE, Gerlach D, Schaad O, Fleury-Olela F, Ruskeepää AL, Oresic M, Esau CC, Zdobnov EM, Schibler U (2009) Integration of microRNA miR-122 in hepatic circadian gene expression. Genes Dev 23: 1313–1326 [DOI] [PMC free article] [PubMed] [Google Scholar]
- Giraldez AJ, Cinalli RM, Glasner ME, Enright AJ, Thomson JM, Baskerville S, Hammond SM, Bartel DP, Schier AF (2005) MicroRNAs regulate brain morphogenesis in zebrafish. Science 308: 833–838 [DOI] [PubMed] [Google Scholar]
- Grimson A, Farh K, Johnston W, Garrett-Engele P, Lim LP, Bartel DP (2007) MicroRNA targeting specificity in mammals: determinants beyond seed pairing. Mol Cell 27: 91–105 [DOI] [PMC free article] [PubMed] [Google Scholar]
- Guo H, Ingolia NT, Weissman JS, Bartel DP (2010) Mammalian microRNAs predominantly act to decrease target mRNA levels. Nature 466: 835–840 [DOI] [PMC free article] [PubMed] [Google Scholar]
- Hargrove JL, Schmidt FH (1989) The role of mRNA and protein stability in gene expression. FASEB J 3: 2360–2370 [DOI] [PubMed] [Google Scholar]
- Heo I, Joo C, Kim YK, Ha M, Yoon MJ, Cho J, Yeom KH, Han J, Kim VN (2009) TUT4 in concert with Lin28 suppresses microRNA biogenesis through pre-microRNA uridylation. Cell 138: 696–708 [DOI] [PubMed] [Google Scholar]
- Hobert O (2008) Gene regulation by transcription factors and microRNAs. Science (New York, NY) 319: 1785–1786 [DOI] [PubMed] [Google Scholar]
- Huntzinger E, Izaurralde E (2011) Gene silencing by microRNAs: contributions of translational repression and mRNA decay. Nat Rev Genet 12: 99–110 [DOI] [PubMed] [Google Scholar]
- Ingolia NT, Ghaemmaghami S, Newman JRS, Weissman JS (2009) Genome-wide analysis in vivo of translation with nucleotide resolution using ribosome profiling. Science 324: 218–223 [DOI] [PMC free article] [PubMed] [Google Scholar]
- Kanellopoulou C, Muljo SA, Kung AL, Ganesan S, Drapkin R, Jenuwein T, Livingston DM, Rajewsky K (2005) Dicer-deficient mouse embryonic stem cells are defective in differentiation and centromeric silencing. Genes Dev 19: 489–501 [DOI] [PMC free article] [PubMed] [Google Scholar]
- Karginov FV, Conaco C, Xuan Z, Schmidt BH, Parker JS, Mandel G, Hannon GJ (2007) A biochemical approach to identifying microRNA targets. Proc Natl Acad Sci USA 104: 19291–19296 [DOI] [PMC free article] [PubMed] [Google Scholar]
- Khan AA, Betel D, Miller ML, Sander C, Leslie CS, Marks DS (2009) Transfection of small RNAs globally perturbs gene regulation by endogenous microRNAs. Nat Biotechnol 27: 549–555 [DOI] [PMC free article] [PubMed] [Google Scholar]
- Khanin R, Higham DJ (2009) Mathematical and computational modelling of post-transcriptional gene regulation by microRNAs. InHandbook of Statistical Systems Biology chap. 10 [Google Scholar]
- Kida A, Kakihana K, Kotani S, Kurosu T, Miura O (2007) Glycogen synthase kinase-3beta and p38 phosphorylate cyclin D2 on Thr280 to trigger its ubiquitin/proteasome-dependent degradation in hematopoietic cells. Oncogene 26: 6630–6640 [DOI] [PubMed] [Google Scholar]
- Kishore S, Gruber AR, Jedlinski DJ, Syed AP, Jorjani H, Zavolan M (2013) PAR-CLIP of snoRNA core proteins and small RNA-seq identify novel human snoRNA loci and give insights into snoRNA processing. Genome Biol 14: R45. [DOI] [PMC free article] [PubMed] [Google Scholar]
- Krol J, Busskamp V, Markiewicz I, Stadler MB, Ribi S, Richter J, Duebel J, Bicker S, Fehling HJ, Schübeler D (2010) Characterizing light-regulated retinal microRNAs reveals rapid turnover as a common property of neuronal microRNAs. Cell 141: 618–631 [DOI] [PubMed] [Google Scholar]
- Landgraf P, Rusu M, Sheridan R, Sewer A, Iovino N, Aravin A, Pfeffer S, Rice A, Kamphorst AO, Landthaler M, Lin C, Socci ND, Hermida L, Fulci V, Chiaretti S, Foà R, Schliwka J, Fuchs U, Novosel A, Müller RU et al. (2007) A mammalian microRNA expression atlas based on small RNA library sequencing. Cell 129: 1401–1414 [DOI] [PMC free article] [PubMed] [Google Scholar]
- Linsley PPS, Schelter JM, Burchard J, Kibukawa M, Martin MMM, Bartz SRS, Johnson JJM, Cummins JMJ, Raymond CCK, Dai H, Chau N, Cleary M, Jackson AL, Carleton M, Lim L (2007) Transcripts targeted by the microRNA-16 family cooperatively regulate cell cycle progression. Mol Cell Biol 27: 2240–2252 [DOI] [PMC free article] [PubMed] [Google Scholar]
- Liu Q, Fu H, Sun F, Zhang H, Tie Y, Zhu J, Xing R, Sun Z, Zheng X (2008) miR-16 family induces cell cycle arrest by regulating multiple cell cycle genes. Nucleic Acids Res 36: 5391–5404 [DOI] [PMC free article] [PubMed] [Google Scholar]
- Lu J, Getz G, Miska EA, Alvarez-Saavedra E, Lamb J, Peck D, Sweet-Cordero A, Ebert B, Mak R, Ferrando A, Downing J, Jacks T, Horvitz H, Golub T (2005) MicroRNA expression profiles classify human cancers. Nature 435: 834–838 [DOI] [PubMed] [Google Scholar]
- Ohrt T, Mütze J, Staroske W, Weinmann L, Höck J, Crell K, Meister G, Schwille P (2008) Fluorescence correlation spectroscopy and fluorescence cross-correlation spectroscopy reveal the cytoplasmic origination of loaded nuclear RISC in vivo in human cells. Nucleic Acids Res 36: 6439–6449 [DOI] [PMC free article] [PubMed] [Google Scholar]
- Pall GS, Hamilton AJ (2008) Improved northern blot method for enhanced detection of small RNA. Nat Protoc 3: 1077–1084 [DOI] [PubMed] [Google Scholar]
- Pfeffer S, Zavolan M, Grässer FA, Chien M, Russo JJ, Ju J, John B, Enright AJ, Marks DS, Sander C, Tuschl T (2004) Identification of virus-encoded microRNAs. Science 304: 734–736 [DOI] [PubMed] [Google Scholar]
- R Development Core Team. (2006) R: A Language and Environment for Statistical Computing R Foundation for Statistical Computing: Vienna, Austria, [Google Scholar]
- Rissland OS, Hong Sj, Bartel DP (2011) Article microRNA destabilization enables dynamic regulation of the miR-16 family in response to cell-cycle changes. Mol Cell 43: 993–1004 [DOI] [PMC free article] [PubMed] [Google Scholar]
- Russell A, Thompson MA, Hendley J, Trute L, Armes J, Germain D (1999) Cyclin D1 and D3 associate with the SCF complex and are coordinately elevated in breast cancer. Oncogene 18: 1983–1991 [DOI] [PubMed] [Google Scholar]
- Schwanhäusser B, Busse D, Li N, Dittmar G, Schuchhardt J, Wolf J, Chen W, Selbach M (2011) Global quantification of mammalian gene expression control. Nature 473: 337–342 [DOI] [PubMed] [Google Scholar]
- Schwanhäusser B, Gossen M, Dittmar G, Selbach M (2009) Global analysis of cellular protein translation by pulsed SILAC. Proteomics 9: 205–209 [DOI] [PubMed] [Google Scholar]
- Selbach M, Schwanhäusser B, Thierfelder N, Fang Z, Khanin R, Rajewsky N (2008) Widespread changes in protein synthesis induced by microRNAs. Nature 455: 58–63 [DOI] [PubMed] [Google Scholar]
- Shimoni Y, Friedlander G, Hetzroni G, Niv G, Altuvia S, Biham O, Margalit H (2007) Regulation of gene expression by small non-coding RNAs: a quantitative view. Mol Syst Biol 3: 138. [DOI] [PMC free article] [PubMed] [Google Scholar]
- Song JL, Stoeckius M, Maaskola J, Friedländer M, Stepicheva N, Juliano C, Lebedeva S, Thompson W, Rajewsky N, Wessel GM (2011) Select microRNAs are essential for early development in the sea urchin. Dev Biol 362: 104–113 [DOI] [PMC free article] [PubMed] [Google Scholar]
- Stalder L, Heusermann W, Sokol L, Trojer D, Wirz J, Hean J, Fritzsche A, Aeschimann F, Pfanzagl V, Basselet P, Weiler J, Hintersteiner M, Morrissey DV, Meisner-Kober NC (2013) The rough endoplasmatic reticulum is a central nucleation site of siRNA-mediated RNA silencing. EMBO J 32: 1115–1127 [DOI] [PMC free article] [PubMed] [Google Scholar]
- Strohmaier H, Spruck CH, Kaiser P, Won KA, Sangfelt O, Reed SI (2001) Human F-box protein hCdc4 targets cyclin E for proteolysis and is mutated in a breast cancer cell line. Nature 413: 316–322 [DOI] [PubMed] [Google Scholar]
- Trajkovski M, Hausser J, Soutschek J, Bhat B, Akin A, Zavolan M, Heim MH, Stoffel M (2011) MicroRNAs 103 and 107 regulate insulin sensitivity. Nature 474: 649–653 [DOI] [PubMed] [Google Scholar]
- Wang X, Wang X (2006) Systematic identification of microRNA functions by combining target prediction and expression profiling. Nucleic Acids Res 34: 1646–1652 [DOI] [PMC free article] [PubMed] [Google Scholar]
- Wightman B, Ha I, Ruvkun G (1993) Posttranscriptional regulation of the heterochronic gene lin-14 by lin-4 mediates temporal pattern formation in C. elegans. Cell 75: 855–862 [DOI] [PubMed] [Google Scholar]
Associated Data
This section collects any data citations, data availability statements, or supplementary materials included in this article.
Supplementary Materials
Supplementary Figures S1–17, Supplementary Tables S1–2
Kinetic model to simulate and fit measured changes in mRNA and protein abundance following miR-199a transfection and induction. The file includes source code (in R) and experimental data.