Abstract
Deficits in information processing speed are among the most commonly reported impairments in multiple sclerosis (MS) and are generally assessed by evaluating mean-level performance on time-limited tests. However, this approach to assessing performance ignores potential within-subject differences in MS patients that may be useful for characterizing cognitive difficulties in MS. An alternative method of measuring performance is by examining the degree of within-subject variability, termed intra-individual variability (IIV). Intra-individual variability provides information about the characteristics of a person's performance over time and may provide novel information about cognitive functioning in MS. This study examined IIV in performance on the Computerized Test of Information Processing (CTIP) using two within-subject variability methods: individual standard deviation and coefficient of variation. Eighteen females with relapsing-remitting MS and 18 healthy female controls completed the CTIP. Consistent with previous research, MS patients demonstrated slower overall mean performance on the CTIP compared with controls, with patients becoming increasingly slower than controls as cognitive demands increased across the tasks. Furthermore, MS patients demonstrated greater IIV as measured by individual standard deviations on all subtests of the CTIP, even with mean-level group differences as well as practice and learning effects controlled. These between-group differences were not found when the coefficient of variation, a more coarse measure of within-subject variability, was used. Intra-individual variability was also found to be a better predictor of neurologic status than mean-level performance. These results suggest that IIV may provide unique insight into cognitive functioning in MS.
Cognitive impairments are highly prevalent in multiple sclerosis (MS), affecting an estimated 40% to 65% of patients.1,2 Although the type of cognitive difficulties found in MS varies with disease duration and MS disease subtype, one of the most commonly reported impairments is in information processing speed.3 Information processing speed is conceptualized as the rate at which elementary cognitive operations can be executed.4 A comprehensive understanding of difficulties with information processing speed is critical, as it has been hypothesized that processing speed deficits can contribute to impairments in memory and other higher-order cognitive functions.5
In clinical practice and in most clinical research, information processing speed is inferred from the number of test items completed or the accuracy of patients' performance on timed paper-and-pencil tests (eg, Symbol Digit Modalities Test; SDMT)6 or on tests requiring verbal responses (eg, Paced Auditory Serial Addition Test; PASAT).7 Computerized tests that provide direct measures of reaction time, such as the Computerized Test of Information Processing (CTIP),8 can provide more precise measurement of processing speed. The CTIP consists of three reaction time tests that become progressively more demanding. Mean-level differences in reaction times between MS patients and healthy controls have been found, with MS patients demonstrating overall slower response times that progressively become slower, compared with healthy controls, as the cognitive demands of the task increase.9 Similar findings have been reported for other reaction time tasks.10 However, such tests have typically been used only to evaluate differences in mean-level performance between groups and have not considered within-subject differences in performance that may be important in characterizing cognitive impairments in clinical populations such as those with MS.
An alternative approach to characterizing cognitive performance is by examining within-subject variability in response speed (ie, the fluctuation of response performance across serial trials). Within-person fluctuation in response latency on cognitive tasks, termed intra-individual variability (IIV), has been used as a measure of stability in performance.11 Low variability (ie, high consistency) indicates better performance, whereas high variability (ie, low consistency) indicates worse performance.12 Intra-individual variability can be reliably measured and is thought to reflect fairly stable endogenous factors, such as central nervous system (CNS) integrity, as opposed to situation-dependent factors such as fluctuations in stress or sleep.13,14
Intra-individual variability may be a sensitive measure of cognitive functioning in clinical populations and is proposed to be a behavioral marker of overall CNS integrity.11,15 Within-subject variability has been found to relate to cognitive and neurologic status in studies of mild dementia,14 attention deficit and hyperactivity disorder,16 Parkinson's disease, and Alzheimer's disease.17 In these studies, greater IIV was associated with worse cognitive performance or greater neurologic impairment. An association between within-subject variability and neuroimaging indices of anatomical changes in both white and gray matter has also been described for patients with frontotemporal dementia, traumatic brain injury, and mild cognitive impairment.15 These studies suggest that IIV may provide novel insight into cognitive impairment; however, it has thus far received little attention in the study of MS.
When examining IIV, it is important to dissociate systematic factors that can affect variability (eg, practice effects, learning effects, or boredom) and to ensure that differences in variability are not simply a statistical artifact of differences in individual or group mean performance.14 By controlling for these potential variables, one can begin to examine purer endogenous differences in IIV that may provide unique insight into the cognitive functioning of the individual. One method to account for the aforementioned systematic effects is to parcel out these effects using regression and then to calculate individual standard deviations (ISDs) using standardized residual scores.14 A simpler, though potentially less sensitive, method of calculating within-subject variability is to compute the coefficient of variation (COV; the standard deviation divided by the mean) for each individual. Unlike ISD, this latter technique accounts only for differences in variability that may be due to individual mean-level performance. These two approaches may provide different estimates of within-subject variability and thus may have different implications for evaluating cognitive performance in conditions such as MS.
This study aimed to investigate IIV on a computerized clinical test of information processing speed (the CTIP) in a sample of relapsing-remitting MS patients. The CTIP is a suitable task for measuring trial-by-trial variability, as it includes multiple trials of each task and records exact response times for each trial. We examined IIV on the CTIP using both ISD and COV in order to compare the potential information provided by these two approaches. We hypothesized that MS patients would demonstrate a similar pattern of decreased mean processing speed, as has been seen previously on this task.9 However, we also expected that MS patients would be more variable in their performance compared with controls. We anticipated that ISD would be more sensitive to group differences in IIV than COV, as the former method can account for systematic influences (eg, practice, learning effects, and boredom). Finally, we examined whether IIV could predict neurologic status in our sample.
Method
Participants
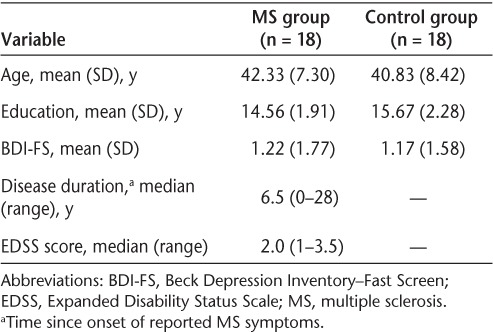
Eighteen female patients with MS and 18 healthy female control subjects participated in the study. MS participants were recruited from the Dalhousie MS Research Unit (DMSRU) during regular clinic visits. Seventeen MS participants were right-handed, and all were between 25 and 55 years of age, had been diagnosed with relapsing-remitting MS,18 and had Expanded Disability Status Scale (EDSS)19 scores between 0 and 6 (Table 1). MS participants were clinically stable at the time of the study; none had experienced a symptom relapse or had been taking corticosteroids within 3 months prior to participation. All MS participants were receiving first-line disease-modifying therapy for treatment of MS at the time of the study.20 None had comorbid neurodegenerative or psychiatric disorders or a history of substance abuse, learning disability, stroke, head trauma, or seizures. Those with a past history of depression or anxiety disorder were included if this was not an active clinical problem at the time of the study. Healthy control participants, who met the same inclusion and exclusion criteria except those related to MS, were recruited through local advertisements. All participants reported normal or corrected-to-normal vision at the time of the study.
Table 1.
Descriptive statistics for demographic variables
Procedure
All participants provided written informed consent following procedures approved by the Capital District Health Authority Research Ethics Board. Participants completed the Beck Depression Inventory–Fast Screen (BDI-FS)21 as well as the CTIP in a quiet room with the same administrator and were compensated $20 for completing the study.
Instruments
Disability
Disability was measured with the EDSS.19 EDSS scores were obtained from the medical record of the MS participant's most recent DMSRU clinic visit prior to completing the study (ie, within 2 weeks of participating in the study).
Depression
Depression symptoms were measured using the BDI-FS.21 Depression is highly prevalent in MS and can affect performance on cognitive tasks.22,23 The BDI-FS provides a measure of depression not confounded with neurologic symptoms and has been validated for use with individuals with MS.24
Computerized Test of Information Processing (CTIP)
The CTIP8 was used to measure information processing speed. The CTIP includes three reaction time subtests that become progressively more demanding: 1) a simple reaction time (SRT) task in which participants are asked to press the spacebar as soon as a single “X” appears on the screen, 2) a choice reaction time (CRT) task in which participants are presented with either the word “DUCK” or the word “KITE” and are asked to press the right key (ie, “/”) for the former and the left key (ie, “z”) for the latter, and 3) a semantic search reaction time (SSRT) task in which participants are asked to decide if a specific word belongs to a category. On each trial, one of four semantic categories is presented at random (Weapon, Furniture, Bird, or Fruit), and 2 seconds later a word appears below the category. The participants are asked to press the right key (ie, “/”) if the word belongs to the category and the left key (ie, “z”) if it does not belong to the category. Each task includes 10 practice trials and 30 test trials (total CTIP duration of 10–15 minutes).
Results
Demographics
Demographic variables for the MS and control groups are presented in Table 1. The two groups were matched on age (F1,34 = 0.326, P = .572) and years of education (F1,34 = 2.511, P = .122) and did not differ on their self-reported symptoms of depression (F1,34 = 0.01, P = .921). Because no differences in depressive symptoms between the two groups were found, this variable was excluded from further analyses. For MS participants, the median EDSS score was 2.0 (range, 1–3.5), and the median duration of disease as measured in years since onset of reported MS symptoms was 6.5 (range, 0–28).
Mean-Level Performance on CTIP
Accuracy information is not available for the SRT. The groups did not differ on number of errors on the CRT (F1,34 = 0.168, P = .684) or the SSRT (F1,34 = 0.373, P = .546). On the CRT, mean (SD) number of errors was 0.44 (0.86) for the MS group and 0.33 (0.77) for the control group. On the SSRT, mean (SD) number of errors was 0.94 (1.30) for the MS group and 0.72 (0.83) for the control group.
Group mean reaction time scores on each CTIP sub-test are shown in Figure 1. A repeated-measures analysis of variance (ANOVA) with CTIP subtest as the within-subject variable and Group as the between-subject variable was used to analyze the mean reaction time scores; the Greenhouse-Geiser correction was applied. This analysis revealed that reaction times increased as the tasks became more cognitively demanding (Test: F1.5,50.5 = 289.77, P < .001) and that the MS group had significantly longer reaction times than controls (Group: F1,34 = 16.01, P < .001). In addition, the reaction times of the MS participants diverged increasingly from those of controls as the subtests became more difficult (Test × Group: F1.5,50.5 = 4.03, P = .035). A series of one-way ANOVAs revealed that MS participants had significantly longer reaction times than controls on each subtest of the CTIP (CRT: F1,34 = 11.31, P = .002; SRT: F1,34 = 12.78, P = .001; SSRT: F1,34 = 10.93, P = .002). MS participants demonstrated slower reaction times even when the potential influences of motor abilities on processing speed were controlled (ie, mean reaction times from the SRT were subtracted from CRT and SSRT; CRT: F1,34 = 6.63, P = .015; SSRT: F1,34 = 9.63, P = .004).
Figure 1.
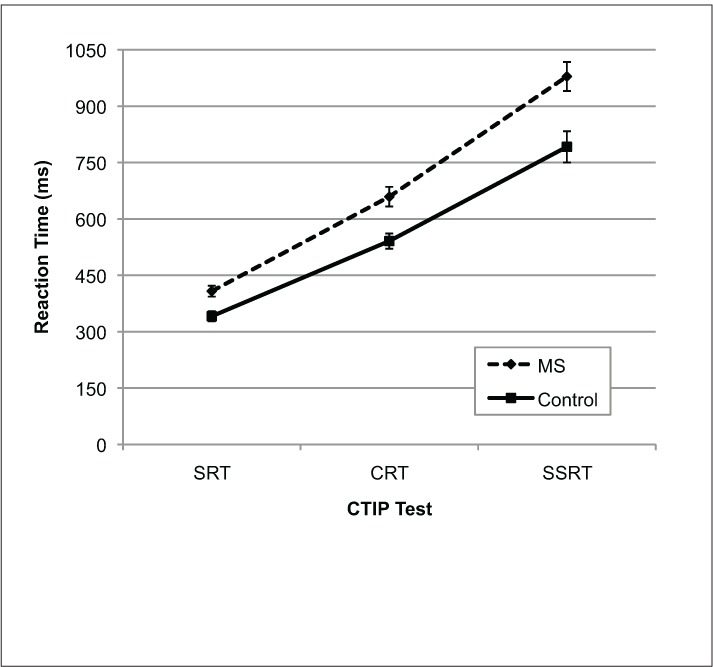
Mean reaction times for MS participants and controls on the three CTIP tests
Error bars represent standard error. CRT, choice reaction time; CTIP, Computerized Test of Information Processing; SRT, simple reaction time; SSRT, semantic search reaction time.
Variability on CTIP
Intra-individual variability was measured by calculating ISDs for all participants. Only correct trials were used for this calculation, and the data were screened for extreme values (ie, 3 SDs from the mean of each group). This represents a conservative approach to calculating IIV, as removing extreme values will likely reduce the amount of within-subject variability.14,17 To avoid statistical issues associated with unequal and missing trials, group-level mean values were imputed for missing data (<5% of the total data). Systematic differences in reaction time due to trial as well as mean-level differences in reaction time associated with group membership were parceled from the data using a regression with group and trial information entered as independent variables.14 Then, standardized residual scores were converted to T scores to allow for comparisons across tasks, and an ISD score was calculated for each participant. In addition to ISD, COVs (standard deviation of reaction time divided by mean reaction time and multiplied by 100) were calculated for correct trials for each participant. This approach eliminates the impact of the individuals' mean-level differences on standard deviation and provides an alternative measure of within-person variability. Both ISDs and COVs were compared using a series of ANOVAs.
ISD
Group ISDs on each CTIP test are shown in Figure 2. A repeated-measures ANOVA revealed that overall IIV increased with subtest difficulty (Test: F2,68 = 5.3, P = .007) and that MS participants were more variable in their performance (Group: F1,34 = 20.02, P < .001). However, no significant group by test interaction was found (Test × Group: F2,68 = 0.340, P = .71). A series of one-way ANOVAs revealed that MS participants were significantly more variable than controls on each subtest of the CTIP (CRT: F1,34 =14.16, P = .001; SRT: F1,34 =9.70, P = .004; SSRT: F1,34 = 14.26, P = .001). MS participants had greater variability even when the potential influences of motor abilities on processing speed were controlled (ie, SRT performance was regressed from CRT and SSRT ISD scores; CRT: F1,34 = 10.48, P = .003; SSRT: F1,34 = 14.01, P = .001).
Figure 2.
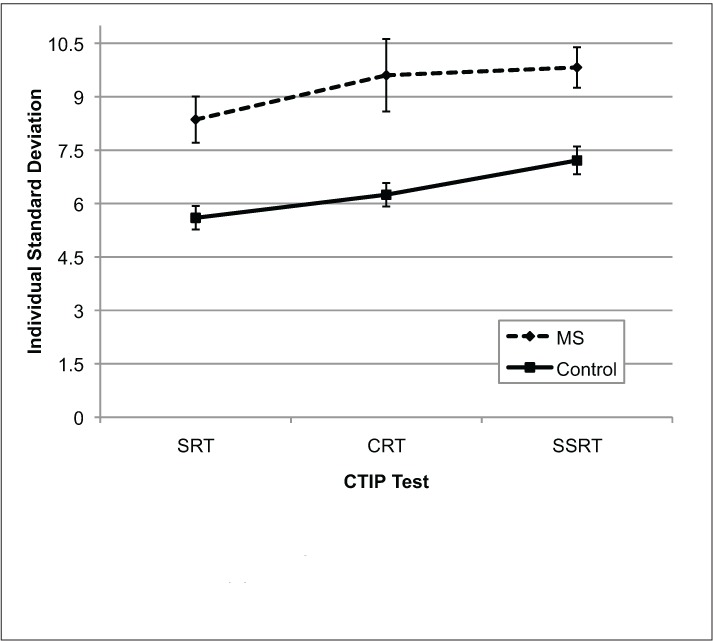
Mean individual standard deviations for MS participants and controls on the three CTIP tests
Error bars represent standard error. CRT, choice reaction time; CTIP, Computerized Test of Information Processing; SRT, simple reaction time; SSRT, semantic search reaction time.
COV
Group COVs on each test are shown in Figure 3. A repeated-measures ANOVA revealed that COVs also increased with test difficulty (Test: F2,68 = 13.38, P < .001). However, MS participants were not found to be more variable in their performance (Group: F1,34 = 3.20, P = .08), nor was there a significant group by test interaction (Test × Group: F2,68 = 1.146, P = .324) when COV was examined. A series of one-way ANOVAs revealed that MS participants did not have greater COVs compared with controls on any of the CTIP subtests (SRT: F1,34 = 3.53, P = .069; CRT: F1,34 = 0.01, P = .921; SSRT: F1,34 = 2.54, P = .120).
Figure 3.
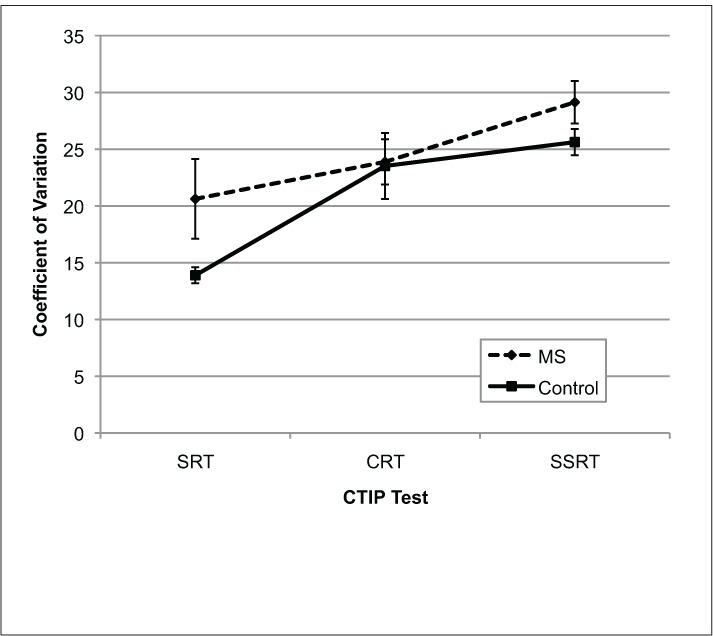
Mean coefficient of variation for MS participants and controls on the three CTIP tests
Error bars represent standard error. CRT, choice reaction time; CTIP, Computerized Test of Information Processing; SRT, simple reaction time; SSRT, semantic search reaction time.
Predicting Group Membership Using Mean Reaction Time and Variability
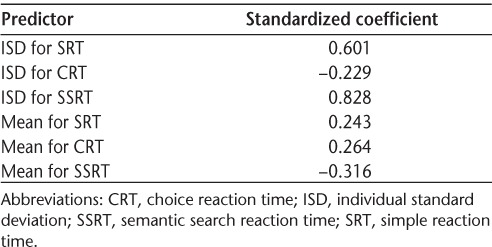
We examined the unique contributions of mean performance and IIV on predicting group membership using a discriminant function analysis. Mean reaction time and ISD scores for each CTIP task were included simultaneously in the analysis to determine which of these variables could best predict whether a participant belonged to the MS group or the control group. We did not include COVs of each CTIP subtest given that no significant differences between groups were found. The combined information about mean-level performance and IIV successfully predicted group membership (Wilks Λ = 0.54, χ26 [N = 36] = 19.138, P = .004) and correctly classified 83.3% of all cases. Table 2 presents the standardized weights of each predictor. These results indicate that ISD scores on the SSRT (β = 0.83) and the SRT (β = 0.60) were the best predictors for identifying whether a subject belonged to the MS group or the control group.
Table 2.
Standardized coefficients of predictor variables of the discriminant function
Discussion
Deficits in information processing speed are among the most commonly reported cognitive difficulties in MS.3 This study examined an alternative approach to characterizing information processing speed by measuring IIV in response speed on the CTIP in a sample of MS patients and healthy controls. To our knowledge, this study represents the first investigation of within-subject variability on the CTIP in MS.
As shown previously by Tombaugh and colleagues,9 we found that MS patients demonstrated slowing in mean response time on all three CTIP subtests compared with healthy controls, despite being equally accurate in their performance. In addition, we found that MS patients' response speed became increasingly slower than that of controls on the more cognitively demanding subtest (ie, SSRT; Figure 1). The consistency of these findings with previous reports in MS suggests that the CTIP may be a reliable clinical measure of processing speed deficits in this disease.
In addition to slowed information processing, the MS patients also demonstrated greater IIV in their response speed when ISDs were examined. A significant difference in variability emerged even though mean-level group differences in response time and effects of practice, learning, and boredom were controlled. Differences in variability between groups were not found when within-subject variability was calculated using COVs. This likely occurred because COVs solely account for differences in variability due to individual mean-level performance. Other factors that may influence variability such as practice effects, learning effects, boredom, and group differences in mean reaction time are not accounted for and can artificially mask or inflate true within-subject variability. Calculation of ISD as described in this study helps eliminate systematic variability caused by the aforementioned factors and produces a purer measure of variability that cannot be explained away by extraneous factors. When studied in this way, within-subject variability appears to represent a unique intrinsic characteristic of the individual that may be affected by endogenous changes in the individual's CNS integrity.14
We also sought to determine whether IIV on the CTIP contributed distinct information about cognitive performance in our sample, as compared to mean-level differences in reaction time alone. Our analysis revealed that IIV on the SSRT and SRT subtests, as measured by ISD, best predicted group membership. Mean-level differences in reaction time were not as useful in predicting neurologic status. It is noteworthy that IIV on the CRT also contributed little to the discrimination of group membership in this analysis and that MS patients showed the greatest variance in ISD on this task (Figure 2). Perhaps the greater difficulty in performing consistently on this task shown by some MS patients reflects the considerable change in task demands for this subtest. Specifically, this requires shifting from the SRT subtest, involving a unimanual response to a single target stimulus, to the CRT subtest, which requires bimanual responding based on a decision between two responses. Because the standard CTIP presents the three subtests in a set order of increasing difficulty, randomization of the subtest order was not attempted in the current study. Nevertheless, the findings do suggest that IIV, as measured by ISD, provides unique information about the neurologic status of MS patients and may provide a better indicator of cognitive functioning than mean-level response latency in relatively mildly affected patients.
Our findings of greater IIV in MS patients compared with controls is consistent with findings of greater variability in performance on reaction time tasks in other neurologic populations, such as those with traumatic brain injury, dementia, and Parkinson's disease.14,15,17 Recently in a sample of relapsing-remitting and secondary progressive MS patients, standard deviation in response time on a timed digit recognition task was also associated with greater self-reported fatigue.25 Our findings add to the accumulating literature suggesting that within-subject variability is an important component of cognitive performance and that variability may provide additional insight into the difficulties experienced in neurologic conditions, including MS. Although this study included only a relatively small sample of mildly affected relapsing-remitting MS patients, our findings clearly demonstrate the need for future research on IIV with a broader range of MS disease subtypes and disability severity. Future research examining individual response variability in other cognitive domains would also help further elucidate the function of response variability as a measure of the MS disease process.
PracticePoints.
Relapsing-remitting MS patients not only demonstrate slower information processing speed than controls but also are more variable in their performance.
Greater variability in MS performance is found even when other potential influences such as practice, learning, and group-level differences are accounted for.
Within-subject variability may provide additional insight into difficulties with information processing speed in MS.
Acknowledgments
We would like to thank the participants in this study for their time and effort as well as the staff at the DMSRU for their assistance with subject recruitment.
Footnotes
Financial Disclosures: The authors have no conflicts of interest to disclose.
Funding/Support: This research was funded by a grant from the Capital District Health Authority Research Fund. Ms. Wojtowicz is supported by a doctoral training award from the Multiple Sclerosis Society of Canada. Dr. Berrigan is the recipient of the 2011 Biogen-Idec Postdoctoral Fellowship from the Multiple Sclerosis Society of Canada.
References
- 1.Rao S, Leo G, Bernardin L, Unverzagt F. Cognitive dysfunction in multiple sclerosis: frequency, patterns, and predictions. Neurology. 1991;41:685–691. doi: 10.1212/wnl.41.5.685. [DOI] [PubMed] [Google Scholar]
- 2.Benedict RH, Cookfair D, Gavett R et al. Validity of the minimal assessment of cognitive function in multiple sclerosis. J Int Neuropsychol Soc. 2006;12:549–558. doi: 10.1017/s1355617706060723. [DOI] [PubMed] [Google Scholar]
- 3.Chiaravalloti ND, DeLuca J. Cognitive impairment in multiple sclerosis. Lancet Neurology. 2009;7:1139–1151. doi: 10.1016/S1474-4422(08)70259-X. [DOI] [PubMed] [Google Scholar]
- 4.Salthouse TA. The processing-speed theory of adult age differences in cognition. Psychol Rev. 1996;103:403–428. doi: 10.1037/0033-295x.103.3.403. [DOI] [PubMed] [Google Scholar]
- 5.DeLuca J, Chelune GJ, Tulsky DS, Lengenfelder J, Chiaravalloti ND. Is speed of processing or working memory the primary information processing deficit in multiple sclerosis? J Clin Exp Neuropsychol. 2004;26:550–562. doi: 10.1080/13803390490496641. [DOI] [PubMed] [Google Scholar]
- 6.Smith A. Symbol Digit Modalities Test: Manual. Los Angeles, CA: Western Psychological Services; 1982. [Google Scholar]
- 7.Gronwall D. Paced Auditory Serial-Addition Task: a measure of recovery from concussion. Percept Mot Skills. 1977;44:367–373. doi: 10.2466/pms.1977.44.2.367. [DOI] [PubMed] [Google Scholar]
- 8.Tombaugh TN, Rees LM. Computerized Test of Information Processing. Toronto, Canada: Multi-Health Systems Inc; 2008. [Google Scholar]
- 9.Tombaugh TN, Berrigan LI, Walker LA, Freedman MS. The Computerized Test of Information Processing (CTIP) offers an alternative to the PASAT for assessing cognitive processing speed in individuals with multiple sclerosis. Cogn Behav Neurol. 2010;23:192–198. doi: 10.1097/WNN.0b013e3181cc8bd4. [DOI] [PubMed] [Google Scholar]
- 10.Archibald CJ, Fisk JD. Information processing efficiency in patients with multiple sclerosis. J Clin Exp Neuropsychol. 2000;22:686–701. doi: 10.1076/1380-3395(200010)22:5;1-9;FT686. [DOI] [PubMed] [Google Scholar]
- 11.MacDonald SWS, Nyberg L, Backman L. Intra-individual variability in behavior: links to brain structure, neurotransmission and neuronal activity. Trends Neurosci. 2006;29:474–480. doi: 10.1016/j.tins.2006.06.011. [DOI] [PubMed] [Google Scholar]
- 12.Slifkin AB, Newell KM. Is variability in human performance a reflection of system noise? Curr Direct Psychol Sci. 1998;7:170–177. [Google Scholar]
- 13.Li S, Aggen SH, Nesselroade JR, Baltes PB. Short-term fluctuations in elderly people's sensorimotor functioning predict text and spatial memory performance: the Macarthur Successful Aging Studies. Gerontology. 2000;47:100–116. doi: 10.1159/000052782. [DOI] [PubMed] [Google Scholar]
- 14.Hultsch DF, MacDonald SWS, Hunter MA, Levy-Bencheton J, Strauss E. Intra-individual variability in cognitive performance in older adults: comparison of adults with mild dementia, adults with arthritis, and healthy adults. Neuropsychol. 2000;14:588–598. doi: 10.1037//0894-4105.14.4.588. [DOI] [PubMed] [Google Scholar]
- 15.MacDonald SWS, Li SC, Bäckman L. Neural underpinnings of within-person variability in cognitive functioning. Psychol Aging. 2009;24:792–808. doi: 10.1037/a0017798. [DOI] [PubMed] [Google Scholar]
- 16.Westerberg H, Hirvikoski T, Forssberg H, Klingberg T. Visuospatial working memory span: a sensitive measure of cognitive deficits in children with ADHD. Child Neuropsychol. 2004;10:155–161. doi: 10.1080/09297040409609806. [DOI] [PubMed] [Google Scholar]
- 17.Burton CL, Strauss E, Hultsch DF, Moll A, Hunter MA. Intra-individual variability as a marker of neurological dysfunction: a comparison of Alzheimer's disease and Parkinson's disease. J Clin Exp Neuropsychol. 2006;28:67–83. doi: 10.1080/13803390490918318. [DOI] [PubMed] [Google Scholar]
- 18.McDonald WI, Compston A, Edan G et al. Recommended diagnostic criteria for multiple sclerosis: guidelines from the International Panel on the Diagnosis of Multiple Sclerosis. Ann Neurol. 2001;50:121–127. doi: 10.1002/ana.1032. [DOI] [PubMed] [Google Scholar]
- 19.Kurtzke JF. Rating neurologic impairment in multiple sclerosis: an expanded disability status scale. Neurology. 1983;33:1444–1452. doi: 10.1212/wnl.33.11.1444. [DOI] [PubMed] [Google Scholar]
- 20.O'Connor P, Devonshire V, Canadian Network of MS Clinics. The use of disease-modifying agents in multiple sclerosis—by the Canadian network of MS clinics. Can J Neurol Sci. 2008;35:127–132. [PubMed] [Google Scholar]
- 21.Beck AT, Steer RA, Brown GK. BDI Fast Screen for Medical Patients: Manual. London, UK: The Psychological Corporation; 2000. [Google Scholar]
- 22.Korostil M, Feinstein A. Anxiety disorders and their clinical correlates in multiple sclerosis patients. Mult Scler. 2007;13:67–72. doi: 10.1177/1352458506071161. [DOI] [PubMed] [Google Scholar]
- 23.Demaree HA, Gaudino E, DeLuca J. The relationship between depressive symptoms and cognitive dysfunction in multiple sclerosis. Cogn Neuropsychiatry. 2003;8:161–171. doi: 10.1080/13546800244000265. [DOI] [PubMed] [Google Scholar]
- 24.Benedict RH, Fishman I, McClellan MM, Bakshi R, Weinstock-Guttman B. Validity of the Beck Depression Inventory-Fast Screen in multiple sclerosis. Mult Scler. 2003;9:393–396. doi: 10.1191/1352458503ms902oa. [DOI] [PubMed] [Google Scholar]
- 25.Bruce JM, Bruce AS, Arnett PA. Response variability is associated with self-reported cognitive fatigue in multiple sclerosis. Neuropsychology. 2010;24:77–83. doi: 10.1037/a0015046. [DOI] [PubMed] [Google Scholar]


