Abstract
Accumulation of central nervous system (CNS) pathology affects cognitive processing speed and efficiency and is thought to underlie attentional and executive deficits in multiple sclerosis (MS). Most clinical neuropsychological tests are multifactorial and are limited in their sensitivity to specific cognitive processes. This may, in part, account for the low to moderate correlations between clinical test results and magnetic resonance imaging (MRI) indices of brain pathology. We compared the ability of a clinical and an experimental test of cognitive processing speed to differentiate domain-specific cognitive changes in MS, and examined relations between test performance and MRI measures of brain pathology. Twelve MS patients and 12 controls completed the Paced Auditory Serial Addition Test (PASAT) and the Attention Networks Test–Interactions (ANT-I), a computerized response latency task. Subjects also had MRI scans that included T1, T2, and fluid-attenuated inversion recovery (FLAIR) sequences that provided global and localized volumetric measures. Patients made more errors on the PASAT and were slower on the ANT-I. The ANT-I also revealed specific deficits in response inhibition. In addition, ANT-I performance was associated with changes in a number of MRI measures, which was not the case for the PASAT. Reaction time paradigms that manipulate within-task demands on distinct cognitive functions may provide meaningful markers of brain disease burden in MS.
Cognitive impairment is evident in up to 70% of people with definite multiple sclerosis (MS).1 The most affected abilities include memory, attention, and executive functions.2,3 The degree of impairment varies between individuals, and it is usually manifested as poor performance on timed neuropsychological tests.4 Thus, it has been hypothesized that reduced cognitive processing speed is the fundamental cognitive deficit in MS, which either accounts for or influences the impairments seen in other cognitive abilities.5
On magnetic resonance imaging (MRI), MS patients frequently demonstrate evidence of pathology affecting thalamocortical networks involving the prefrontal cortex that are presumed to subserve attentional and executive functions.6,7 While this would be expected to result in domain-specific cognitive deficits in addition to a decline in general cognitive processing speed, the reported relationship between localized and global MRI changes and cognitive test performance in these domains has not been strong.4 Most evidence to date demonstrates small to moderate relations of total and localized brain atrophy, T2 lesion burden, and T2 fluid-attenuated inversion recovery (FLAIR)–defined lesions with broadly defined cognitive deficits.8 This likely reflects limitations in both structural MRI approaches and conventional neuropsychological tasks for understanding functional neuroanatomical relationships in MS.
Most clinical neuropsychological tests are multifactorial, and none measure response latencies directly. As such, they are limited in sensitivity to domain-specific cognitive deficits and do not adequately distinguish impairments in higher-order functions from those caused by slowed cognitive processing. Stuss and Levine9 point out that most cognitive functions consist of multiple independent processes with diffuse neuroanatomical substrates, so that it can be unclear how a specific test score is achieved. One of the most widely used tests of speed and complex attention in MS that exemplifies these limitations is the Paced Auditory Serial Addition Test (PASAT).10 In the PASAT, patients are presented with a series of 61 single-digit numbers at variable rates. They are asked to add each digit to the one that directly preceded it, and to provide the sum of the two most recent consecutive digits. The outcome of the PASAT is the number of correct responses at each presentation rate. Although numerous studies have demonstrated the PASAT's sensitivity to brain pathology, many limitations of the PASAT have been pointed out.11 These include 1) the test's dependence on a variety of cognitive abilities including attentional, executive, computational, and working memory skills, in addition to processing speed, with all summarized in a single score, precluding differentiation of domain-specific deficits; 2) the test's vulnerability to use of a “chunking” strategy that reduces task complexity without a commensurate decrease in performance12; and 3) influences of factors such as age, education, and test-related anxiety.11
Reaction time paradigms that measure response latencies in addition to performance accuracy may overcome some of these limitations and better dissociate overall slowing from domain-specific cognitive changes in MS, thereby providing stronger associations with MRI indices of brain pathology. However, to advance our understanding of cognitive deficits in MS, reaction time tasks must examine cognitive processes known to be impaired in this disorder, such as attention and executive functions. The Attention Networks Test–Interactions (ANT-I)13 has this potential.
The ANT-I is a modified version of the Attention Networks Test (ANT),14 which examines the efficiency of alerting, orienting, and “executive” attentional networks, as described by Posner and Petersen.15 Posner16 proposed an inhibitory relationship between alerting and executive networks, where higher processing and decision making are slowed when the alerting system is activated in order to enable quick responses. Interactions between these networks have been explored further by Funes and Lupiáñez,13 who described a facilitatory interaction between the executive and orienting networks, as well as by Callejas et al.,17 who demonstrated a facilitatory interaction between the alerting and orienting networks.
Previous studies have found the ANT sensitive to attentional network abnormalities in both Alzheimer's disease18 and MS.19 In this latter study, relative deficiencies were found in MS patients' alerting network performance compared with healthy controls. Some differences in response inhibition were also found, but only in the context of an alerting cue. However, a methodological limitation of the ANT is the potential confounding factor introduced by using the same visual cue (an asterisk) to define both the alerting and orienting networks.20 By contrast, the ANT-I uses separate sensory modalities for alerting (auditory) and orienting (visual). To date, ANT-I performance and its potential associations with pathological changes in MS have not yet been examined.
The objectives of this exploratory study were to compare clinical and experimental tests of cognitive processing speed and efficiency (PASAT and ANT-I) in their ability to differentiate domain-specific cognitive changes in mildly affected MS patients, and to examine relations between test performance and MRI indices of brain pathology in MS using multiple measures derived from conventional clinical MRI sequences. We hypothesized that 1) ANT-I performance would be sensitive to impairments in processing speed among mildly affected MS patients; 2) ANT-I performance would demonstrate changes in specific attentional and executive functions for MS patients; and 3) ANT-I performance would demonstrate stronger relations to MRI indices of brain pathology than the commonly used PASAT.
Methods
Ethical approval for the study was obtained from the Capital District Health Authority Research Ethics Board, and all participants provided written informed consent following the approved procedures.
Participants
Twelve female patients with MS and 12 healthy female controls participated. The MS participants were recruited from patients attending the Dalhousie MS Research Unit (DMSRU). All were right-handed, were between 25 and 55 years of age, had been diagnosed with clinically definite relapsing-remitting MS according to the Poser criteria,21 and had an Expanded Disability Status Scale (EDSS)22 score between 0 and 6. All were clinically stable, and none had experienced a symptom relapse or had taken corticosteroids within the past 3 months. Eight of the 12 MS patients were taking a first-line disease-modifying therapy,23 and none were taking other disease-modifying therapies or immunosuppressants. None had comorbid neurodegenerative or psychiatric disorders or a history of substance abuse, learning disability, stroke, head trauma, or seizures. Those with a history of depression or anxiety disorder were included if this was not an active problem at the time of the study. Healthy control participants who met the same exclusion criteria were recruited through local advertisements and were matched to patients, using the case-control method, on the basis of age (±5 years) and education (±3 years). All participants reported normal or corrected-to-normal vision.
Neuropsychological Assessments
Both the 3-second and 2-second versions of the PASAT were administered.10 The standard scoring method (ie, the total number of correct responses) as well as the “dyad” scoring method, in which only consecutive correct responses are counted, were used.12 The version of the ANT-I (Figure 1) used in this study13,17 employed a 2 (alerting) × 3 (orienting) × 2 (executive) design. It included 25 practice trials with visual feedback for correct and incorrect responses followed by 288 test trials without feedback. Participants were presented with a fixation cross in the middle of a computer screen. The alerting stimulus was a 50-ms, 2000-Hz tone that followed the interstimulus interval in half of the trials. The orienting cue was an asterisk that was presented for 50 ms in two-thirds of the trials, 100 ms after the presentation of the alerting tone (or the period when the tone would have been presented). Ninety-six trials presented a “valid cue” in the location where the stimulus would subsequently appear, while another 96 trials presented an “invalid cue” in which the asterisk was in the opposite location. The cues had only a 50% chance of predicting the subsequent target location and did not inform the subject of where the target would actually occur. The target stimulus was an arrow that appeared either above or below the fixation cross. Participants identified its direction by pressing either the “m” key (right-pointing arrow) or the “c” key (left-pointing arrow). The “executive” (or target congruency) variable was manipulated by surrounding this target arrow with two arrows of equal size on each side that pointed in either the same or the opposite direction. In half of the trials these flankers were congruent with the target direction, while in the other half they were incongruent.
Figure 1.
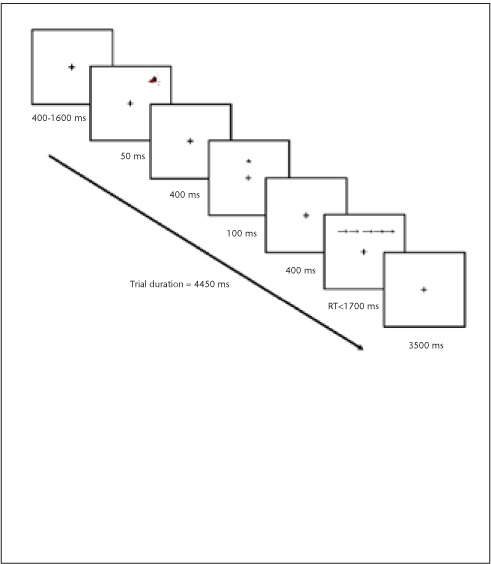
Attention Networks Test–Interactions (ANT-I)
Following a 400- to 1600-ms intertrial period, the stimulus is preceded by an alerting tone (second panel from the top) and a valid orienting cue (fourth panel from the top). The target arrow is surrounded by congruent flankers (second panel from the bottom). Trials are response-terminated. RT, reaction time.
Alerting network efficiency was evaluated by subtracting the subject's mean reaction time in conditions when the alerting tone was present from their mean reaction time when the alerting tone was absent. Orienting was evaluated by subtracting mean reaction time in the valid cue conditions from the mean reaction time in the invalid cue conditions. Executive control was measured by subtracting the mean reaction time for congruent flanker trials from the mean reaction time for incongruent flanker trials.13,17 Interactions among networks and among network scores and group were determined using two separate group (2) × alerting (2) × orienting (3) × executive (2) mixed-model analyses of variance (ANOVAs) for reaction time and accuracy data, respectively.
MR Image Acquisition
MRI scans were performed using a 1.5-T scanner (GE Healthcare, Waukesha, WI) with an eight-channel head coil. After standard three-dimensional (3D) localizer and calibration scans, the following sequences were acquired: T1-weighted 3D fast spoiled gradient recalled echo (FSPGR) of the whole brain obtained in the axial plane (echo time [TE]/repetition time [TR] = 5/25 ms, flip angle = 90°, matrix = 256 × 256, field of view = 24, thickness/gap = 1.5/0 mm, number of slices = 124, number of excitations =1), high-resolution T1-weighted, inversion recovery prepared 3D FSPGR of the thalamus obtained in the axial plane (TE/TR = 4.2/11.9 ms, inversion time [TI] = 500 ms, flip angle = 20°, matrix = 320 × 192, field of view = 24, thickness/gap = 1/0 mm, number of slices = 58, number of excitations = 3), axial T2 FLAIR (TE/TR = 120/8000 ms, matrix = 256 × 224, field of view = 24, thickness/gap = 3/0 mm, number of slices = 56, number of excitations = 2), and axial T2-weighted fast recovery fast spin echo (FRFSE) (TE/TR = 102/6375 ms, matrix = 256 × 224, thickness/gap = 3/0 mm, number of slices = 56, number of excitations = 2).
Anatomical measures derived from these images included total brain volume, volumes of cortical gray matter, subcortical tissue, and ventricular cerebrospinal fluid (CSF), bilateral thalamic volumes, area of the corpus callosum, and volume of the white matter hyper-intensities (WMHI) on T2-weighted FLAIR. Images were analyzed with AFNI24 and FSL25 software packages using semi-automated procedures. Brain extraction and tissue type classification for WMHI analyses and for quantification of cortical gray matter and subcortical tissue, including white matter and subcortical gray matter structures, were performed using Brain Extraction Tool (BET) and the FAST tissue segmentation tool in FSL. The masks were manually corrected to remove non-brain tissue. Area of the corpus callosum was manually traced on the mid-sagittal slice. Thalamic tracing was performed separately for the right and left hemispheres. Anatomical boundaries of the thalamus were defined in three dimensions and included lateral ventricles on the axial plane (anterior boundary), body of the lateral ventricle (superior boundary), superior colliculus on the axial plane (inferior boundary), and posterior aspect of the body of the lateral ventricle (posterior boundary). Because significant atrophy was not observed, and none of our groups differed in total parenchymal volume, raw volumetric measures were expressed as percentages of total brain tissue derived using BET.
Statistical Data Analysis
Cognitive measures were analyzed for differences between the control and MS groups using mixed-model ANOVAs followed by planned independent-samples t tests. The groups were then compared on the MRI anatomical measures using independent-samples t tests. In order to evaluate relations between cognitive measures and MRI indices of brain pathology, hierarchical cluster analysis (HCA) was used to divide the MS group into two subgroups (“MR-mild” and “MR-abnormal”) using those volumetric variables that differed between MS and control groups on pairwise comparisons. HCA was performed using the between-group linkage cluster method and squared Euclidean distances to generate solutions. The variables were standardized to a scale from 0 to 1 to adjust for differences in scaling. The output components used to evaluate the solution included agglomeration schedule, cluster membership table, icicle plots, and dendrogram plots. Clusters were joined using the BAVERAGE method. The number of clusters was set to two, in order to determine which MS patients would “cluster” with the controls and which would form a distinct subgroup on the basis of the relevant MR variables. The three groups, control participants and the two resulting MS subgroups, were then compared on their PASAT and ANT-I performance using mixed-model ANOVAs and planned independent-samples t tests. The HCA approach of determining associations between cognitive test performance and MRI indices of brain pathology was selected rather than correlation coefficients because of the small sample size and the ability to consider multiple MRI variables simultaneously.
Results were not adjusted for multiple comparisons to avoid concealing findings requiring further investigation in future studies. For all of the analyses, the threshold for statistical significance was set at the commonly accepted P value of less than or equal to .05. In addition, differences that attained P values between .06 and .09 were considered as potentially warranting further study and are reported as “marginal” differences. The groups were matched on demographic variables, and outlier removal was not performed.
Results
Demographic information for the MS and control groups is provided in Table 1. The groups did not differ significantly in terms of age or years of education. Average performance on cognitive tests for the control and MS groups and the effect sizes for between-group comparisons are presented in Table 2. For the PASAT, the total number of correct responses and the number of correct response dyads were each analyzed in two separate group (2) × presentation rate (2) mixed-model ANOVAs. Both revealed main effects of group (F1,22 = 8.92, P = .007; F1,22 = 10.62, P = .004) and presentation rate (F1,22 = 100.38, P < .0001; F1,22 = 103.20, P < .0001), but no interaction. Planned between-group comparisons using independent-samples t tests revealed that on both 3- and 2-second presentation rates the MS group made significantly fewer correct responses (t22= −2.71, P = .01; t22 = −2.95, P = .007) as well as fewer correct response dyads (t22 = −2.91, P = .008; t22 = −3.31, P = .003).
Table 1.
Demographic information
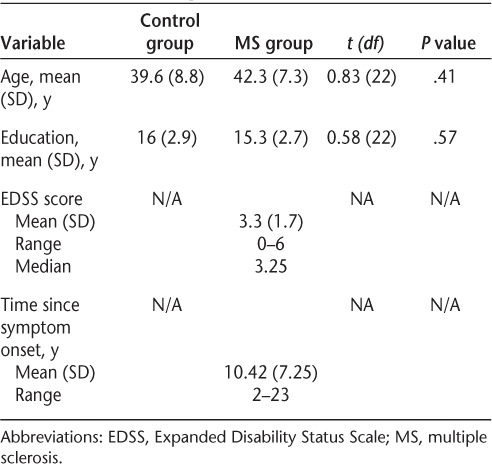
Table 2.
PASAT and ANT-I scores for the control and MS groups
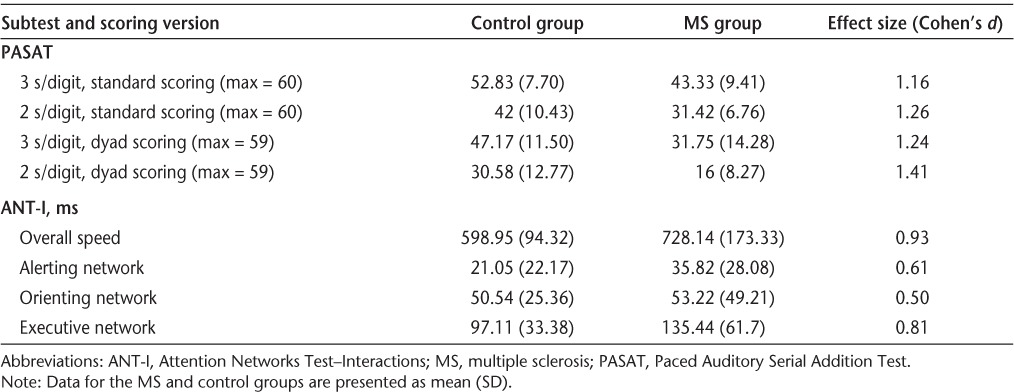
ANT-I reaction time data were first analyzed using network scores that indicate the efficiency of the three networks individually.20 Independent-samples t tests comparing the MS and control groups revealed no difference for the alerting and orienting networks but a marginally greater executive network effect for the MS group (t22 = 1.89, P = .07). Next, a group (2) × alerting (2) × orienting (3) × executive (2) mixed-model ANOVA for mean reaction time revealed a main effect of group (F1,22 = 5.62, P = .03), with MS patients demonstrating slower overall performance. There was also a significant three-way interaction of group, alerting, and executive networks (F2,22 = 4.73, P = .04), with MS patients demonstrating an increased executive network effect on the alerted trials, which was not the case for the controls.
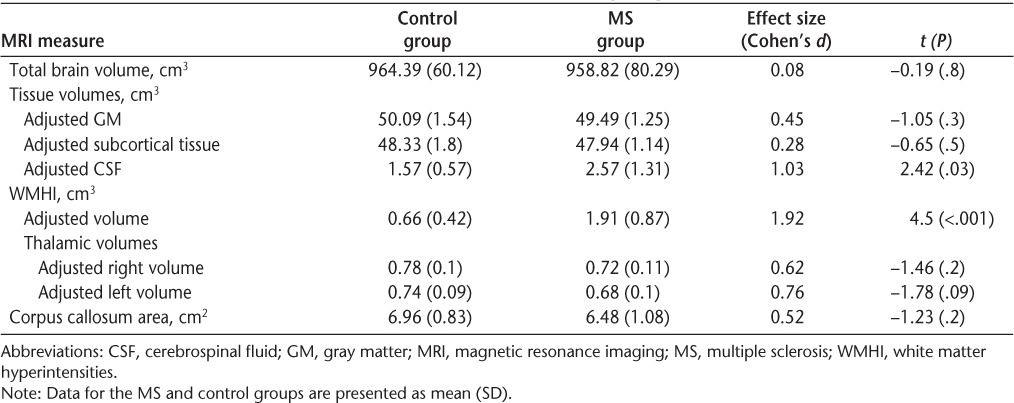
Between-group differences in MRI volumetric measures are shown in Table 3. MS patients demonstrated significantly greater WMHI volumes and ventricular CSF volumes compared with controls as well as marginally reduced left thalamic volumes. To further subdivide the MS group, HCA of the subject sample was performed. A combination of WMHI volumes, ventricular CSF volumes, and thalamic volumes yielded the best two-cluster solution that identified all control participants as a single group and classified the MS group into two relatively equal subgroups. HCA yielded “MR-mild” (n = 7) and “MR-abnormal” (n = 5) subgroups of MS patients that differed in severity of visible disease burden/neurologic damage but did not differ in age, years of education, EDSS scores, time since symptom onset, and time since diagnosis. Four participants in each subgroup were taking disease-modifying therapies.
Table 3.
Volumetric MRI measures for the control and MS groups
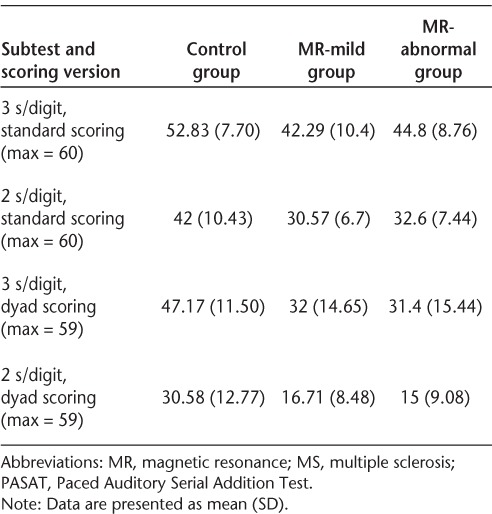
Average PASAT performance for the controls and MS subgroups is presented in Table 4. Total number of correct PASAT responses and number of correct dyads were analyzed in two separate group (3) × presentation rate (2) mixed-model ANOVAs. Once again, both revealed main effects of presentation rate (F1,21= 87.5, P = .0001; F1,21 = 86.09, P = .0001) and group (F2,21 = 4.41, P = .03; F2,21 = 5.09, P = .02), but no interaction. The control group and both MS subgroups obtained significantly higher scores on the 3-second version of the PASAT regardless of the scoring method (t[control,standard]11 = 7.07, P < .0001; t[control,dyad]11 = 8.63, P < .0001; t[MR-mild,standard]6 = 5.94, P = .001; t[MR-mild,dyad]6 = 4.21, P = .006; t[MR-abnormal,standard]4 = 3.79, P = .02; t[MR-abnormal,dyad]4 = 4.28, P = .01). At both presentation rates the controls made significantly more correct responses (t[3-second]17 = 2.59, P = .02; t[2-second]17 = 2.54, P = .02) and had more correct dyads (t[3-second]17 = 2.51, P = .02; t[2-second]17 = 2.55, P = .02) than the “MR-mild” MS subgroup. The control group also had significantly more correct response dyads than the “MR-abnormal” subgroup (t[3-second]15 = 2.34, P = .03; t[2-second]15 = 2.46, P = .03), although the differences between these two groups for total correct responses were marginal (t[3-second]15 = 1.89, P = .08; t[2-second]15 = 1.82, P = .09). The two MS subgroups did not differ on number of correct responses or number of correct response dyads for either presentation rate.
Table 4.
PASAT scores for the control group and the two MS subgroups
ANT-I network scores for each group were compared using independent-samples t tests. These revealed a significantly greater executive network effect for the “MR-abnormal” MS subgroup compared with the control group (t15 = −2.36, P = .03) (μms = 164.77 ms [SD = 88.46]; μcontrol = 97.11 ms [SD= 33.38]) (Figure 2). A subsequent group (3) × alerting (2) × cueing (3) × flanker congruency (2) mixed-model ANOVA using mean reaction time scores revealed a main effect of group (F2,21= 7.96, P = .003). Planned pairwise comparisons demonstrated that the “MR-abnormal” MS subgroup was significantly slower on all ANT-I conditions compared with both controls (P = .001) and the “MR-mild” MS subgroup (P = .001). This ANOVA also yielded a significant three-way interaction between alerting and executive network effects and group (F2,21 = 8.78, P = .002). As Figure 3 demonstrates, the executive network effect for both MS groups was smaller in unalerted trials than in trials preceded by an alerting tone. This difference was attenuated for the “MR-mild” group relative to the “MR-abnormal” group. The executive network effect for the control group was the same in both alerting conditions.
Figure 2.
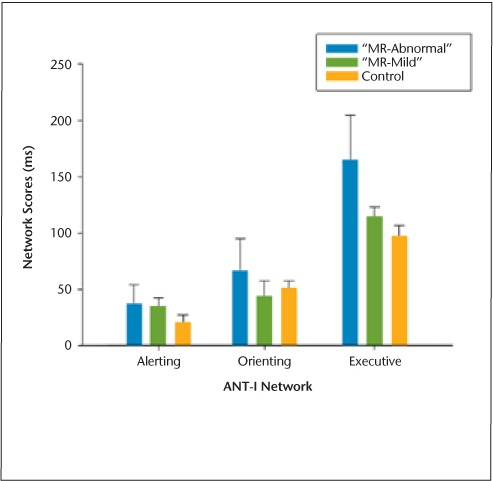
Attention Networks Test–Interactions (ANT-I): mean individual network scores
Figure 3.
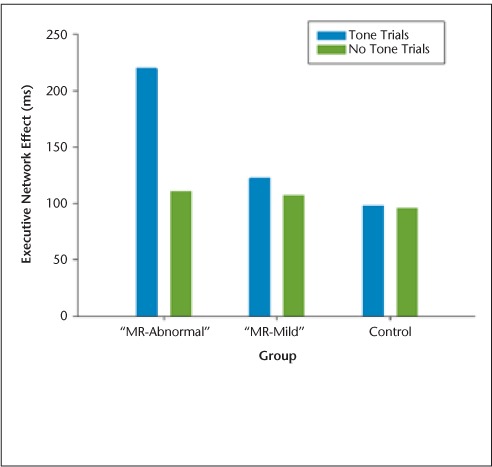
Attention Networks Test–Interactions (ANT-I): three-way interaction between alerting and executive networks and group
Discussion
This study examined the ability of clinical and experimental tests of cognitive processing speed and efficiency (PASAT and ANT-I) to differentiate domain-specific cognitive changes in MS patients and examined their relations with MRI indices of brain pathology. Both tests were sensitive to MS-related cognitive impairments. Although the PASAT successfully differentiated between patient and control groups using both standard and dyad scoring approaches, it remains unclear whether this reflected differences in MS patients' processing speed, computational, attentional, or working memory abilities.11 On the ANT-I, MS patients and controls differed not only in their speed of performance, but also in their attention network scores. In particular, MS patients demonstrated a marginal decrease in efficiency of their executive attentional network that was exacerbated by the presence of an alerting tone.
Using the ANT, an earlier version of the ANT-I, Urbanek et al.19 also reported a deficit in response inhibition for MS patients that became significant only in the presence of an alerting cue. We did not see orienting or alerting network effects in our study but rather an inefficiency of the executive network that may represent a diminished capacity to cope with conflicting demands on attentional resources when in an alerted state.13,17 This is consistent with other studies that have suggested an impairment of “top-down attentional control” among MS patients, such as that of McCarthy et al.26 Thus, while the effect sizes for the PASAT were larger than those for the ANT-I, emphasizing the PASAT's greater sensitivity to MS-related cognitive dysfunction, the ANT-I identified impairment of specific cognitive processes that was beyond any generalized slowing in processing speed.
Comparisons among the MS subgroups as defined by structural MRI pathological indices revealed differences in ANT-I performance that were not seen for the PASAT. On the ANT-I, the “MR-abnormal” MS subgroup was slower than both the “MR-mild” subgroup and the controls across all 12 conditions. In addition, the “MR-abnormal” subgroup demonstrated a significant executive network effect that was further modulated by alertness. This interaction between alerting and executive networks was less pronounced in the “MR-mild” subgroup and virtually absent in controls.
Both the alerting and executive attention networks are thought to be functionally associated with various regions of the frontal lobes, with the former primarily localized to the superior frontal lobe and the latter to the cingulate gyrus and the lateral prefrontal cortex.27 Both networks are presumed to rely on the integrity of thalamocortical projections to the frontal cortex.7 Various studies have emphasized the importance of the thalamus in the executive attentional network and in mediating the interactions among networks, such as that of Cifelli et al.6 This is consistent with our findings that MS patients with greatest evidence of MRI pathology on a composite index that included thalamic atrophy, white matter lesion volume, and ventricular volume showed the greatest difficulty with executive control of attentional resources, in addition to general slowing in cognitive processing speed.
Current findings suggest promise for the use of the ANT-I as a cognitive measure that reflects pathological change or progression in MS. As this was an initial study, our sampling criteria were restricted and included only mildly affected female patients. Confirmation of our findings in a larger and more representative MS sample is necessary before any conclusions regarding the generalizability of the results can be made. The small sample size and lack of correction for multiple comparisons in statistical analyses, while appropriate for an exploratory study, also call for caution when interpreting the findings. While our data were appropriately prepared and screened for HCA assumptions, the results would be more robust and representative with a larger sample size. Despite its limitations, this study did include a well-matched control sample, and MS patients differed from controls on tests of cognitive processing speed and efficiency with large effect sizes (ie, Cohen's d > 0.80). Moreover, while the effect sizes for ANT-I network and interaction scores were lower than that of the PASAT when comparing MS patients and controls, only the ANT-I provided measures that were associated with differences in visible MS-related pathology on standard MRI.
The ANT-I remains a novel test, and much remains to be learned regarding its potential use. For example, while the attentional networks examined by the ANT-I are presumed to reflect the integrity of specific neuroanatomical networks, further studies should confirm relations between ANT-I performance and pathological changes in these neuroanatomical regions. Examination of the reliability of the ANT-I and its responsiveness to changes in MS-related brain pathology over time are also necessary to fully explore its utility as a clinical task. Finally, the sensitivity of the ANT-I to factors such as fatigue and low mood within a representative MS sample has yet to be determined. Efforts to establish new tests for clinical use are substantial but are necessary to develop theoretically sound methods by which to measure the important cognitive changes affecting complex disorders such as MS. The current study suggests that the ANT-I may have the potential for further development for clinical use as a task of cognitive processing speed and efficiency in MS patients.
PracticePoints.
Impairments in top-down attentional processes and executive functions are direct consequences of MS pathology independent of slowed cognitive processing speed.
Common clinical tests of cognitive processing speed and efficiency, such as the Paced Auditory Serial Addition Test (PASAT), have limited ability to differentiate impairments in speed from independent impairments in higher-order functions.
Tests such as the Attention Networks Test–Interactions (ANT-I) that directly measure response speed and vary within-task demands on distinct cognitive functions may be useful adjuncts to clinical testing.
More precise measures of cognitive efficiency that differentiate impairments in speed from attentional processes and executive functions, like the ANT-I, may better demonstrate the relations between cognitive performance and magnetic resonance imaging indices of MS pathology.
Acknowledgments
We are grateful to Trudy Campbell and the staff at the Dalhousie MS Research Unit for their assistance with subject selection. Thanks are also due to Mark Given, Matthew Rogers, and Gregory McLean for assistance with image acquisition; to Amy MacKenzie, Jeremy De Jong, and Carl Helmick for assistance with image analysis; and to Yoko Ishigami for creating the Attention Networks Test figure (Figure 1).
Footnotes
Financial Disclosures: The authors have no conflicts of interest to disclose.
Funding/Support: This study was supported by grants from the Multiple Sclerosis Society of Canada and the Capital District Health Authority Research Fund. Dr. Omisade was supported by a studentship from the Multiple Sclerosis Society of Canada.
References
- 1.Achiron A, Barak Y. Cognitive impairment in probable multiple sclerosis. J Neurol Neurosurg Psychiatry. 2003;74:443–446. doi: 10.1136/jnnp.74.4.443. [DOI] [PMC free article] [PubMed] [Google Scholar]
- 2.Benedict RH, Zivadinov R. Risk factors for and management of cognitive dysfunction in multiple sclerosis. Nat Rev Neurol. 2011;7:332–342. doi: 10.1038/nrneurol.2011.61. [DOI] [PubMed] [Google Scholar]
- 3.Arnett PA, Rao SM, Grafman J et al. Executive functions in multiple sclerosis: an analysis of temporal ordering, semantic encoding, and planning abilities. Neuropsychology. 1997;11:535–544. doi: 10.1037//0894-4105.11.4.535. [DOI] [PubMed] [Google Scholar]
- 4.Rao SM. Cognitive function in patients with MS. Int J MS Care. 2004;6:9–22. [Google Scholar]
- 5.Bergendal G, Fredrikson S, Almkvist O. Selective decline in information processing in subgroups of multiple sclerosis: an 8-year longitudinal study. Eur Neurol. 2007;57:193–202. doi: 10.1159/000099158. [DOI] [PubMed] [Google Scholar]
- 6.Cifelli A, Arridge M, Jezzard P, Esiri M, Palace J, Matthews PM. Thalamic neurodegeneration in multiple sclerosis. Ann Neurol. 2002;52:650–653. doi: 10.1002/ana.10326. [DOI] [PubMed] [Google Scholar]
- 7.Fernandez-Duque D, Posner MI. Brain imaging of attentional networks in normal and pathological states. J Clin Exp Neuropsychol. 2001;23:74–93. doi: 10.1076/jcen.23.1.74.1217. [DOI] [PubMed] [Google Scholar]
- 8.Benedict RH, Weinstock-Guttman B, Fishman I, Sharma J, Tjoa CW, Bakshi R. Prediction of neuropsychological impairment in multiple sclerosis. Arch Neurol. 2004;61:226–230. doi: 10.1001/archneur.61.2.226. [DOI] [PubMed] [Google Scholar]
- 9.Stuss DT, Levine B. Adult clinical neuropsychology: lessons from studies of the frontal lobes. Annu Rev Psychol. 2002;53:401–433. doi: 10.1146/annurev.psych.53.100901.135220. [DOI] [PubMed] [Google Scholar]
- 10.Gronwall DMA. Paced serial auditory addition task: a measure of recovery from concussion. Percept Mot Skill. 1977;53:103–110. doi: 10.2466/pms.1977.44.2.367. [DOI] [PubMed] [Google Scholar]
- 11.Tombaugh T. A comprehensive review of the Paced Auditory Serial Addition Test (PASAT) Arch Clin Neuropsychol. 2006;21:53–76. doi: 10.1016/j.acn.2005.07.006. [DOI] [PubMed] [Google Scholar]
- 12.Fisk JD, Archibald CJ. Limitations of the Paced Auditory Serial Addition Test as a measure of working memory in patients with multiple sclerosis. J Int Neuropsychol Soc. 2001;7:363–372. doi: 10.1017/s1355617701733103. [DOI] [PubMed] [Google Scholar]
- 13.Callejas A, Lupiáñez J, Tudela P. The three attentional networks: on their independence and interactions. Brain Cognition. 2004;54:225–227. doi: 10.1016/j.bandc.2004.02.012. [DOI] [PubMed] [Google Scholar]
- 14.Fan J, McCandliss D, Sommer T, Raz A, Posner M. Testing the efficiency and independence of attentional networks. J Cogn Neurosci. 2002;14:340–347. doi: 10.1162/089892902317361886. [DOI] [PubMed] [Google Scholar]
- 15.Posner MI, Petersen SE. The attention system of the human brain. Annu Rev Neurosci. 1990;13:25–42. doi: 10.1146/annurev.ne.13.030190.000325. [DOI] [PubMed] [Google Scholar]
- 16.Posner MI. Attention: the mechanisms of consciousness. Proc Natl Acad Sci U S A. 1994;91:7398–7403. doi: 10.1073/pnas.91.16.7398. [DOI] [PMC free article] [PubMed] [Google Scholar]
- 17.Callejas A, Lupiáñez J, Funes MJ, Tudela P. Modulations among the alerting, orienting and executive control networks. Exp Brain Res. 2005;167:27–37. doi: 10.1007/s00221-005-2365-z. [DOI] [PubMed] [Google Scholar]
- 18.Fernandez-Duque D, Black SE. Attentional networks in normal ageing and Alzheimer's disease. Neuropsychology. 2006;20:133–143. doi: 10.1037/0894-4105.20.2.133. [DOI] [PubMed] [Google Scholar]
- 19.Urbanek C, Weinges-Evers N, Bellmann-Strobl J et al. Attention Network Test reveals alerting network dysfunction in multiple sclerosis. Mult Scler. 2010;16:93–99. doi: 10.1177/1352458509350308. [DOI] [PubMed] [Google Scholar]
- 20.Ishigami Y, Klein R. Repeated measurement of the components of attention using two versions of the Attention Network Test (ANT): stability, isolability, robustness, and reliability. J Neurosci Methods. 2010;190:117–128. doi: 10.1016/j.jneumeth.2010.04.019. [DOI] [PubMed] [Google Scholar]
- 21.Poser CM, Paty D, Scheinberg L et al. New diagnostic criteria for multiple sclerosis: guidelines for research protocols. Ann Neurol. 1983;13:227–231. doi: 10.1002/ana.410130302. [DOI] [PubMed] [Google Scholar]
- 22.Kurtzke JF. Rating neurologic impairment in multiple sclerosis: an expanded disability status scale. Neurology. 1983;33:1444–1452. doi: 10.1212/wnl.33.11.1444. [DOI] [PubMed] [Google Scholar]
- 23.O'Connor P, Devonshire V, Canadian Network of MS Clinics. The use of disease-modifying agents in multiple sclerosis—by the Canadian network of MS clinics. Can J Neurol Sci. 2008;35:127–132. [PubMed] [Google Scholar]
- 24.Cox RW. AFNI: software for analysis and visualization of functional magnetic resonance neuroimages. Comp Biomed Res. 1996;29:162–173. doi: 10.1006/cbmr.1996.0014. [DOI] [PubMed] [Google Scholar]
- 25.Zhang Y, Brady M, Smith S. Segmentation of brain MR images through a hidden Markov Random Field model and the expectation-maximization algorithm. IEEE Trans Med Imaging. 2001;20:45–57. doi: 10.1109/42.906424. [DOI] [PubMed] [Google Scholar]
- 26.McCarthy M, Beaumont JG, Thompson R, Peacock S. Modality-specific aspects of sustained and divided attentional performance in multiple sclerosis. Arch Clin Neuropsychol. 2005;20:705–718. doi: 10.1016/j.acn.2005.04.007. [DOI] [PubMed] [Google Scholar]
- 27.Fan J, Posner M. Human attentional networks. Psychiatr Prax. 2004;31(S2):210–214. doi: 10.1055/s-2004-828484. [DOI] [PubMed] [Google Scholar]


