Abstract
Purpose.
To investigate the impact on through-focus retinal image quality and visual performance of apodizing the pupil's transmission function in combination with extended depth of focus presbyopic corrections, such as spherical aberration (SA).
Methods.
Through-focus retinal image quality was determined theoretically for various magnitudes of pupil transmission apodization and Zernike primary SA (−0.5 to +0.5 μm) for a 4-mm pupil. The impact of pupil transmission apodization was also assessed psychophysically with a vision simulator equipped with a liquid crystal spatial light modulator for controlling pupil transmission. Through-focus visual acuity (VA) was measured with and without apodization in three cyclopleged subjects from distance to near with monochromatic light (550 nm) under two multifocal aberration conditions. Phase plates induced +0.2 and −0.2 μm of SA over a 4-mm artificial pupil. A baseline condition of zero SA was also included for comparison.
Results.
The theoretical investigation showed that pupil transmission apodization significantly improved distance image quality in the presence of positive and negative SA. Retinal image quality at all target vergences for negative SA conditions was improved by apodization. Pupil transmission apodization improved through-focus VA by 0.1 to 0.2 logMAR at intermediate and near object distances for the zero and negative SA conditions. In the positive SA condition, apodization degraded VA by approximately 0.1 logMAR at intermediate object distances.
Conclusions.
Pupil transmission apodization had a significant impact on though-focus visual performance. Pupil transmission apodization affects through-focus retinal image quality by diminishing the relative contribution to the retinal image from the peripheral region of the wavefront aberration. Through-focus visual performance in presbyopic eyes with negative SA was improved due to pupil transmission apodization.
Keywords: pupil transmission apodization, presbyopia, aberrations, spherical aberration
Pupil transmission apodization affects through-focus retinal image quality in eyes with extended depth-of-focus presbyopic corrections.
Introduction
Many presbyopes choose to extend their eye's depth of focus in order to regain spectacle independence for far and near vision. Many strategies exist for extending the eye's depth of focus (i.e., pseudoaccommodation), such as diffractive and refractive multifocal corrections. Diffractive multifocals split light at a given point in the pupil to both far and near foci1–3 and are typically implemented with intraocular lenses. Alternatively, refractive multifocals use separate zones of the lens aperture to allocate light to distinct foci (e.g., far, intermediate, and near), thereby inducing higher-order wavefront aberrations, such as spherical aberration (SA). Refractive multifocal corrections have been implemented with intraocular lenses,1,4 contact lenses,5 presbyopic refractive surgery,6,7 and refractive corneal inlays.8,9
The common principle of diffractive and refractive multifocal presbyopic corrections is the simultaneous superposition of far and near foci at the retina.10 Although these methods alleviate the symptoms of presbyopes' inability to accommodate and reduce spectacle dependence, they also lead to reduced contrast sensitivity11,12 and photic phenomena, such as halos and glare.13,14 These factors can cause significant visual problems for patients with multifocal corrections, especially in low light levels (e.g., night driving).
Extended depth-of-focus presbyopic corrections typically modify the phase of the pupil's wavefront to achieve multifocality. However, altering the transmission function of the eye offers an additional degree of freedom with which to optimize through-focus retinal image quality. It is well-known that decreasing the pupil size lessens the impact of defocus on retinal image quality15,16 and the small-aperture approach has recently been applied to contact lenses17,18 and corneal inlays19–21 as a correction for presbyopia. However, the decrease in light reaching the retina and the degradation in distance image quality due to the increased diffraction effect are significant limitations of this technique.22 In a study comparing the small-aperture approach to aberration induction with SA, Hickenbotham et al.22 concluded that both strategies were viable options for increasing presbyopic depth of focus; however, applying both methods simultaneously was not investigated.
The Stiles-Crawford effect is a mechanism intrinsic to the eye that reduces sensitivity to light from the periphery of the pupil.23,24 This arises from the alignment of retinal wave-guiding photoreceptors to the central region of the pupil. Despite its retinal origin, the Stiles-Crawford effect can be described as an apodization of the pupil's transmission with a Gaussian-type function defined as
 |
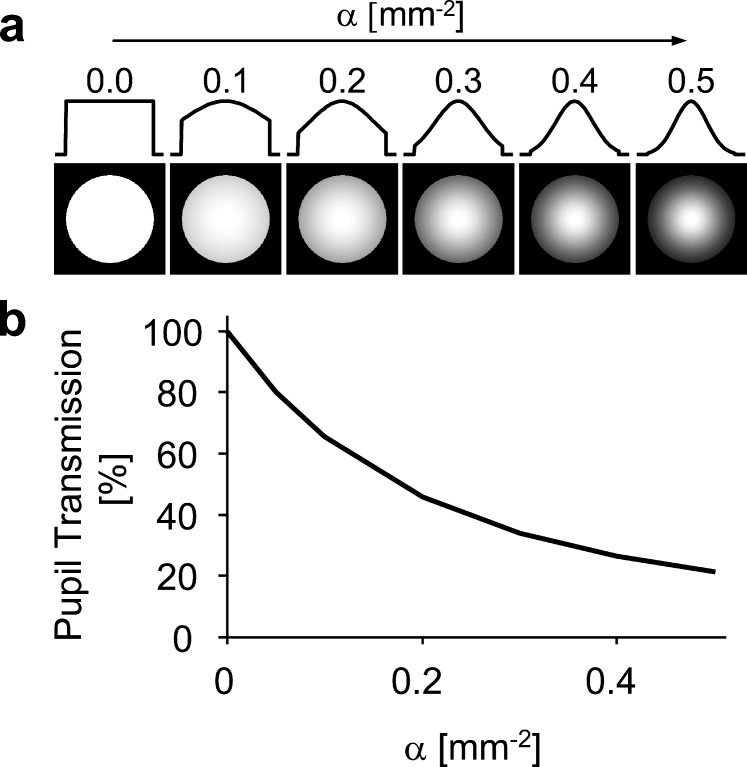
where r is the pupil radius and α is the apodization coefficient. Figure 1a illustrates the pupil's transmission profile as a function of the apodization coefficient. In a large-scale study, Applegate and Lakshminarayanan24 found the average α-value to be approximately 0.05 mm−2, resulting in attenuation of roughly 37%, 65%, and 84% at the margin of a 4-, 6-, and 8-mm diameter pupil, respectively. The attenuation of light rays from the pupil's periphery has been shown to have a significant impact on retinal image quality.25–28
Figure 1.
(a) Intensity transmission profiles of a 4-mm pupil with varying degrees of the apodization coefficient (α). (b) Pupillary intensity transmission as a function of apodization.
The potential benefits of the Stiles-Crawford effect on retinal image quality are greater with increasing pupil size and likewise are minor for pupils smaller than approximately 4-mm diameter.26,28 Unfortunately, a reduction in pupil size (senile miosis) accompanies the age-related loss of accommodation29 and presbyopic pupil sizes common to everyday viewing conditions at photopic light levels vary between 3 and 5 mm.30,31 Due to senile miosis, under normal conditions the presbyopic population typically has a pupil too small for the Stiles-Crawford effect to significantly affect retinal image quality.
Therefore, we can expect the reintroduction of pupil transmission apodization within a 4-mm pupil will improve through-focus retinal image quality of the monofocal eye. However, in the presence of high levels of positive SA, pupil transmission apodization may decrease through-focus retinal image quality by reducing the contribution of the high plus powers at the pupil's periphery required to see at near vergences. Previous to this investigation, few studies have examined the impact on through-focus retinal image quality of combining various magnitudes of phase and transmission manipulation of the pupil for presbyopic correction. In the current study, the pupil's phase and transmission profiles were modified with Zernike primary SA and pupil transmission apodization, respectively. Through-focus visual performance also was assessed under representative optical conditions using a vision simulator equipped with a liquid crystal spatial light modulator for the manipulation of the pupil's transmission profile.
Methods
Subjects
The University of Rochester Research Review board approved this research and informed consent was obtained from all subjects before participation. All procedures involving human subjects were in accordance with the tenets of the Declaration of Helsinki. Three normal emmetropic subjects participated in this study (age: 28 ± 1 years) and were well experienced in psychophysical experiments. Subjects' dominant eye was dilated and accommodation was paralyzed32 with cyclopentolate hydrochloride (1%). Over a 4-mm pupil, the magnitude of subjects' native higher-order root-mean-square (RMS; 0.09 ± 0.02 μm) and Zernike primary SA (0.03 ± 0.02 μm) were in the normal range for age-matched subjects reported in the literature.33 Ocular dominance was determined with the “hole-in-card” sighting test.34 Although the subjects were younger than the typical presbyope, their accommodation was fully impaired due to cycloplegia.
Theoretical Retinal Image Quality
Through-focus retinal image quality was evaluated theoretically from 0.0 to +3.0 diopters (D) with the image convolution–based retinal image quality metric35 using a custom-developed program (MATLAB; MathWorks, Natick, MA). This study followed the sign convention of positive diopters indicating near-target vergences. Aside from the induced defocus and Zernike primary SA, the model eye was otherwise free of higher-order aberrations.
The retinal image quality metric was computed by first calculating the monochromatic point spread function (λ = 550 nm) from the wavefront aberration over a 4-mm pupil for each target vergence (i.e., level of defocus). The point spread function was then convolved with a reference image to produce a simulated retinal image. The final metric value was given by the correlation coefficient of the reference (unaberrated) and convolved (aberrated) images. The reference image consisted of a letter chart composed of Snellen letter E's ranging in size from 20/40 to 20/15.
To generalize the impact of apodization, through-focus retinal image quality was assessed with apodization coefficients (α) ranging from 0.0 to 0.5 mm−2, which are illustrated in Figure 1a. Figure 1b shows the intensity transmission of a 4-mm pupil with varying degrees of the apodization coefficient (α). In addition, Zernike primary SA was varied from −0.5 to +0.5 μm in increments of 0.05 μm (over a 4-mm pupil) for each level of apodization. For each value of SA, peak image quality was optimized at distance (0 D) by adding the appropriate level of defocus.35
Through-focus visual benefit was defined as the percent change in the retinal image quality metric due to apodization at each target vergence. Therefore, at a given target vergence, a visual benefit greater than 0 signifies the percent improvement in retinal image quality due to apodization. Conversely, a visual benefit less than 0 signifies the percent degradation in retinal image quality due to apodization.
Vision Simulator
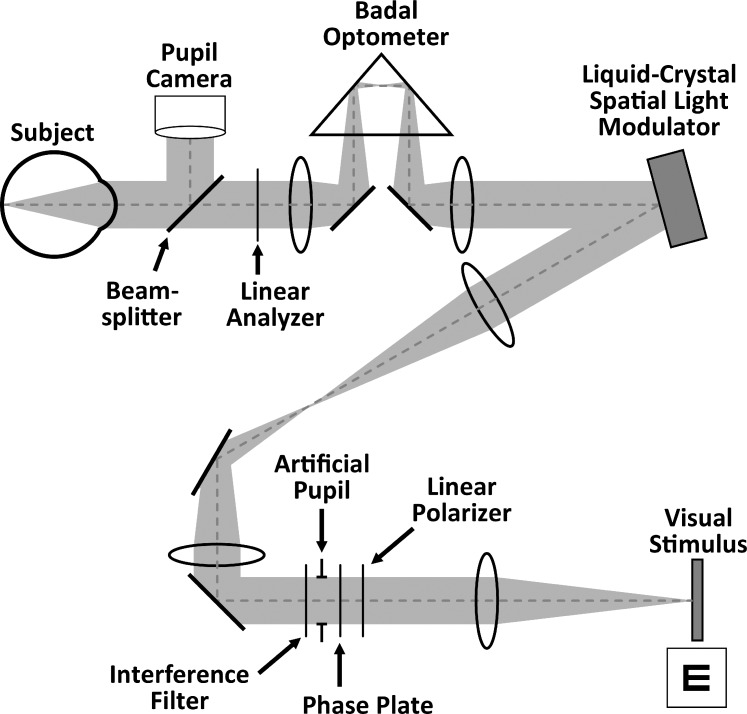
A vision simulator was used to measure monocular through-focus visual performance in subjects while manipulating their pupil transmission and wavefront aberrations. As shown in Figure 2, the system was composed of a liquid-crystal-on-silicon spatial light modulator (X10468; Hamamatsu Photonics, Hamamatsu City, Japan), a linear polarizer and analyzer (Edmund Optics, Barrington, NJ), an artificial pupil, a phase plate for wavefront aberration induction, a Badal optometer, and a visual stimulus display (LightCommander; Texas Instruments, Dallas, TX) for vision testing. The spatial light modulator alters a beam's intensity profile by locally rotating the plane of polarization before the beam is directed to a linear analyzer. The transmission through the linear analyzer is determined by the relative orientation of its transmission axis with the polarization of the incident beam. The Badal optometer was used to control target vergence for through-focus vision testing. Subjects' head movements were stabilized with a dental-impression bite bar mounted to a three-axis translational stage. Pupil alignment was continuously maintained and monitored with a pupil camera focused at the eye's pupil plane.
Figure 2.
Schematic of vision simulator.
Through-Focus Visual Performance
Through-focus visual performance was measured monocularly in the dominant eye under three aberration conditions using a fixed 4-mm artificial pupil. Each aberration condition was tested with and without pupil transmission apodization (α = 0.30 and 0.0 mm−2, respectively), for a total of six testing conditions. The aberration conditions included an induction of +0.2, −0.2, and 0 μm of Zernike primary SA in addition to subjects' native higher-order aberrations (over a 4-mm pupil). Subjects' cylindrical refraction was corrected with a trial frame.
Monocular visual performance was assessed with high-contrast visual acuity (VA). Visual acuity was measured with a tumbling letter “E” using a four-alternate forced-choice method. An eye-patch occluded the nontest eye. The visual stimulus display was conjugated to the retina and was viewed through a fixed 4-mm artificial pupil. A psychometric function based on 35 trials was obtained using the QUEST36 algorithm, in which acuity was defined as the letter size for which 62.5% of responses were correct. Three VA measurements were averaged for each optical condition and are represented in units of the logarithm of the minimum angle of resolution (logMAR) in arc minutes. The stimulus subtended a visual angle of 2 degrees and was rendered monochromatic (λ = 550 ± 5 nm) with an interference filter. As shown in Figure 1b, pupil transmission apodization has a significant impact on the stimulus luminance. Therefore, neutral density filters were used to match the stimulus luminance to 8.5 cd/m2 for all conditions. Depth of focus was defined as the defocus range with VA better than 0.18 logMAR (corresponding to 20/30 Snellen).
For each testing condition, subjects optimized their distance (0 D) image quality using the Badal optometer while viewing a 20/40 Snellen letter “E.” Through-focus acuity was obtained from distance (0 D) to near (3 D) in 1-D increments. Testing conditions and target vergences were randomized to avoid short-term blur adaptation.37 A paired t-test was used for each SA value and target vergence to determine if pupil transmission apodization had a significant impact on VA.
Results
Theoretical Retinal Image Quality
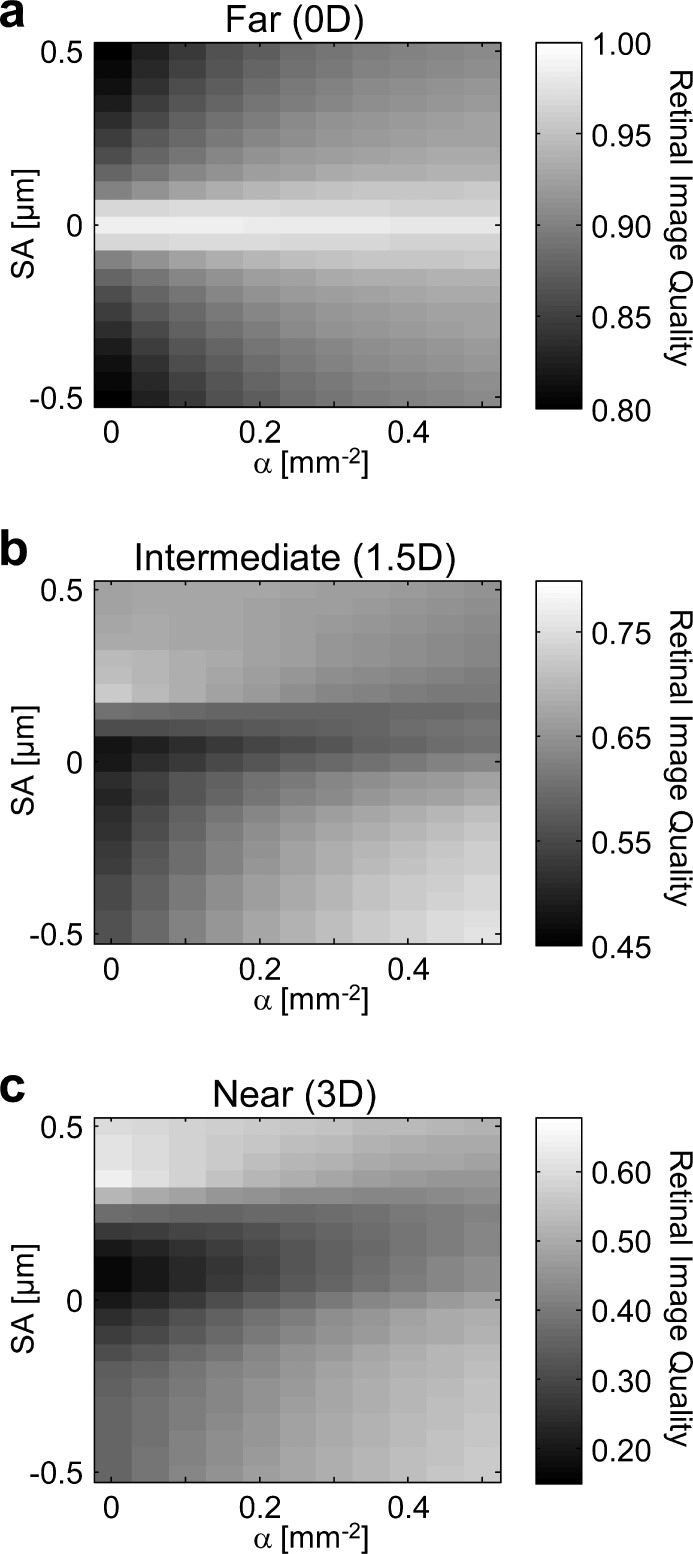
The interaction of apodization and SA on retinal image quality at far (0 D), intermediate (1.5 D), and near (3 D) target vergences is shown in Figures 3a, 3b, and 3c, respectively. Retinal image quality is indicated by the grayscale values. At distance (Fig. 3a), as expected, retinal image quality was degraded as the magnitude of SA increased. Positive and negative SA had an equivalent impact on distance image quality, as indicated by the horizontal symmetry of Figure 3a.
Figure 3.
Theoretical retinal image quality at (a) 0-, (b) 1.5-, and (c) 3.0-D target vergences. The apodization coefficient a is varied along the x-axis and Zernike primary SA is varied along the y-axis.
For the diffraction-limited case (SA = 0 μm), pupil transmission apodization had a negative impact on distance image quality, due to the broadening of the Airy disk's central lobe.38 However, as opposed to reducing pupil size, apodization does not decrease the spatial cutoff frequency of the optical transfer function. As the magnitudes of positive and negative SA surpassed ±0.05 μm, distance image quality improved with pupil transmission apodization.
In the absence of pupil transmission apodization (α = 0.0 mm−2), intermediate and near image quality were maximum with positive SA (SA = 0.20 and 0.35 μm, respectively). However, as pupil transmission apodization increased, intermediate and near image quality progressively worsened with positive SA. Interestingly, pupil transmission apodization had the opposite effect for negative SA, and improved intermediate and near image quality.
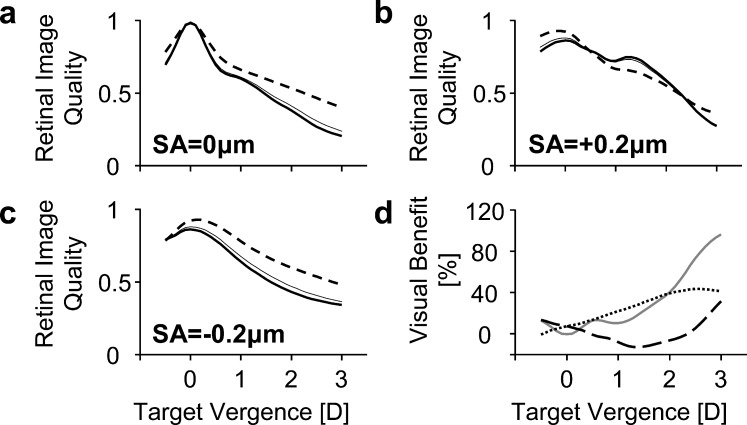
Through-focus retinal image quality with SA = 0, +0.2, and −0.2 μm is shown in Figures 4a, 4b, and 4c, respectively, for pupil transmission apodization magnitudes of α = 0.0 (thick solid lines) and 0.30 mm−2 (dashed lines). For comparison, the Stiles-Crawford effect (α = 0.05 mm−2) is also shown in Figures 4a through 4c (thin solid lines). Figure 4d shows the through-focus visual benefit due to pupil transmission apodization (α = 0.30 mm−2), with 0 (grey solid line), +0.2 (black dashed line), and −0.2 μm (black dotted line) of Zernike primary SA. Through-focus retinal image quality and visual benefit are plotted as a function of target vergence (D), where increasing diopters indicate a nearer object.
Figure 4.
Theoretical through-focus retinal image quality for various amounts of SA with (dashed line, α = 0.3 mm−2) and without (thick solid line, α = 0 mm−2) pupil transmission apodization. The thin solid line refers to apodization due to the Stiles-Crawford effect (α = 0.05 mm−2). (a–c) refer to SA values of 0, +0.2, and −0.2 μm for a 4-mm pupil, respectively. (d) shows the through-focus visual benefit of apodization (α = 0.3 mm−2) for 0 μm (solid gray line), +0.2 μm (large dashed line), and −0.2 μm (dotted line) of SA. At each target vergence, positive values refer to an improvement in retinal image quality due to apodization whereas negative values refer to a degradation.
For the aberration-free condition shown in Figure 4a, apodization of α = 0.30 mm−2 had a positive impact on through-focus retinal image quality, particularly for intermediate and near target vergences. At 1.5 and 3 D, pupil transmission apodization resulted in a visual benefit of 22.4% and 96.5%, respectively.
In the presence of positive SA (+0.2 μm), shown in Figure 4b, apodization of α = 0.30 mm−2 improved distance image quality by 7.3%. However, through-focus retinal image quality degraded for intermediate and near target vergences between 0.5 and 2.3 D. The maximum degradation (of 12.9%) occurred at 1.4 D. Beyond 2.3 D, pupil transmission apodization of α = 0.30 mm−2 improved through-focus retinal image quality.
In the case of negative SA (−0.2 μm), shown in Figure 4c, pupil transmission apodization of α = 0.30 mm−2 improved image quality at all distances by 7.3% at 0 D, 30.5% at 1.5 D, and 41.4% at 3 D.
Through-Focus Visual Performance
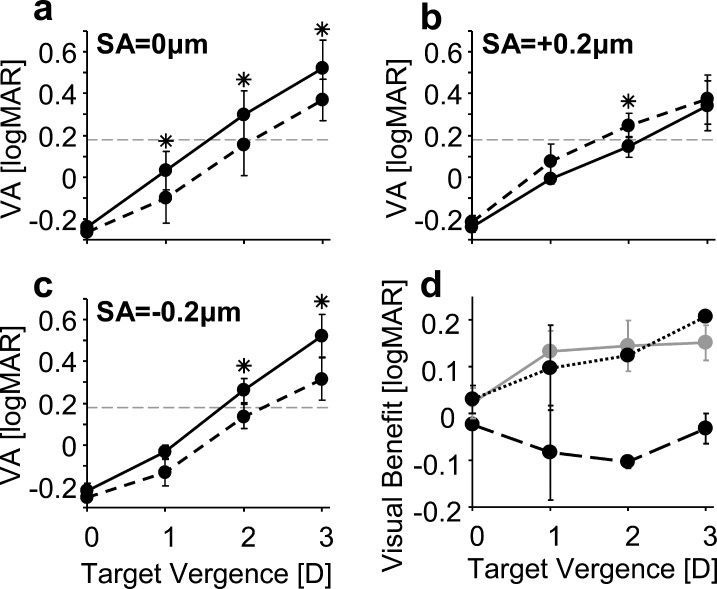
Average through-focus VA for all subjects is shown in Figures 5a through 5c, where solid and dashed lines correspond to α = 0.0 and 0.30 mm−2 pupil transmission apodization conditions, respectively. The error bars represent 1 SD of the subjects' VA. Visual benefit (Fig. 5d) was quantified at each target vergence by taking the difference of VA with and without apodization for the magnitudes of induced SA. Asterisks denote a statistically significant difference (P < 0.05) between VA with and without pupil transmission apodization at given values of SA and target vergence.
Figure 5.
Average through-focus VA for various amounts of SA with (dashed line, α = 0.3 mm−2) and without (solid line, α = 0 mm−2) pupil transmission apodization. (a–c) refer to SA values of 0, +0.2, and −0.2 μm for a 4-mm pupil, respectively. The gray dashed line in (a–c) indicates the depth of focus criterion. (d) shows the average through-focus visual benefit in VA of apodization for 0 μm (solid gray line), +0.2 μm (large dashed line), and −0.2 μm (dotted line) of SA. Positive values refer to an improvement in VA due to apodization, whereas negative values refer to a degradation. Error bars refer to 1 SD.
For all the SA conditions, distance VA was approximately −0.2 logMAR and not significantly affected by SA or apodization. In the SA = 0 μm condition, apodizing the pupil resulted in a significant visual benefit of approximately 1.5 lines at target vergences of 1 to 3 D.
The sign of the SA induction had a significant impact on whether apodization improved or worsened through-focus VA. As predicted by the theoretical investigation, through-focus VA was improved due to apodization for negative SA; however, degraded with positive SA. With positive SA, apodization degraded VA by approximately one line at 1- and 2-D target vergences; however, did not have a significant impact at 0 and 3 D. With negative SA, apodization resulted in a visual benefit of approximately one line of acuity at 1- and 2-D target vergences, and two lines at 3 D.
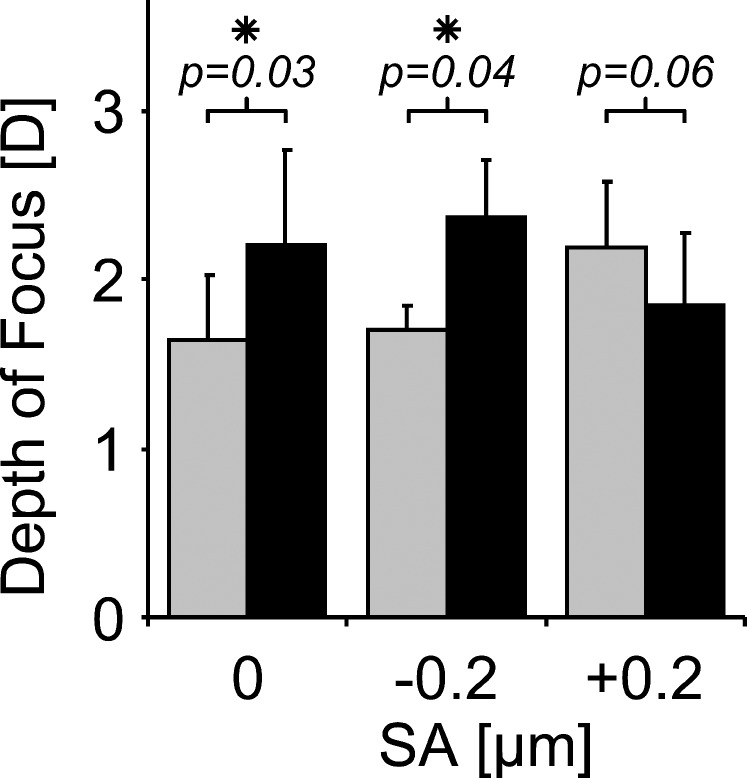
As shown in Figure 6, in the absence of SA induction, the depth of focus was 1.65 ± 0.38 and 2.21 ± 0.56 D without (α = 0.0 mm−2) and with (α = 0.3 mm−2) pupil transmission apodization, respectively. In the SA = −0.2 μm condition, the depth of focus was 1.70 ± 0.14 and 2.37 ± 0.34 D without (α = 0.0 mm−2) and with (α = 0.3 mm−2) pupil transmission apodization, respectively. For the SA = +0.2 μm condition, pupil transmission apodization decreased the depth of focus from 2.19 ± 0.40 to 1.85 ± 0.42 D.
Figure 6.
Average depth of focus measured from through-focus VA (20/30 threshold) for various amounts of SA with no pupil transmission apodization (gray bars, α = 0.0 mm−2) and with pupil transmission apodization (black bars, α = 0.3 mm−2).
Discussion
This investigation found that through-focus retinal image quality and VA in presbyopic eyes were significantly impacted by the combination of high levels of pupil transmission apodization and SA. Furthermore, the interaction of the transmission profile of the pupil with the eye's wavefront aberrations may be beneficial or detrimental to visual performance, depending on the type of ocular aberrations present. We found that apodization was beneficial for through-focus retinal image quality and VA for presbyopic eyes with monofocal and negative SA-induced multifocal corrections. In contrast, apodization had a negative impact on through-focus retinal image quality and VA in presbyopic eyes with large magnitudes of positive SA.
To understand the mechanism behind this study's observations, it is beneficial to consider the distribution of refractive power, Φ(r), across a distance-optimized pupil with Zernike primary SA. It is well known that induction of Zernike primary SA causes a defocus shift in peak image quality.35,39–43 For example, induction of positive Zernike primary SA causes a hyperopic shift in best focus, whereas an induction of negative Zernike primary SA causes a myopic shift. The Zernike defocus coefficient C20 required to optimize peak image quality may be determined computationally35,39,43 or psychophysically.40,41 In this study, C20 was determined by optimizing the retinal image quality metric at distance (0 D). The power distribution is obtained from the expression for the distance-optimized wavefront with Zernike primary SA, as shown below:
 |
where
 |
 |
where r is the radial pupil coordinate, R is the radius of the maximum pupil size, C40 and C20 are the coefficients of Zernike primary SA and defocus (in μm), respectively, and Z40(ρ) and Z20(ρ) are the Zernike polynomials for primary SA and defocus, respectively.
The expression for the refractive power distribution,44,45 Φ(r), is shown below:
 |
Substituting equation 4 into equation 5, we obtain the final expression for the refractive power distribution, Φ(r), across a pupil with SA and defocus:
 |
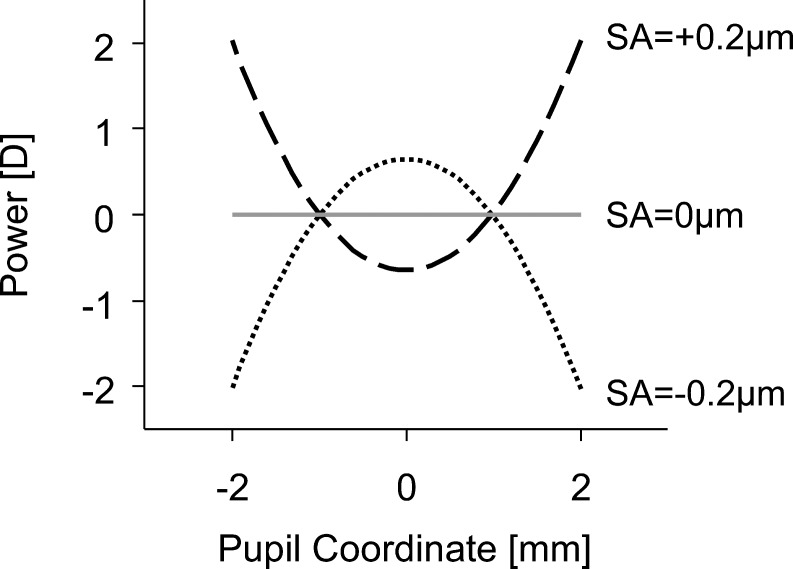
The defocus shift caused by induction of SA, referred to above, is represented by the constant C20 term in Equation 6. Figure 7 illustrates the distance-optimized power distribution, Φ(r), for a 4-mm pupil with C40 = ±0.2 μm. The sign convention is such that positive values of defocus along the y-axis denote near-add powers.
Figure 7.
Distribution of refractive power across the pupil for 0 μm (solid gray line), +0.2 μm (large dashed line), and −0.2 μm (dotted line) of SA.
SA has a parabolic distribution of power across the pupil,43,45 as illustrated in Figure 7. Positive SA is defined as rays in the pupil periphery having a larger refractive power than central rays (i.e., periphery contributing to near vision). Alternatively, negative SA is defined as rays in the pupil periphery having less refractive power than central rays. Hence the eye's properties of pupil miosis and a negative shift in SA during accommodative effort46,47 work together to improve near image quality.48
By apodizing the pupil with a Gaussian-type function, the pupil's peripheral rays have lower transmission relative to the central pupil. Therefore, the peripheral rays are penalized and have a reduced contribution to the retinal image. As shown in Figure 7, the pupil's periphery contains the near-add powers for positive SA, similar to center-distance multifocal presbyopic corrections. As a result, through-focus retinal image quality and VA with positive SA worsens with apodization, particularly at intermediate and near target vergences. In contrast, negative SA (comparable to center-near multifocal presbyopic corrections) undergoes an attenuation of rays contributing to distance with apodization, thereby improving intermediate and near retinal image quality.
Although SA is predominantly positive in the normal, phakic population,33,49,50 there are circumstances that can cause the eye's SA to reverse sign. For example, hyperopic refractive surgery,51,52 contact lenses,53 aspheric54,55 and multifocal intraocular lenses,2,56 and more recently, some refractive intracorneal inlays have been shown to induce significant magnitudes of negative SA. Although SA is known to increase the eye's depth of focus35,54,57 (Fig. 6), it also reduces contrast sensitivity58,59 and leads to photic phenomena, such as halos and glare.60 Photic phenomena constitute a major reason for patient dissatisfaction with extended depth-of-focus intraocular lenses.61,62 As shown in this investigation, pupil transmission apodization yields a visual benefit for through-focus retinal image quality, and therefore may aid in overcoming limitations of current presbyopic corrections. The impact of pupil transmission apodization on glare sensitivity will be important to address in future studies.
Our findings are in agreement with previous studies.26–28,63 Zhang et al.,26 Atchison et al.,27 and Mino and Okano63 reported apodization to significantly increase the through-focus range of non–phase-reversed spatial frequencies. Phase effects are particularly important to visual tasks relying on stimuli with a broad spatial frequency bandwidth,64 as in normal viewing conditions. Atchison et al.28 illustrated the improvement in blurred image quality due to apodization with images convolved with the point spread function. Correcting the phase effects (i.e., phase-rectification) caused by optical defocus significantly improves VA.65,66 Although apodization does not phase-rectify the retinal image, apodization does improve through-focus retinal image quality by shifting the first phase reversal of the optical transfer function to higher spatial frequencies.
The accurate prediction of through-focus visual performance from theoretical retinal image quality metrics is important for the design and optimization of ophthalmic lenses with extended depth of focus, such as presbyopic corrections and myopia control techniques.67 Similar to previous studies,35,68 through-focus VA was well predicted by the image convolution–based image-quality metric (R2 = 0.85). For comparison, other common retinal image quality metrics were also evaluated, such as the log of the visual Strehl ratio (VSOTF), log of the area under the modulation transfer function (aMTF), and wavefront RMS. The coefficients of determination (R2) of through-focus VA with all test conditions and log(VSOTF), log(aMTF), and wavefront RMS were 0.63, 0.74, and 0.71, respectively.
Quantifying the eye's depth of focus is subject to numerous factors that may influence the final outcome (for a detailed review, see Wang and Ciuffreda69). For example, previous studies40,70 that defined depth of focus using both positive and negative defocus values (e.g., full-width half-maximum of an image quality metric) found that SA had a similar impact on depth of focus regardless of its sign. In this study, image quality was optimized at distance and only positive defocus values (i.e., near objects) were tested to recreate realistic conditions. Under these circumstances, positive SA led to a larger increase in depth of focus as compared with negative SA. However, as shown in Figure 6, apodizing the pupil's transmission function had a significant impact on depth of focus.
A limitation of this study was that all optical conditions were matched in target luminance with the purpose of isolating retinal sensitivity from optical effects. Had the conditions not been luminance-matched, apodization would have reduced the retinal illuminance by approximately 60% (Fig. 1). Despite the retinal cone photoreceptors' more than four orders of magnitude of gain control for photopic vision,71 the reduction in retinal illuminance is well known to affect visual performance72,73 and may be clinically significant, especially at low light levels. However, further investigation is needed to determine if pupil transmission apodization is safe and acceptable.
For future study, it will be of interest to examine the effect of pupil transmission apodization on diffractive multifocal intraocular lenses' through-focus image quality. Diffractive multifocals have become a widely accepted option for clinicians aiming to restore functional near vision in presbyopes. Based on the results of this study, we can expect pupil transmission apodization to improve through-focus image quality with diffractive multifocal corrections.
Conclusions
Pupil transmission apodization was found to have a significant impact on through-focus visual performance. Pupil transmission apodization affects through-focus retinal image quality by diminishing the relative contribution to the retinal image from the peripheral region of the wavefront aberration. Through-focus visual performance in presbyopic eyes with negative SA was improved due to pupil transmission apodization.
Acknowledgments
Supported by National Institutes of Health (NIH)/National Eye Institute EY014999 and P30-EY001319, Research to Prevent Blindness, NIH Training Grant T32-EY007125, and the Center for Emerging and Innovative Sciences/Bausch and Lomb.
Disclosure: L. Zheleznyak, None; H. Jung, None; G. Yoon, None
References
- 1. Lane SS, Morris M, Nordan L, Packer M, Tarantino N, Wallace RB III. Multifocal intraocular lenses. Ophthalmol Clin North Am. 2006; 19: 89–105 [DOI] [PubMed] [Google Scholar]
- 2. Kim MJ, Zheleznyak L, MacRae S, Tchah H, Yoon G. Objective evaluation of through-focus optical performance of presbyopia-correcting intraocular lenses using an optical bench system. J Cataract Refract Surg. 2011; 37: 1305–1312 [DOI] [PMC free article] [PubMed] [Google Scholar]
- 3. Zheleznyak L, Kim MJ, MacRae S, Yoon G. Impact of corneal aberrations on through-focus image quality of presbyopia-correcting intraocular lenses using an adaptive optics bench system. J Cataract Refract Surg. 2012; 38: 1724–1733 [DOI] [PubMed] [Google Scholar]
- 4. Alió JL, Piñero DP, Plaza-Puche AB, Chan MJR. Visual outcomes and optical performance of a monofocal intraocular lens and a new-generation multifocal intraocular lens. J Cataract Refract Surg. 2011; 37: 241–250 [DOI] [PubMed] [Google Scholar]
- 5. Guillon M, Maissa C, Cooper P, Girard-Claudon K, Poling TR. Visual performance of a multi-zone bifocal and a progressive multifocal contact lens. CLAO J. 2002; 28: 88–93 [PubMed] [Google Scholar]
- 6. Alió JL, Chaubard JJ, Caliz A, Sala E, Patel S. Correction of presbyopia by technovision central multifocal LASIK (presbyLASIK). J Refract Surg. 2006; 22: 453–460 [DOI] [PubMed] [Google Scholar]
- 7. Alarcón A, Anera RG, Soler M, Del Barco L. Visual evaluation of different multifocal corneal models for the correction of presbyopia by laser ablation. J Refract Surg. 2011; 27: 833–836 [DOI] [PubMed] [Google Scholar]
- 8. Bouzoukis DI, Kymionis GD, Panagopoulou SI, et al. Visual outcomes and safety of a small diameter intrastromal refractive inlay for the corneal compensation of presbyopia. J Refract Surg. 2012; 28: 168–173 [DOI] [PubMed] [Google Scholar]
- 9. Garza E, Gomez S, Chayet A, Dishler J. One-year safety and efficacy results of a hydrogel inlay to improve near vision in patients with emmetropic presbyopia. J Refract Surg. 2013; 29: 166–172 [DOI] [PubMed] [Google Scholar]
- 10. Terwee T, Weeber H, van der Mooren M, Piers P. Visualization of the retinal image in an eye model with spherical and aspheric, diffractive, and refractive multifocal intraocular lenses. J Refract Surg. 2008; 24: 223–232 [DOI] [PubMed] [Google Scholar]
- 11. Leyland M, Zinicola E. Multifocal versus monofocal intraocular lenses in cataract surgery: a systematic review. Ophthalmology. 2003; 110: 1789–1798 [DOI] [PubMed] [Google Scholar]
- 12. Montés-Micó R, Alió J. Distance and near contrast sensitivity function after multifocal intraocular lens implantation. J Cataract Refract Surg. 2003; 29: 703–711 [DOI] [PubMed] [Google Scholar]
- 13. Dick HB, Krummenauer F, Schwenn O, Krist R, Pfeiffer N. Objective and subjective evaluation of photic phenomena after monofocal and multifocal intraocular lens implantation. Ophthalmology. 1999; 106: 1878–1886 [DOI] [PubMed] [Google Scholar]
- 14. Choi J, Schwiegerling J. Optical performance measurement and night driving simulation of ReSTOR, ReZoom, and Tecnis multifocal intraocular lenses in a model eye. J Refract Surg. 2008; 24: 218–222 [DOI] [PubMed] [Google Scholar]
- 15. Tucker J, Charman W. The depth-of-focus of the human eye for Snellen letters. Am J Optom Physiol Opt. 1975; 52: 3–21 [DOI] [PubMed] [Google Scholar]
- 16. Charman W, Whitefoot H. Pupil diameter and the depth-of-field of the human eye as measured by laser speckle. J Mod Opt. 1977; 24: 1211–1216 [Google Scholar]
- 17. García-Lázaro S, Ferrer-Blasco T, Radhakrishnan H, Cerviño A, Charman WN, Montés-Micó R. Visual function through 4 contact lens–based pinhole systems for presbyopia. J Cataract Refract Surg. 2012; 38: 858–865 [DOI] [PubMed] [Google Scholar]
- 18. García-Lázaro S, Albarrán-Diego C, Ferrer-Blasco T, Radhakrishnan H, Montés-Micó R. Visual performance comparison between contact lens-based pinhole and simultaneous vision contact lenses. Clin Exp Optom. 2013; 96: 46–52 [DOI] [PubMed] [Google Scholar]
- 19. Seyeddain O, Riha W, Hohensinn M, Nix G, Dexl AK, Grabner G. Refractive surgical correction of presbyopia with the AcuFocus small aperture corneal inlay: two-year follow-up. J Refract Surg. 2010; 26: 707–715 [DOI] [PubMed] [Google Scholar]
- 20. Dexl AK, Seyeddain O, Riha W, Hohensinn M, Hitzl W, Grabner G. Reading performance after implantation of a small-aperture corneal inlay for the surgical correction of presbyopia: two-year follow-up. J Cataract Refract Surg. 2011; 37: 525–531 [DOI] [PubMed] [Google Scholar]
- 21. Yilmaz ÖF, Bayraktar S, Agca A, Yilmaz B, McDonald MB, van de Pol C. Intracorneal inlay for the surgical correction of presbyopia. J Cataract Refract Surg. 2008; 34: 1921–1927 [DOI] [PubMed] [Google Scholar]
- 22. Hickenbotham A, Tiruveedhula P, Roorda A. Comparison of spherical aberration and small-pupil profiles in improving depth of focus for presbyopic corrections. J Cataract Refract Surg. 2012; 38: 2071–2079 [DOI] [PMC free article] [PubMed] [Google Scholar]
- 23. Stiles W, Crawford B. The luminous efficiency of rays entering the eye pupil at different points. Proceedings of the Royal Society of London Series B. 1933; 112: 428–450 [Google Scholar]
- 24. Applegate RA, Lakshminarayanan V. Parametric representation of Stiles-Crawford functions: normal variation of peak location and directionality. J Opt Soc Am A. 1993; 10: 1611–1623 [DOI] [PubMed] [Google Scholar]
- 25. Campbell FW. The depth of field of the human eye. J Mod Opt. 1957; 4: 157–164 [Google Scholar]
- 26. Zhang X, Ye M, Bradley A, Thibos L. Apodization by the Stiles-Crawford effect moderates the visual impact of retinal image defocus. J Opt Soc Am A. 1999; 16: 812–820 [DOI] [PubMed] [Google Scholar]
- 27. Atchison DA, Joblin A, Smith G. Influence of Stiles–Crawford effect apodization on spatial visual performance. J Opt Soc Am A. 1998; 15: 2545–2551 [DOI] [PubMed] [Google Scholar]
- 28. Atchison DA, Scott DH, Strang NC, Artal P. Influence of Stiles–Crawford apodization on visual acuity. J Opt Soc Am A. 2002; 19: 1073–1083 [DOI] [PubMed] [Google Scholar]
- 29. Duane A. Normal values of the accommodation at all ages. JAMA. 1912; 59: 1010–1013 [Google Scholar]
- 30. Watson AB, Yellott JI. A unified formula for light-adapted pupil size. J Vis. 2012; 12: 1–16 [DOI] [PubMed] [Google Scholar]
- 31. Winn B, Whitaker D, Elliott D, Phillips NJ. Factors affecting light-adapted pupil size in normal human subjects. Invest Ophthalmol Vis Sci. 1994; 35: 1132–1137 [PubMed] [Google Scholar]
- 32. Mutti D, Zadnik K, Egashira S, Kish L, Twelker J, Adams A. The effect of cycloplegia on measurement of the ocular components. Invest Ophthalmol Vis Sci. 1994; 35: 515–527 [PubMed] [Google Scholar]
- 33. McLellan JS, Marcos S, Burns SA. Age-related changes in monochromatic wave aberrations of the human eye. Invest Ophthalmol Vis Sci. 2001; 42: 1390–1395 [PubMed] [Google Scholar]
- 34. Seijas O, Gómez de Liaño P, Gómez de Liaño R, Roberts CJ, Piedrahita E, Diaz E. Ocular dominance diagnosis and its influence in monovision. Am J Ophthalmol. 2007; 144: 209–216 [DOI] [PubMed] [Google Scholar]
- 35. Zheleznyak L, Sabesan R, Oh J-S, MacRae S, Yoon G. Modified monovision with spherical aberration to improve presbyopic through-focus visual performance. Invest Ophthalmol Vis Sci. 2013; 54: 3157–3165 [DOI] [PMC free article] [PubMed] [Google Scholar]
- 36. Watson AB, Pelli DG. QUEST: a Bayesian adaptive psychometric method. Percept Psychophys. 1983; 33: 113–120 [DOI] [PubMed] [Google Scholar]
- 37. Webster M, Georgeson M, Webster S. Neural adjustments to image blur. Nat Neurosci. 2002; 5: 839–840 [DOI] [PubMed] [Google Scholar]
- 38. Goodman JW. Introduction to Fourier Optics. 3rd ed. Englewood, CO: Roberts and Company Publishers; 2005. [Google Scholar]
- 39. Cheng X, Bradley A, Ravikumar S, Thibos LN. The visual impact of Zernike and Seidel forms of monochromatic aberrations. Optom Vis Sci. 2010; 87: 300–312 [DOI] [PMC free article] [PubMed] [Google Scholar]
- 40. Yi F, Iskander DR, Collins M. Depth of focus and visual acuity with primary and secondary spherical aberration. Vision Res. 2011; 51: 1648–1658 [DOI] [PubMed] [Google Scholar]
- 41. Benard Y, Lopez-Gil N, Legras R. Subjective depth of field in presence of 4th-order and 6th-order Zernike spherical aberration using adaptive optics technology. J Cataract Refract Surg. 2010; 36: 2129–2138 [DOI] [PubMed] [Google Scholar]
- 42. Rocha KM, Vabre L, Chateau N, Krueger RR. Expanding depth of focus by modifying higher-order aberrations induced by an adaptive optics visual simulator. J Cataract Refract Surg. 2009; 35: 1885–1892 [DOI] [PubMed] [Google Scholar]
- 43. Xu R, Bradley A, Thibos LN. Impact of primary spherical aberration, spatial frequency and Stiles Crawford apodization on wavefront determined refractive error: a computational study. Ophthalmic Physiol Opt. 2013; 33: 444–455 [DOI] [PMC free article] [PubMed] [Google Scholar]
- 44. Kollbaum P, Jansen M, Thibos L, Bradley A. Validation of an off-eye contact lens Shack-Hartmann wavefront aberrometer. Optom Vis Sci. 2008; 85: E817–E828 [DOI] [PMC free article] [PubMed] [Google Scholar]
- 45. Iskander DR, Davis BA, Collins MJ, Franklin R. Objective refraction from monochromatic wavefront aberrations via Zernike power polynomials. Ophthalmic Physiol Opt. 2007; 27: 245–255 [DOI] [PubMed] [Google Scholar]
- 46. He JC, Burns SA, Marcos S. Monochromatic aberrations in the accommodated human eye. Vision Res. 2000; 40: 41–48 [DOI] [PubMed] [Google Scholar]
- 47. López-Gil N, Fernández-Sánchez V. The change of spherical aberration during accommodation and its effect on the accommodation response. J Vis. 2010; 10: 12 [DOI] [PubMed] [Google Scholar]
- 48. López-Gil N, Martin J, Liu T, Bradley A, Díaz-Muñoz D, Thibos LN. Retinal image quality during accommodation. Ophthalmic Physiol Opt. 2013; 33: 497–507 [DOI] [PMC free article] [PubMed] [Google Scholar]
- 49. Porter J, Guirao A, Cox IG, Williams DR. Monochromatic aberrations of the human eye in a large population. J Opt Soc Am A. 2001; 18: 1793–1803 [DOI] [PubMed] [Google Scholar]
- 50. Thibos L, Hong X, Bradley A, Cheng X. Statistical variation of aberration structure and image quality in a normal population of healthy eyes. J Opt Soc Am A. 2002; 19: 2329–2348 [DOI] [PubMed] [Google Scholar]
- 51. Yoon G, MacRae S, Williams DR, Cox IG. Causes of spherical aberration induced by laser refractive surgery. J Cataract Refract Surg. 2005; 31: 127–135 [DOI] [PubMed] [Google Scholar]
- 52. Kohnen T, Mahmoud K, Bühren J. Comparison of corneal higher-order aberrations induced by myopic and hyperopic LASIK. Ophthalmology. 2005; 112: 1692 e1691–1692 e11 [DOI] [PubMed] [Google Scholar]
- 53. Lindskoog Pettersson A, Jarkö C, Alvin Å, Unsbo P, Brautaset R Spherical aberration in contact lens wear. Cont Lens Anterior Eye. 2008; 31: 189–193 [DOI] [PubMed] [Google Scholar]
- 54. Marcos S, Barbero S, Jimenez-Alfaro I. Optical quality and depth-of-field of eyes implanted with spherical and aspheric intraocular lenses. J Refract Surg. 2005; 21: 223–235 [DOI] [PubMed] [Google Scholar]
- 55. Holladay J, Piers P, Koranyi G, van der Mooren M, Norrby N. A new intraocular lens design to reduce spherical aberration of pseudophakic eyes. J Refract Surg. 2002; 18: 683–691 [DOI] [PubMed] [Google Scholar]
- 56. Hong X, Zhang X. Optimizing distance image quality of an aspheric multifocal intraocular lens using a comprehensive statistical design approach. Optics Express. 2008; 16: 20920–20934 [DOI] [PubMed] [Google Scholar]
- 57. Legge GE, Mullen KT, Woo GC, Campbell F. Tolerance to visual defocus. J Opt Soc Am A. 1987; 4: 851–863 [DOI] [PubMed] [Google Scholar]
- 58. Piers PA, Manzanera S, Prieto PM, Gorceix N, Artal P. Use of adaptive optics to determine the optimal ocular spherical aberration. J Cataract Refract Surg. 2007; 33: 1721–1726 [DOI] [PubMed] [Google Scholar]
- 59. Sabesan R, Zheleznyak L, Yoon G. Binocular visual performance and summation after correcting higher order aberrations. Biomed Opt Express. 2012; 3: 3176–3189 [DOI] [PMC free article] [PubMed] [Google Scholar]
- 60. Villa C, Gutiérrez R, Jimenez JR, Gonzalez-Meijome JM. Night vision disturbances after successful LASIK surgery. Br J Ophthalmol. 2007; 91: 1031–1037 [DOI] [PMC free article] [PubMed] [Google Scholar]
- 61. de Vries NE, Webers CA, Touwslager WR, et al. Dissatisfaction after implantation of multifocal intraocular lenses. J Cataract Refract Surg. 2011; 37: 859–865 [DOI] [PubMed] [Google Scholar]
- 62. Woodward MA, Randleman JB, Stulting RD. Dissatisfaction after multifocal intraocular lens implantation. J Cataract Refract Surg. 2009; 35: 992–997 [DOI] [PMC free article] [PubMed] [Google Scholar]
- 63. Mino M, Okano Y. Improvement in the OTF of a defocused optical system through the use of shaded apertures. Appl Opt. 1971; 10: 2219–2225 [DOI] [PubMed] [Google Scholar]
- 64. Thorn F, Schwartz F. Effects of dioptric blur on Snellen and grating acuity. Optom Vis Sci. 1990; 67: 3–7 [DOI] [PubMed] [Google Scholar]
- 65. Akutsu H, Bedell HE, Patel SS. Recognition thresholds for letters with simulated dioptric blur. Optom Vis Sci. 2000; 77: 524–530 [DOI] [PubMed] [Google Scholar]
- 66. Ravikumar S, Bradley A, Thibos L. Phase changes induced by optical aberrations degrade letter and face acuity. J Vis. 2010; 10: 1–12 [DOI] [PubMed] [Google Scholar]
- 67. Cheng D, Woo GC, Schmid KL. Bifocal lens control of myopic progression in children. Clin Exp Optom. 2011; 94: 24–32 [DOI] [PubMed] [Google Scholar]
- 68. Watson AB, Ahumada AJ Jr. Predicting visual acuity from wavefront aberrations. J Vis. 2008; 8: 1–19 [DOI] [PubMed] [Google Scholar]
- 69. Wang B, Ciuffreda KJ. Depth-of-focus of the human eye: theory and clinical implications. Surv Ophthalmol. 2006; 51: 75–85 [DOI] [PubMed] [Google Scholar]
- 70. Bakaraju RC, Ehrmann K, Papas EB, Ho A. Depth-of-focus and its association with the spherical aberration sign. A ray-tracing analysis. J Optom. 2010; 3: 51–59 [Google Scholar]
- 71. Oyster CW. The Human Eye: Structure and Function. Sunderland, MA: Sinauer Associates, Inc.; 1999. [Google Scholar]
- 72. Banks MS, Geisler WS, Bennett PJ. The physical limits of grating visibility. Vision Res. 1987; 27: l915–1924 [DOI] [PubMed] [Google Scholar]
- 73. De Valois RL, Morgan H, Snodderly DM. Psychophysical studies of monkey vision-III. Spatial luminance contrast sensitivity tests of macaque and human observers. Vision Res. 1974; 14: 75–81 [DOI] [PubMed] [Google Scholar]


