

Abstract
A small number of HIV-infected individuals known as elite controllers experience low levels of chronic phase viral replication and delayed progression to AIDS. Specific HLA class I alleles are associated with elite control, implicating CD8+ T lymphocytes in the establishment of these low levels of viral replication. Most HIV-infected individuals that express protective HLA class I alleles, however, do not control viral replication. Approximately 50% of Mamu-B*00801+ Indian rhesus macaques control SIVmac239 replication in the chronic phase in a manner that resembles elite control in humans. We followed both the immune response and viral evolution in SIV-infected Mamu-B*00801+ animals to better understand the role of CD8+ T lymphocytes during the acute phase of viral infection, when viral control status is determined. The virus escaped from immunodominant Vif and Nef Mamu-B*00801–restricted CD8+ T lymphocyte responses during the critical early weeks of acute infection only in progressor animals that did not control viral replication. Thus, early CD8+ T lymphocyte escape is a hallmark of Mamu-B*00801+ macaques who do not control viral replication. By contrast, virus in elite controller macaques showed little evidence of variation in epitopes recognized by immunodominant CD8+ T lymphocytes, implying that these cells play a role in viral control.
Elite controllers (EC) are individuals who control chronic HIV viral replication to <50 viral copies/ml of circulating blood plasma. Particular HLA class I alleles are found at much higher frequency in EC than in individuals who do not control viral replication (reviewed in Refs. 1, 2). HIV-specific CD8+ T lymphocytes restricted by these protective alleles dominate the CD8+ T cell response during acute infection (3), suggesting that they contribute to viral control. In addition, HIV escapes from CD8+ T lymphocyte responses in both acute and chronic HIV infection (4–7), further implicating CD8+ T cell responses as important in containing HIV infection.
Studying acute infection with HIV is difficult, because the majority of HIV infections are not diagnosed until after the acute phase has ended (8). We therefore sought to determine the role of CD8+ T lymphocytes in establishing elite control by evaluating an animal model of MHC class I-associated elite control. Approximately 50% of Mamu-B*00801+ macaques infected with the pathogenic SIVmac239 clonal virus go on to control chronic phase viral loads to <1000 viral copies/ml of plasma (9–11). We used this model to explore the relationship between virus-specific CD8+ T lymphocyte responses and viral escape during acute immunodeficiency virus infection.
Materials and Methods
Animals and SIV infection
MHC class I records for >150 SIVmac239-infected Indian rhesus macaques with archived samples at the Wisconsin National Primate Research Center were obtained, and a total of 17 animals that were Mamu-B*00801+ and had viral load outcome data were discovered. We excluded two Mamu-B*00801+ animals that also expressed the elite control-associated Mamu-B*01701 allele (12) from these analyses, leaving 15 animals included in the current study (Table I). MHC class I typing was performed by sequence-specific PCR (9). Most of the animals were infected in previously published studies (10, 11). All animals were housed and cared for according to regulations set forth in the Guide for the Care and Use of Laboratory Animals published in 1996 by the National Academy Press on behalf of the National Research Council. Animals were infected with SIVmac239 produced on Vero and CEMx174 cells or SIV-naive PBMC using a previously described method (13). The majority of the animals were infected i.v.; however, three animals challenged as a part of earlier studies were infected intrarectally (two P animals and one EC) (Table I). All macaques in this study were infected after one viral challenge.
Table I.
SIVmac239-infected Mamu-B*00801+ animals
| Animal | Route of Infection | Infection Outcome |
|---|---|---|
| rhau10 | i.v. | EC |
| r03047 | i.v. | EC |
| r96067 | i.v. | EC |
| r00032 | i.v. | EC |
| r02019 | i.v. | EC |
| r01064 | i.v. | EC |
| r98057 | Intrarectal | EC |
| r03016 | i.v. | C |
| r01027 | i.v. | C |
| r00078 | i.v. | C |
| r99019 | i.v. | P |
| r02040 | i.v. | P |
| r91003 | i.v. | P |
| r96104 | Intrarectal | P |
| r96113 | Intrarectal | P |
Relationships among most animals are delineated in Ref. 11.
SIV viral load measurement
Viral loads were measured from EDTA anticoagulated plasma using a previously described protocol (14). Twenty-microliter reactions were prepared for one-step quantitative RT-PCR using a kit (Invitrogen, Carls-bad, CA). They contained 0.2 mM each deoxynucleoside triphosphate, 5 mM MgSO4, 0.015% BSA, 150 ng random hexamer primers, 0.8 μl SuperScript III reverse transcriptase and Platinum Taq DNA polymerase in a single enzyme mix, and 600 nM each primer: forward (SIV1552), 5′-GTCTGCGTCATCTGGTGCATTC-3′ and reverse (SIV1635), 5′-CACTAGCTGTCTCTGCACTATGTGTTTTG-3′ and 100 nM probe 5′-FAM-CTTCCTCAGTGTGTTTCACTTTCTCTTCTGCG-TAMRA-3′. Temperature cycling used a LightCycler 1.2 instrument (Roche, Indianapolis, IN) with the following cycling parameters: reverse transcription at 37°C for 15 min then 50°C for 30 min; this was followed by a single cycle of 95°C for 2 min and then 50 cycles of 95°C for 15 s and 62°C for 1 min.
Internal standards were performed with a diluted series of SIV gag synthetic transcript between 15 million and 1.5 copy equivalents per sample. Unknown samples were calculated from the standard curve using LightCycler 4.0 software (Roche). Thirty viral copy equivalents per milliliter plasma is the limit of reliable quantification for this assay; however, lower viral loads can be detected, but not reproducibly quantified.
Amplicon-based 454 sequencing of plasma virus
To sequence the viral quasispecies composing each of the major Mamu-B*00801–restricted SIVmac239 epitopes (15), we used an amplicon-based 454 sequencing approach (16). We designed 5 separate amplicons to amplify 12 of the most frequently targeted Mamu-B*00801–restricted epitopes. Sequence-specific portions of primers were: amplicon 1 (Vif123–131RL9 and Vif172–179RL8) forward, 5′-CAGAAAAAGGGTGGCTCAGT-3′ and reverse, 5′-AGGTGGTTTACCGCCTCTCT-3′; amplicon 2 (Vpr62–70IF9 and Rev12–20KL9) forward, 5′-GATCCTCGCTTGCTAACTGC-3′ and reverse, 5′-GCAGCTGATTCCCAAGACAT-3′; amplicon 3 (Env524–532KF9 and Env573–581KL9) forward, 5′-AGTGCAGAGGTGGCAGAACT-3′ and reverse, 5′-GGCAGTGACCCTAGTCTGGA-3′; amplicon 4 (Rev44–51RL8, Nef8–16RL9a, and Env868–876RL9) forward, 5′-GCCAACCAGAGAAGG-CAAAG-3′ and reverse, 5′-TCTGTCCCTCACAAGAGAGT-3′; and amplicon 5 (Nef137–146RL10 and Nef245–254RL9b/c) forward, 5′-GACTGGAAGGGATTTATTAC-3′ and reverse, 5′-GAGTTTCCTTCTTGTCAGCC-3′. All five primer sets (forward and reverse) were synthesized with appropriate Roche 454 amplicon (Lib-A; Roche) adapter sequences and with four multiplex identifier tags (MID) on separate forward primers and three MIDs on separate reverse primers. This allowed multiplex sequence identification for 12 separate samples for each amplicon in individual 454 sequencing runs.
Each reaction began with a single-step RT-PCR for each of the unique animal/MID sequence combinations from total viral RNA prepared from frozen EDTA anticoagulated plasma using the QIAmp MinElute Virus Spin kit (Qiagen, Valencia, CA). We used SuperScript III One-Step RT-PCR kit (Invitrogen, Carlsbad, CA). Each 50-μl reaction contained 25 μl 2× reaction mix, 1 μl enzyme mix containing both reverse transcriptase and Taq polymerase, sequence-specific and adaptor/MID-tagged forward and reverse primers each at a final concentration of 0.2 μM, and up to 5 μl template RNA containing between 1,643 and 238,500 calculated viral copy equivalents, depending on the sample and the animal’s viral load at the time (Supplemental Fig. 1). Cycling parameters for the RT-PCR were as follows: reverse transcription was performed at 50°C for 30 min followed by a single denaturing step of 94°C for 2 min; this was followed by PCR cycling, which included 45 cycles of 94°C for 15 s, 64°C for 30 s, and 68°C for 50 s. A final 5-min extension step at 72°C was performed before samples were cooled to 10°C. RT-PCR products were visualized on a 1.0% agarose gel, and then individual bands were cut and gel purified using the QIAquick gel extraction kit (Qiagen). RT-PCR products were quantified using a Qubit fluorometer (Invitrogen) and analyzed for quality using an Agilent 2100 bioanalyzer with high sensitivity DNA chips (Agilent Technologies, Santa Clara, CA).
For each sequencing run, samples were pooled in equimolar ratios, and 15 million molecules of pooled sample were added to 10 million DNA capture beads for a final ratio of 1.5 DNA molecules per bead. Approximately 30–60 individual samples (up to 5 amplicons per animal, up to 12 animals per run, and each animal with separate unique forward and reverse primer MID combinations) were pooled for each sequencing run. Emulsion PCR, enrichment, breaking, and DNA sequencing were all performed according to the GS Junior FLX Titanium Series manuals for Lib-A (Roche). Sequencing and run processing were performed on a GS Junior 454 sequencing instrument (Roche). Variant quasispecies were analyzed using the AVA software (Roche) and output contigs representing individual variants were aligned to SIVmac239. Average read depth for all five amplicons was between 1500 and 4000 reads. No individual samples were included for analysis with read depths of <300 reads. Variants detected in fewer than five reads in a single sample were discarded.
To evaluate resequencing bias in samples with low input viral copy number, we diluted plasma from a single P animal (r99019; week 8 postinfection) and performed separate RT-PCR reactions on each dilution to compare the distribution of variants after sequencing (Supplemental Fig. 1). No significant resequencing bias was detected at ≥1775 viral copy equivalents (Supplemental Fig. 1), suggesting that resequencing bias did not play a role in the limited detection of viral variants in EC animals with lower viral loads.
MHC class I tetramer staining and analysis
Fresh or frozen PBMC from each animal were stained with MHC class I tetramers produced by the Wisconsin National Primate Research Center Tetramer Core facility. A total of 500,000–1,000,000 cells were stained with 2.5 μg tetramer in a final volume of ~100 μl R10 (RPMI 1640 media with 10% FCS supplemented with both antibiotic/antimycotic solution and L-glutamine). Cells with tetramer were incubated for 1–1.5 h at 37°C. Surface stains for CD3 (clone SP34) and CD8 (clone RPA-T8) were then added, and cells were incubated for an additional 30 min at room temperature. Cells were washed twice with FACS buffer (1× PBS with 10% FCS) and fixed in 1% paraformaldehyde. Fixed cells were analyzed on either a BD LSRII or BD FACSCalibur (BD Biosciences, Franklin Lakes, NJ) and analyzed using FlowJo software (Tree Star). Tetramer frequencies are presented as the percentage of tetramer-positive CD3+CD8+ live lymphocyte events.
Statistical analysis
Geometric mean viral loads were calculated and then compared using the Kruskal–Wallis one-way ANOVA followed by the Dunn’s multiple comparison posttest. Comparisons between the number of different viral quasispecies in EC/C and P were made using two-tailed t tests. The frequency of tetramer-positive CD8+ T cells was analyzed by one-way ANOVA. Data were graphed and statistical comparisons were made using Prism 5 software (GraphPad, La Jolla, CA).
The mean number of synonymous substitutions per synonymous nucleotide site (dS) and the mean number of nonsynonymous substitutions per nonsynonymous nucleotide site (dN) were estimated by Nei and Gojobori’s method (17). These quantities were estimated in pairwise comparisons between individual sequences and the inoculum sequence, and the mean of all pairwise comparisons was computed. A small number of contigs with large gaps relative to the inoculum were excluded from the analyses; a total of 432,209 individual comparisons were made between epitope sequences and the inoculum. For purposes of statistical testing, the mean of dS or dN between all sequences of a given epitope and the inoculum was taken as the unit of analysis. Both patterns of substitution and time course were analyzed by a factorial ANOVA using a general linear models approach. Individual comparisons between dN and dS were made using paired t tests. To examine differences among the Vif and Nef epitopes in P animals at week 8, we applied a nested ANOVA to dN values.
Results
Viral load divergence kinetics in Mamu-B*00801+ SIVmac239-infected rhesus macaques
To explore associations between the development of EC and CD8+ T lymphocyte escape in Mamu-B*00801+ Indian rhesus macaques, we analyzed samples collected and archived from 15 Mamu-B*00801+ animals infected with SIVmac239 in earlier studies (Table I) (10, 11). Previous long-term study of these 15 Mamu-B*00801+ macaques revealed three distinct groups of animals based upon chronic phase set point viral loads: EC (chronic set point viral load <1,000 V/ml), controllers (C; chronic set point viral load <10,000 V/ml), and progressors (P; chronic set point viral load >100,000 V/ml). Of these 15 animals, 10 had plasma samples available for sequencing. Two animals had available sample at various time points but were not included in every sequencing experiment. Three animals were included in viral load analyses but did not have sufficient samples remaining for acute-phase viral sequencing.
We began by analyzing viral load changes to determine the kinetics of viral load divergence among the three groups of animals: EC, C, and P. We discovered that viral loads were statistically equivalent in P animals and EC animals until 6 wk postinfection (Fig. 1). At this time point, geometric mean viral load in the EC animals was more than one log10 lower than the geometric mean viral load in the P animals (p < 0.05; Fig. 1). Geometric mean viral load in the C animals was more variable during acute infection due to a single animal, r00078, which inexplicably maintained viral loads that more closely matched those of P animals until 10–14 wk postinfection. All other animals were clearly demarcated into >100,000 V/ml or ≤10,000 V/ml categories by 8 wk postinfection. Taken together, these findings suggest that the factors that differentiate viral loads in EC, C, and P animals, exert their effects starting ~6 wk postinfection.
FIGURE 1.

Viral load kinetics in SIV-mac239-infected Mamu-B*00801+ rhesus macaques. (A) Viral load profiles for the study animals during the first 28 wk of acute infection. Dashed lines indicate 10,000 V/ ml (C animals) and 1,000 V/ml (EC animals). (B) Geometric mean viral loads for the 15 animals plotted by infection outcome status for each weekly time point. Some animals did not have viral load data for weeks 5, 6, and 7 postinfection. Viral loads in EC animals are statistically lower than P animals beginning at 6 wk postinfection. Geometric mean viral loads were compared using the Kruskal–Wallis one-way ANOVA followed by the Dunn’s multiple comparison posttest. *p < 0.05, **p < 0.01.
454 pyrosequencing of acute-phase plasma virus samples from Mamu-B*00801+ SIVmac239-infected rhesus macaques
To determine if CD8+ T lymphocyte escape contributes to the separation of viral loads among EC, C, and P animals during the first weeks of SIV infection, we used an amplicon-based Roche 454 pyrosequencing approach (16) to characterize the viral quasispecies that make up each of the 12 most commonly targeted Mamu-B*00801–restricted CD8+ T lymphocyte epitopes. For this analysis, we chose the 4- and 8-wk postinfection time points that flank the demarcation of viral loads between EC and P animals during acute infection. We found very few nonsynonymous mutations in the Mamu-B*00801–restricted subdominant epitopes at 8 wk postinfection and even fewer mutations at 4 wk postinfection (Fig. 2A and data not shown). By contrast, we found several non-synonymous mutations in the five most immunodominant epitopes: Vif RL8, Vif RL9, Nef RL10, Nef RL9b, and Nef RL9c at 8 wk postinfection (Fig. 2B). Interestingly, we found nonsynonymous variation in the Vif RL8 immunodominant epitope at the 4-wk postinfection time point in addition to the 8-wk postinfection time point. Few nonsynonymous mutant epitope variants were present in the other immunodominant epitopes at 4 wk postinfection.
FIGURE 2.

Consensus viral sequence during acute infection for 12 Mamu-B*00801–restricted SIVmac239 T cell epitopes. This representation of the viral quasispecies lists all variants from wild-type sequence detected in >1% of sequenced reads. (A) Subdominant Mamu-B*00801–restricted T cell epitopes display very little viral quasispecies diversity within the first 8 wk of acute infection, suggesting minimal CD8+ T lymphocyte escape in these regions of the virus. (B) Immunodominant Mamu-B*00801–restricted T cell epitopes demonstrate CD8+ T lymphocyte escape during the first 8 wk of acute SIV infection. Of note, CD8+ T lymphocyte escape in the Vif RL8 epitope appears more diverse in P animals when compared with EC and C animals. Nef RL9b/c naming convention is based upon the order in which each epitope was discovered and is consistent with previously published studies. For most data points with available sample, sequencing was performed twice independently on separate samples of plasma from the same animal and time point.
We next sought to determine whether the observed nonsynonymous variation could be correlated with viral control status in the three groups of animals: EC, C, and P. To do this, we estimated the dS and dN in the Mamu-B*00801–restricted CD8+ T lymphocyte epitopes comparing the inoculum sequence and individual plasma viral quasispecies sequences isolated from the animals at 8 wk postinfection. We analyzed three separate parameters: the viral gene in which the epitope occurred, the infection outcome status of the host (P, C, or EC), and the interaction between the two. In the case of dS, none of these effects were statistically significant (Table II). In the case of dN, we found significant effects of infection outcome status (p < 0.05) and of viral gene (p < 0.001), and we observed a significant viral gene by infection outcome status interaction (p = 0.003). This significant interaction was principally explained by significantly elevated mean dN in the Vif epitopes (Vif RL8 and Vif RL9) of P animals (p < 0.001) and also, to some extent, elevated mean dN in the Nef epitopes (Nef RL10 and Nef RL9b/c) of P animals when compared with dS by paired t test (p < 0.05; Table II). dN and dS did not differ significantly in any of the other viral gene and infection outcome status combinations, except for the Rev epitopes of EC, in which dS was significantly greater than dN (p < 0.05; Table II). Data from the Vif epitopes from weeks 3, 4, and 8 revealed the effects of this selection acting over time (Fig. 3). We found a significant increase in dN/dS within the Vif epitopes in P animals compared with EC and C animals (p = 0.006) and a significant increase in dN/dS of the Vif epitopes over time (p < 0.001). We also discovered a significant interaction between infection outcome status and week postinfection when analyzing the Vif epitopes (p = 0.001). This interaction was explained by the fact that dN in the Vif epitopes increased markedly between weeks 4 and 8 in P, but to a much lesser extent in C and EC (Fig. 3).
Table II.
Mean dS and dN comparing CD8+ T lymphocyte epitope sequences and the inoculum listed by gene and infection outcome status at 8 wk postinfection
| Gene | Infection Outcome | dS ± SE | dN ± SE |
|---|---|---|---|
| Env | P | 0.00053 ± 0.00038 | 0.00012 ± 0.00005 |
| C | 0.00046 ± 0.00032 | 0.00000 ± 0.00000 | |
| EC | 0.00113 ± 0.00069 | 0.00030 ± 0.00014 | |
| Nef | P | 0.00091 ± 0.00022 | 0.01433 ± 0.00485* |
| C | 0.00061 ± 0.00024 | 0.00734 ± 0.00562 | |
| EC | 0.00034 ± 0.00011 | 0.01008 ± 0.00445 | |
| Rev | P | 0.00057 ± 0.00028 | 0.00031 ± 0.00011 |
| C | 0.00014 ± 0.00014 | 0.00010 ± 0.00010 | |
| EC | 0.00066 ± 0.00017 | 0.00021 ± 0.00010* | |
| Vif | P | 0.00032 ± 0.00013 | 0.04039 ± 0.00070** |
| C | 0.00016 ± 0.00016 | 0.00585 ± 0.00325 | |
| EC | 0.00067 ± 0.00020 | 0.01166 ± 0.00650 | |
| Vpr | P | 0.00000 ± 0.00000 | 0.00006 ± 0.00006 |
| C | 0.00442 ± 0.00442 | 0.00216 ± 0.00169 | |
| EC | 0.02440 ± 0.02420 | 0.00090 ± 0.00050 |
Paired t tests of the hypothesis that mean dS = mean dN:
p < 0.05,
p < 0.001.
FIGURE 3.

Analysis of nonsynonymous Mamu-B*00801–restricted Vif epitope variation over time. Nonsynonymous variation (dN) within the Vif epitopes increases over time in the P animals, but not in the EC or C. In conjunction with unchanged measurements of synonymous variation (dS), this suggests selective viral evolution in response to Vif-specific CD8+ T cell pressure in the P animals.
We also looked for differences among the various Vif and Nef epitopes in P animals at week 8 to determine if any particular epitope within either of the two genes could explain the observed selection. We noted a significant difference between the two genes (p = 0.006), explained by the much higher mean dN in the Vif epitopes than in the Nef epitopes (Table II). However, we did not find a significant difference among the various epitopes within genes.
Escape mutations within the Vif RL8 epitope differentiate P animals from C and EC
To determine if CD8+ T lymphocyte escape in the immunodominant Mamu-B*00801–restricted epitopes existed prior to 4 wk postinfection, we sequenced all five immunodominant epitope regions at 3 wk postinfection, within days of the initial SIV-specific CD8+ T lymphocyte response. Interestingly, we observed variation in the Vif RL8 epitope at this early time point in two of two Mamu-B*00801+ P animals and to a lesser degree in three of seven EC and C animals (Fig. 2B). We did not observe nonsynonymous variation in any of the other Mamu-B*00801–restricted immunodominant epitopes at this early time point postinfection.
We observed that CD8+ T lymphocyte escape within the Vif RL8 epitope in Mamu-B*00801+ P animals consisted of many different variants compared with escape in EC and C animals (Fig. 2B). To further explore this difference, we compiled and analyzed the number of individual variants found in the Vif RL8 epitope in our cohort of sequenced animals (Supplemental Fig. 2) and compared this epitope with the other immunodominant epitopes (Fig. 4, Supplemental Fig. 3). We discovered that P animals developed four, five, and seven distinct populations of variant non–wild-type viral quasispecies on average at 3, 4, and 8 wk postinfection, respectively, each individual population representing a potential CD8+ T lymphocyte escape mutant. In contrast, EC and C animals that did develop potential CD8+ T lymphocyte escape mutations within the Vif RL8 epitope developed only one distinct non–wild-type variant on average, significantly fewer than P animals (Fig. 4). The number of distinct variant viral quasispecies did not differ among EC, C, and P animals for any of the other immunodominant Mamu-B*00801–restricted epitopes except the Nef RL10 epitope at 8 wk postinfection, whereas P animals demonstrated slightly more variants when compared with EC and C animals (Supplemental Fig. 2).
FIGURE 4.
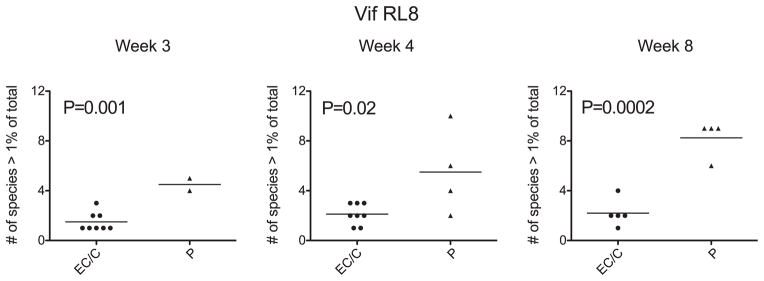
Diverse CD8+ T lymphocyte escape within the Vif RL8 epitope during acute infection predicts infection outcome status. EC and C animals demonstrate significantly fewer variant viral quasispecies compared with P animals by two-tailed t test. This suggests that viruses that are able to generate multiple CD8+ T lymphocyte escape variants within the Vif RL8 epitope can more successfully escape from this CD8+ T cell response and evade immune control. Wild-type virus is one species >1% of total; therefore, a single variant with a frequency >1% in addition to wild-type virus is two species >1% of total.
We next sought to determine if a higher frequency Vif RL8-specific CD8+ T cell response in Mamu-B*00801+ P animals might have dictated the rapid and diverse CD8+ T lymphocyte escape observed within the Vif RL8 epitope. To do this, we evaluated the frequency of epitope-specific immunodominant CD8+ T cells in 10 of the study animals using peptide/MHC class I tetramers. We found a hierarchy in both the kinetics and magnitude of the individual immunodominant Mamu-B*00801–restricted CD8+ T cell responses. The Vif RL8 and Vif RL9 responses appeared earliest, beginning as early as 14 d postinfection, followed by responses directed against the Nef epitopes, Nef RL10 and Nef RL9b (Supplemental Fig. 4). Despite the rapid appearance of the Vif RL8 CD8+ T cell response, there was no significant difference in the magnitude of this response between P animals and EC/C animals (Fig. 5).
FIGURE 5.

Vif RL8-specific MHC class I tetramer responses during acute infection in the Mamu-B*00801+ cohort. There is no statistical difference in the frequency of the acute-phase Vif RL8-specific CD8+ T cell response among EC, C, or P animals by one-way ANOVA. This suggests that a higher frequency Vif RL8-specific CD8+ T cell response in P animals is not responsible for the observed CD8+ T lymphocyte escape difference between EC/C and P animals.
Discussion
In this study, we evaluated the kinetics of CD8+ T lymphocyte escape mutations in Mamu-B*00801–restricted epitopes during acute SIVmac239 infection. In previous work, we described an enrichment of Mamu-B*00801+ macaques in a cohort of SIVmac239-infected EC (9). We then demonstrated both retrospectively and prospectively that >50% of Mamu-B*00801+ macaques infected with the pathogenic SIVmac239 clone control viral replication to <1000 V/ml (10). Furthermore, the Mamu-B*00801–restricted CD8+ T cell response in these animals contributes substantially to the total SIV-specific CD8+ T cell response during acute infection (10), analogous to the situation in human elite control (3). We have also shown that Mamu-B*00801+ macaques infected with a virus that contains Mamu-B*00801–restricted CD8+ T lymphocyte escape mutations have a lower incidence of elite control than wild-type virus-infected macaques (11). In addition, Mamu-B*00801 and HLA-B*2705, a human MHC class I allele associated with elite control of HIV-1 infection in humans, have very similar peptide binding motifs and bind many of the same peptides (15). Taken together, these results implicate Mamu-B*00801–restricted CD8+ T cell responses as critical mediators of the elite control phenotype in SIVmac239-infected macaques. However, it is still not known why some Mamu-B*00801+ macaques have high viral loads in the chronic phase of infection, whereas others go on to control viral replication. In the current study, we sought to address this question by exploring the possibility that early escape from Mamu-B*00801–restricted CD8+ T lymphocyte responses differentiates animals that control viral replication from those that do not.
In our earlier work with Mamu-B*00801+ SIVmac239-infected macaques, we noticed a consistent timing of divergence between the viral loads of animals that control viral replication from those that do not. This divergence would typically occur within the first 8 wk of acute infection. We also noted that peak viral load in infected Mamu-B*00801+ macaques was not statistically different from the geometric mean of other SIVmac239-infected animals in a large cohort (9). In this study, we extended these previous observations by retrospectively characterizing the exact statistical divergence of viral loads during acute infection in Mamu-B*00801+ macaques grouped according to geometric mean chronic-phase set point viral load (EC animals, chronic set point viral load <1,000 V/ml; C animals, chronic set point viral load <10,000 V/ml; and P animals, chronic set point viral load >100,000 V/ml). We discovered that week 2 peak viral load was not different among the three groups of animals. Viral loads were significantly different between EC and P animals beginning at 6 wk postinfection. This suggests that the mechanism that differentiates EC and P animals begins to exert its effects around that time.
Preliminary data in a limited number of SIV-infected Mamu-B*00801+ animals had suggested differential CD8+ T lymphocyte escape may be related to control of chronic-phase viral replication (10). It appeared that P animals had escaped from effective T cell responses early during infection and therefore did not control viral replication. We hypothesized that P animals might preferentially develop CD8+ T lymphocyte escape in Mamu-B*00801–restricted CD8+ T cell epitopes coincident with the separation in viral loads of EC animals and P animals during acute infection. This hypothesis is difficult to explore in human infection, due to the very low incidence of elite control in HIV-1–infected individuals and the difficulty inherent in obtaining acute-phase plasma samples for viral sequencing from the appropriate patients. To address this hypothesis, we used Roche 454 deep sequencing technology (Roche) to characterize the viral quasispecies from plasma virus samples that flanked the critical demarcation in viral loads between EC and P animals at 6 wk postinfection. We found that natural selection favors nonsynonymous variation in the immunodominant Mamu-B*00801–restricted epitope viral sequences from P animals. Whereas the dN/dS difference was detected at the 8 wk postinfection time point, we noted that CD8+ T lymphocyte escape mutations in the most immunodominant Vif RL8 epitope occurred as early as 3 wk postinfection. The CD8+ T lymphocyte escape mutations in the Vif RL8 epitope at these early time points, before the onset of elite control, clearly differentiated P animals from those that would go on to become EC and C animals. The principle difference among the three groups of macaques was the number of separate putative Vif RL8 CD8+ T lymphocyte escape mutations present in the viral quasispecies. P animals had an average of four or more potential CD8+ T lymphocyte escape variants beginning as early as 3 wk postinfection, whereas in the few EC or C animals that did have variation in the Vif RL8 epitope, on average, only one variant arose during acute infection. Taken together, these findings suggest that SIVmac239 escapes from the Vif RL8 CD8+ T cell response in Mamu-B*00801+ P animals early in acute infection but does not escape from this T cell response as effectively in EC and C animals.
We considered that higher viral loads in P animals when compared with EC or C animals could confound our results due to increased viral replication allowing increased rates of viral evolution and CD8+ T lymphocyte escape. For this reason, we sequenced plasma virus from weeks 3 and 4 postinfection, time points before the divergence of viral loads in EC and P animals. Viral replication at these times is occurring at nearly the same rate in both EC and P animals, suggesting that our findings regarding escape from the Vif RL8 T cell response are not influenced by this potentially confounding factor.
We also considered the possibility that a higher frequency SIV-specific CD8+ T cell response in the P animals might be driving a faster rate of viral evolution. We therefore measured the frequency of individual Mamu-B*00801–restricted CD8+ T cell responses using MHC class I tetramers. We did not find a significant difference among the EC, C, and P animals in the percentage of total CD8+ T cells specific for the Vif RL8 epitope in peripheral blood. This suggests that the selective pressure placed on the virus by this particular CD8+ T cell response is similar in EC, C, and P animals. However, we cannot exclude the possibility that higher frequencies of Vif RL8-specific CD8+ T cells may be found in key immunological tissues such as lymph nodes and GALT in the different groups of animals. We also did not have access to appropriate samples to evaluate for differential T cell escape mutations in these critical immunological tissues; therefore, we cannot be certain that the viral escape phenomenon we are observing in peripheral blood is occurring in tissues that serve as key sites of viral replication. The present experiments also do not address the possibility that functional differences may exist between the Vif RL8-specific CD8+ T cell populations found in animals that become P when compared with those populations found in animals that become EC, leaving open the possibility that our results might be influenced by functional differences in these T cell populations, despite similar Ag-specific T cell response frequencies. Despite these limitations, we propose that the factor differentiating Mamu-B*00801+ P animals from EC and C animals is the ability of the virus to evolve effective CD8+ T lymphocyte escape mutations in the Vif RL8 CD8+ T cell epitope and perhaps also in the other immunodominant Mamu-B*00801–restricted epitopes within the first 8 wk of infection.
Our results, although important in shedding light on the mechanism of elite control in an animal model of MHC class I-associated elite control of immunodeficiency virus replication, may also provide insight into elite control in HIV-1–infected humans. Many similarities exist between our model of elite control and the phenomenon in humans. Mamu-B*00801 and a human allele associated with elite control, HLA-B*2705, have nearly identical peptide binding motifs and bind many of the same peptides (15). Acutely HIV-infected individuals with protective MHC class I alleles appear to have high viral loads that are only gradually brought under control in individuals that go on to become EC (2, 18), similar to SIV-infected Mamu-B*00801+ EC macaques. Due to the fact that most HLA-B*2705+ and HLA-B*5701+ individuals infected with HIV-1 do not become EC, it is reasonable to presume that the mechanism we describe in this study may contribute to the lack of viral containment and disease progression in at least some of these patients.
Nevertheless, important differences do exist between Mamu-B*00801– and HLA-B*2705-/HLA-B*5701–associated elite control. The human alleles predominantly present epitopes derived from HIV-Gag (6, 19, 20). As a structural protein, Gag may be under more evolutionary constraint than the accessory protein Vif, from which the most immunodominant Mamu-B*00801–restricted epitopes are derived. Nevertheless, the specificity of elite control-associated responses for Gag in humans and Vif in macaques may underscore an important functional role of these viral proteins in elite control. It is intriguing to speculate that the fitness cost associated with Vif escape in the Mamu-B*00801 model may reflect a key role for Vif in maintaining viral control in Mamu-B*00801+ EC. It might be interesting to study human elite control to determine whether a similar pattern of escape occurs in HLA-B*2705+/HLA-B*5701+ individuals with progressive HIV infection.
In summary, we have demonstrated that early CD8+ T lymphocyte escape occurs in the Vif RL8 epitope recognized by the most immunodominant CD8+ T lymphocyte population in SIV-infected Mamu-B*00801+ macaques. This escape is seen first at 3 wk postinfection, when all of the other Mamu-B*00801–restricted CD8+ T cell epitopes are still intact. Interestingly, escape in the Vif RL8 epitope is observed preferentially in those animals that do not control viral replication. This escape appears to be independent of differences in viral load or the magnitude of the CD8+ T cell response. Thus, our results implicate the highest frequency immunodominant Mamu-B*00801–restricted CD8+ T cell response directed against the Vif RL8 epitope as important for viral containment.
Supplementary Material
Acknowledgments
This work was supported by National Institutes of Health Grant R01 GM043940 (to A.L.H.) and R37 AI052056, R01 AI049120, R01 AI076114, R24 RR015371, R24 RR016038, and R21 AI081590 (to D.I.W.). This publication was made possible in part by Grant P51 RR000167 from the National Center for Research Resources, a component of the National Institutes of Health, to the Wisconsin National Primate Research Center, University of Wisconsin-Madison.
We thank Shelby O’Connor, Simon Lank, Matt Reynolds, Nicholas Maness, and Jonah Sacha for helpful discussions.
Abbreviations used in this article
- C
controller
- dN
mean number of nonsynonymous substitution per nonsynonymous nucleotide site
- dS
mean number of synonymous substitution per synonymous nucleotide site
- EC
elite controller
- MID
multiplex identifier tag
- P
progressor
Footnotes
This publication’s contents are solely the responsibility of the authors and do not necessarily represent the official views of the National Center for Research Resources or the National Institutes of Health.
The online version of this article contains supplemental material.
Disclosures
The authors have no financial conflicts of interest.
References
- 1.Goulder PJ, Watkins DI. Impact of MHC class I diversity on immune control of immunodeficiency virus replication. Nat Rev Immunol. 2008;8:619–630. doi: 10.1038/nri2357. [DOI] [PMC free article] [PubMed] [Google Scholar]
- 2.Migueles SA, Connors M. Long-term nonprogressive disease among untreated HIV-infected individuals: clinical implications of understanding immune control of HIV. JAMA. 2010;304:194–201. doi: 10.1001/jama.2010.925. [DOI] [PubMed] [Google Scholar]
- 3.Altfeld M, Kalife ET, Qi Y, Streeck H, Lichterfeld M, Johnston MN, Burgett N, Swartz ME, Yang A, Alter G, et al. HLA Alleles Associated with Delayed Progression to AIDS Contribute Strongly to the Initial CD8(+) T Cell Response against HIV-1. PLoS Med. 2006;3:e403. doi: 10.1371/journal.pmed.0030403. [DOI] [PMC free article] [PubMed] [Google Scholar]
- 4.Fischer W, Ganusov VV, Giorgi EE, Hraber PT, Keele BF, Leitner T, Han CS, Gleasner CD, Green L, Lo CC, et al. Transmission of single HIV-1 genomes and dynamics of early immune escape revealed by ultra-deep sequencing. PLoS ONE. 2010;5:e12303. doi: 10.1371/journal.pone.0012303. [DOI] [PMC free article] [PubMed] [Google Scholar]
- 5.Phillips RE, Rowland-Jones S, Nixon DF, Gotch FM, Edwards JP, Ogunlesi AO, Elvin JG, Rothbard JA, Bangham CR, Rizza CR, et al. Human immunodeficiency virus genetic variation that can escape cytotoxic T cell recognition. Nature. 1991;354:453–459. doi: 10.1038/354453a0. [DOI] [PubMed] [Google Scholar]
- 6.Goulder PJ, Phillips RE, Colbert RA, McAdam S, Ogg G, Nowak MA, Giangrande P, Luzzi G, Morgan B, Edwards A, et al. Late escape from an immunodominant cytotoxic T-lymphocyte response associated with progression to AIDS. Nat Med. 1997;3:212–217. doi: 10.1038/nm0297-212. [DOI] [PubMed] [Google Scholar]
- 7.Goulder PJ, Watkins DI. HIV and SIV CTL escape: implications for vaccine design. Nat Rev Immunol. 2004;4:630–640. doi: 10.1038/nri1417. [DOI] [PubMed] [Google Scholar]
- 8.Weintrob AC, Giner J, Menezes P, Patrick EDK, Benjamin J, Jr, Lennox J, Pilcher CD, Eron JJ, Hicks CB. Infrequent diagnosis of primary human immunodeficiency virus infection: missed opportunities in acute care settings. Arch Intern Med. 2003;163:2097–2100. doi: 10.1001/archinte.163.17.2097. [DOI] [PubMed] [Google Scholar]
- 9.Loffredo JT, Maxwell J, Qi Y, Glidden CE, Borchardt GJ, Soma T, Bean AT, Beal DR, Wilson NA, Rehrauer WM, et al. Mamu-B*08-positive macaques control simian immunodeficiency virus replication. J Virol. 2007;81:8827–8832. doi: 10.1128/JVI.00895-07. [DOI] [PMC free article] [PubMed] [Google Scholar]
- 10.Loffredo JT, Bean AT, Beal DR, León EJ, May GE, Piaskowski SM, Furlott JR, Reed J, Musani SK, Rakasz EG, et al. Patterns of CD8+ immunodominance may influence the ability of Mamu-B*08-positive macaques to naturally control simian immunodeficiency virus SIVmac239 replication. J Virol. 2008;82:1723–1738. doi: 10.1128/JVI.02084-07. [DOI] [PMC free article] [PubMed] [Google Scholar]
- 11.Valentine LE, Loffredo JT, Bean AT, León EJ, MacNair CE, Beal DR, Piaskowski SM, Klimentidis YC, Lank SM, Wiseman RW, et al. Infection with “escaped” virus variants impairs control of simian immunodeficiency virus SIVmac239 replication in Mamu-B*08-positive macaques. J Virol. 2009;83:11514–11527. doi: 10.1128/JVI.01298-09. [DOI] [PMC free article] [PubMed] [Google Scholar]
- 12.Yant LJ, Friedrich TC, Johnson RC, May GE, Maness NJ, Enz AM, Lifson JD, O’Connor DH, Carrington M, Watkins DI. The high-frequency major histocompatibility complex class I allele Mamu-B*17 is associated with control of simian immunodeficiency virus SIVmac239 replication. J Virol. 2006;80:5074–5077. doi: 10.1128/JVI.80.10.5074-5077.2006. [DOI] [PMC free article] [PubMed] [Google Scholar]
- 13.Friedrich TC, Dodds EJ, Yant LJ, Vojnov L, Rudersdorf R, Cullen C, Evans DT, Desrosiers RC, Mothé BR, Sidney J, et al. Reversion of CTL escape-variant immunodeficiency viruses in vivo. Nat Med. 2004;10:275–281. doi: 10.1038/nm998. [DOI] [PubMed] [Google Scholar]
- 14.Loffredo JT, Burwitz BJ, Rakasz EG, Spencer SP, Stephany JJ, Vela JP, Martin SR, Reed J, Piaskowski SM, Furlott J, et al. The antiviral efficacy of simian immunodeficiency virus-specific CD8+ T cells is unrelated to epitope specificity and is abrogated by viral escape. J Virol. 2007;81:2624–2634. doi: 10.1128/JVI.01912-06. [DOI] [PMC free article] [PubMed] [Google Scholar]
- 15.Loffredo JT, Sidney J, Bean AT, Beal DR, Bardet W, Wahl A, Hawkins OE, Piaskowski S, Wilson NA, Hildebrand WH, et al. Two MHC class I molecules associated with elite control of immunodeficiency virus replication, Mamu-B*08 and HLA-B*2705, bind peptides with sequence similarity. J Immunol. 2009;182:7763–7775. doi: 10.4049/jimmunol.0900111. [DOI] [PMC free article] [PubMed] [Google Scholar]
- 16.Bimber BN, Burwitz BJ, O’Connor S, Detmer A, Gostick E, Lank SM, Price DA, Hughes A, O’Connor D. Ultradeep pyrosequencing detects complex patterns of CD8+ T-lymphocyte escape in simian immunodeficiency virus-infected macaques. J Virol. 2009;83:8247–8253. doi: 10.1128/JVI.00897-09. [DOI] [PMC free article] [PubMed] [Google Scholar]
- 17.Nei M, Gojobori T. Simple methods for estimating the numbers of synonymous and nonsynonymous nucleotide substitutions. Mol Biol Evol. 1986;3:418–426. doi: 10.1093/oxfordjournals.molbev.a040410. [DOI] [PubMed] [Google Scholar]
- 18.Miura T, Brumme ZL, Brockman MA, Rosato P, Sela J, Brumme CJ, Pereyra F, Kaufmann DE, Trocha A, Block BL, et al. Impaired replication capacity of acute/early viruses in persons who become HIV controllers. J Virol. 2010;84:7581–7591. doi: 10.1128/JVI.00286-10. [DOI] [PMC free article] [PubMed] [Google Scholar]
- 19.Migueles SA, Sabbaghian MS, Shupert WL, Bettinotti MP, Marincola FM, Martino L, Hallahan CW, Selig SM, Schwartz D, Sullivan J, Connors M. HLA B*5701 is highly associated with restriction of virus replication in a subgroup of HIV-infected long term non-progressors. Proc Natl Acad Sci USA. 2000;97:2709–2714. doi: 10.1073/pnas.050567397. [DOI] [PMC free article] [PubMed] [Google Scholar]
- 20.Nixon DF, Townsend AR, Elvin JG, Rizza CR, Gallwey J, McMichael AJ. HIV-1 gag-specific cytotoxic T lymphocytes defined with recombinant vaccinia virus and synthetic peptides. Nature. 1988;336:484–487. doi: 10.1038/336484a0. [DOI] [PubMed] [Google Scholar]
Associated Data
This section collects any data citations, data availability statements, or supplementary materials included in this article.