Abstract
Research Question:
What are the various injuries in road traffic crash cases?
Objectives:
To study various non-fatal injuries in road traffic crash cases.
Study Design:
Hospital based Descriptive study.
Study Population:
The study population comprised of 401 consecutive cases of non- fatal injuries involved in road traffic crashes and reported at Indira Gandhi Medical College hospital, Shimla.
Study Period:
1st June 2005 to 31st May 2006.
Study Variables:
Demographic characteristics of the victims, pattern of injuries and hospital stay of the victims. Types of crashes, time, day and month of crashes, vehicles involved in crashes, use of protective gear etc.
Statistical Analysis:
Percentages, Proportions.
Results:
73% of the injured victims were young between 20-49yrs, male to female ratio being 5.3:1. Employees (34.7%) and occupants of transport vehicles (45.9%) constituted the maximum number of the victims. Major injuries (fractures and abd. injuries) were reported in 53.4% of the victims and fractures of lower limb were the commonest of the injuries (26.3%). Use of seat-belt was found to be alarmingly low (14.3%) amongst the four- wheeler users and its non-use was found to be significantly associated with the major injuries. Helmet was used by 36 cases (66.7%) out of total of 54 users of motorized two-wheelers at the time of crash. Human error was the most reported cause of crash (82%) and the most common mode of crash was skidding and/rolling down (55%).23.1% of the drivers were reported to have consumed alcohol at the time of crash.
Keywords: Epidemiological study, injuries, road traffic crashes
INTRODUCTION
Road traffic injuries account for about 50 million people every year world-vide.[1] Low and middle income countries account for up to 90% of disability adjusted life years (DALYs) lost globally.[2] Furthermore, about 60% of the DALYs lost globally as a result of road traffic injury occurs amongst adults of productive age, between 15- 44 years. Injuries account for approximately one third of the acute patient load in many hospitals in Low income and middle income countries and road traffic injuries constitute the majority of such admissions.[3] In India, over 1.2 million are injured seriously and about 300,000 disabled permanently in road traffic crashes annually.[4] One accident occurs every five minutes in India, with the accident rate corresponding to 45 per 100,000 population.[5] In economic terms, Indian society suffers an estimated loss of 9,845 million USD per year due to road traffic crashes. A small reduction of 10% in road traffic injury could subject to saving of about 895 million USD (on 11/06/12 dollar rates) per year.[6] Road crash injury is largely preventable and predictable; it is a human-made problem amenable to rational analysis and countermeasures.
MATERIALS AND METHODS
The study was carried out at Indira Gandhi Medical College hospital, Shimla. Shimla is the capital of the state of Himachal Pradesh and is situated at an altitude of 2250 meters from the mean sea level. This study was a Hospital based descriptive study and was conducted for a period of one year from 1st June 2005 to 31st May 2006. Cases were studied in the departments of Casualty, Orthopedics, Surgery, Neurosurgery and Cardio-thoracic Surgery. The study population comprised of 401 consecutive cases of non- fatal injuries involved in road traffic crashes and reporting to Indira Gandhi Medical College hospital, Shimla during the study period. The information about the patients reporting and admitted as cases of road traffic crashes was obtained daily from casualty and records of outpatient department of the hospital. These patients were then contacted in the related wards. The victims were interviewed for the injury details and the circumstances leading to crash and the same were recorded on a pre-designed and pre-tested proforma along with basic demographic information. Bed side study also included follow up of the cases.
Relatives/Attendants were interviewed in case the condition of the victims demanded so. The medico-legal records, case sheets and police records were referred to for collecting additional information wherever necessary for cross checking. Data collected was entered in the computer for analysis after checking for completeness and consistency. Data was then analyzed using statistical package Epi Info version 3.2. An road traffic injury (RTI) is any injury secondary to crashes originating, terminating or involving a vehicle partially or fully on a public highway.[7]
RESULTS
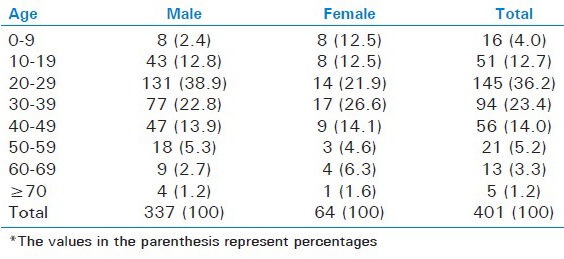
It was observed that the maximum number of cases were in the age group of 20-29 (36.2%), followed by the age group of 30-39 yrs. The least number of cases were amongst >70 years of age (1.2%) [Table 1].
Table 1.
Distribution of cases according to age and sex

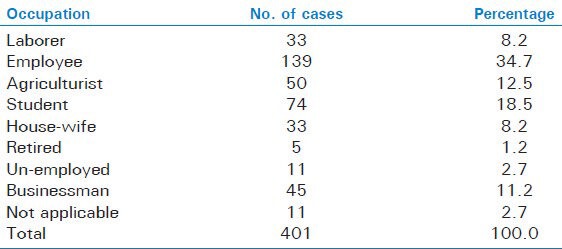
The crash rates were found 5.3 times higher in males (84%) than in females (16%). The time distribution of the road traffic crashes revealed that more than 60% of the crashes occurred during the day time (6.00am- 6.00pm). The present study recorded highest number of crash cases amongst employees (34.7%), then in students (18.5%) and agriculturists (12.5%) in the decreasing order of frequency [Table 2].
Table 2.
Occupational status of the victims

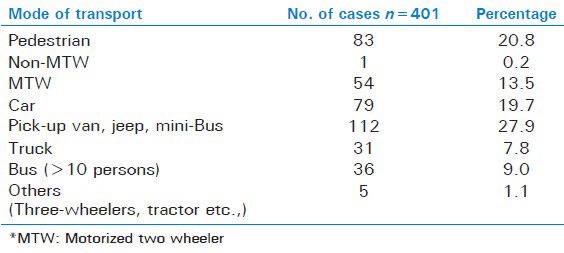
According to this study, majority of people used light transport vehicles (27.9%) as the major mode of their travel, followed by pedestrians (20.7%) and cars (19.7%). Motorized two-wheelers users constituted 13.5% of the total cases [Table 3]. Overall occupants of the vehicles (79.3%) constituted the largest number of the cases. Of these, the transport vehicles accounted for 45.9%, followed by the occupants of vehicles for personal use (33.4%). Pedestrians were involved in 20.7% of the cases. It was also found that 33.4% of the victims were drivers themselves.
Table 3.
Distribution of the cases according to the mode of transport

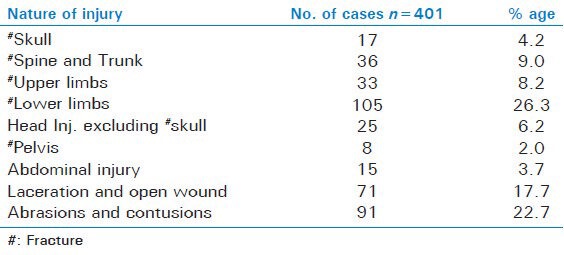
Major injuries i.e., fractures and abdominal injury were reported in 214 (53.4%) of the cases, whereas 187 (46.6%) had minor injuries in the form of abrasions, contusions, lacerations and open wounds. Among the major injuries, Fractures of lower limbs were the most common 105 (26.3%), followed by Fractures of Spine and Trunk 36 (9%) cases. The least number of cases were of Fracture Pelvis 8 (2%) [Table 4].
Table 4.
Distribution of pattern of injuries amongst cases

Most of the cases 220 (54.9%) didn’t require admission and were treated and discharged on outpatient basis, 179 (44.6%) required indoor treatment. Only two cases could not be traced. Majority of the cases 269 (67.0%) required indoor stay for less than one week, while as many as 79 (19.7%) cases needed a prolonged stay of more than two weeks. 53 (13.3%) of the victims settled for a stay of the duration between one to two weeks. Hospital stay among victims of the major injuries was overwhelmingly prolonged in comparison to that of the minor injuries whereas only two cases of minor injuries (1.6%) required a hospital stay of >1 week as against 29 (60.2%) of the cases of major injuries.
The helmet was found to be used by 36 cases (66.7%) at the time of crash, out of total of 54 users of motorized two-wheelers. In comparison, only 37 (14.3%) of the users of four-wheelers used the seat-belt [Table 5]. Fracture skull was observed in 14 (77.8%) cases; who did not use helmet as compared to 4 (22.2%) of the cases having used helmet at the time of crash. More number of the major injuries 116 (92.1%) had taken place amongst the users of four wheelers, when they did not wear seat belt at the time of crash. In contrast, only 10 (7.9%) of the serious injuries were observed with the use of seat belt at the time of the crash [Table 6].
Table 5.
Distribution of cases according to use of protective gear

Table 6.
Distribution of cases of fracture skull according to the use of helmet

Maximum number of crashes 221 (55.1%) occurred due to skidding and or/rolling down. Next in the order of frequency were 113 (28.2%) crashes due to side impact and 64 (16%) cases were due to head on collision. The types of crash differed in frequency according to two halves of the day. Head on collision and side impact types of crashes were reported more during day time than at night whereas cases of skidding and or/rolling down occurred with almost same frequencies.
Amongst the road users, Drivers were involved in maximum numbers 36 (56.3%) number of head on crashes; whereas passengers 138 (62.4%) were affected most among cases of skidding and/rolling down. The highest number of cases 82 (72.6%) of side impact were reported among pedestrians. A total of 184 (46%) of Cases were reported due to crashes at the curved section of the road, out of which skidding and/rolling down and head on collision accounted for 58 and 47% respectively among their categories. Most of the cases of side impact (45%) were reported at the straight level of road. Drivers involved in most of the crash cases 75 (56%) were professionals while 51 (38.4%) were non-professionals. Driver's status could not be ascertained in 8 (5.7%) of cases.
The chief cause of the crash cases was due to human error 328 (81.8%), of which over speed and overtaking accounted for 113 (28.2%) and 42 (10.5%) respectively. 31 (23.1%) of the drivers of different vehicles had consumed alcohol at the time of crash. Other causes reported in the order of frequency were mechanical fault 39 (10.1%) and road conditions 34 (8.4%). Crashes due to Frost accounted for 15 (3.7%) of all the cases.
DISCUSSION
A total of 401 cases of road traffic crash cases were reported at I.G.M.C, Shimla, during one year (June 2005 - May 2006).
The highest numbers of cases (36.2%) were reported in the age group of 20-29 years. Similar findings were observed in other studies.[8,9] These results may be ascribed to the risk taking behaviour in this age group. It was also observed that 73.4% of the cases belonged to the productive age groups of 20-49 years. Similar observations were also reported in other studies.[9,10,11] The crash rates were 5.3 times higher in males (84%) than in females (16%) according to this study. Similar observations were reported by other authors.[4,5,12,13] This ratio closely matches that of India i.e., 4.5:1.[14] However in another study conducted in Delhi, the ratio was as high as 9:1.[15] The predominance of males can be due to more exposure and risk taking tendency as compared to females.
The present study recorded the highest number of crash cases among employees (34.7%), then in students (18.5%) and agriculturists (12.5%) in decreasing order of frequency. It may be due to the fact that Shimla being the state capital, houses the maximum number of employees besides having a large number of educational institutions and also a famous tourist destination. Our observations are different from other studies,[8,9] wherein the laborers have been reported to be the largest group involved in road crashes. Whereas employees were the second largest group in Pondicherry,[9] students were the next in the order of involvement in Nepal.[16]
According to this study, majority of people used light transport vehicles (27.9%) as the major mode of their travel, followed by pedestrians (20.7%) and cars (19.7%). Motorized two-wheelers users constituted 13.5% of the total cases. Another study from central India[12] has also highlighted the involvement of light transport vehicle (LTVs) as the major mode of travel by the victims of road traffic crashes. However other studies[8,9,10] have reported pedestrians to be dominatingly involved with the road crashes. Overall vehicle occupants of the transport vehicles (45.9%) constituted the largest number of the cases. Similar findings were reported in other studies.[9,16] It was also found that 33.4% of the victims were drivers themselves. A study from the South-India[9] has also noted the similar proportion of the drivers among the victims.
Fractures were noticed in nearly half of the cases as the most common injury and minor injuries were observed in 46.6% of the cases. Among the fractures, the involvement of lower limbs (26.3% of all injury cases) was the highest. Similar observation highlighting the dominant presentation of fractures of lower limbs was reported by Supriya et al.[13] In contrast, a study from rural Haryana[17] reported abdominal injuries to be the most common and another study from Delhi[5] reported superficial injuries to be chief presenting finding. Major injuries 52 (63%) in comparison to minor injuries 31 (37%) were reported more among the pedestrians, otherwise the nature of injuries did not seem to be affected by the mode of transport and this was also not statistically significant (χ2= 6.2636, df = 3, P > 0.05).
Though majority of the cases (54.9%) with injuries did not require indoor treatment, hospital stay among those with major injuries was more prolonged; 60.2% of cases with major injuries required a hospital stay of more than one week as compared to only two cases of minor injuries which required admission for more than two weeks. This difference was statistically highly significant (χ2= 162.8681, df = 3, P < 0.0001).
The use of protective gear varied between the two groups. While helmets were used by 2/3rd (66.7%) of the motorized two-wheeler users, seat-belt use was noticed only in 14.3% of the four wheeler users. It was found in this study that more number of cases of fracture skull occurred among the non-users as compared to the users of helmets. This difference was statistically highly significant (χ2= 17.33, df = 1, P < 0.00001). Similarly major injuries were reported to be higher in numbers, when seat-belts were not used by the four-wheeler users and this difference was once again statistically significant (χ2= 8.22, df = 1, P < 0.01). The protection offered by these protective gears is well known. It has been shown by studies[18,19] that use of helmets can reduce fatal and serious injuries by between 20-45%. Similar results have been shown in a study conducted at Delhi.[20] While the seat-belts may cause injuries, these are typically minor abrasions and bruising to chest and abdomen and without seat-belts the injuries would have been more severe.[21]
Maximum number of crashes (55.1%) were reported to be due to skidding and/rolling down, followed by side impact (28.2%) and head on collisions (16%). It may be due to the hilly topography of the state. Sideway impact as a major type of crash was observed by Ganveer et al.[12] whereas Ghosh[15] had reported getting knocked down by a vehicle as the most common mode of crashes in Delhi.
Types of crashes were also observed differently at various road levels. The highest number of crashes (46%) were reported to have occurred at curved level of road, out of which skidding and/rolling down and head on collisions types, accounted for 58% and 47% respectively. Most cases of side impact (45.1%) were observed at the straight level of road. Our observations differed from Ghosh,[15] who reported maximum crashes (65.2%) on straight level roads, 5.6% at curved level and 29.2% on intersections. More number of crashes on curved level in this study could be because of: hilly terrain and therefore the roads being zigzag, faulty engineering like presence of sharp curves, poor adherence to traffic rules such as blowing of horns at blind curves and interplay of other environmental factors like; poor visibility at night and adverse weather conditions e.g., fog, which are fairly common in this part of country. Nearly 20% of the crashes were reported during rainy and foggy conditions. Similar observations for increase in the number of crashes during unfavourable weather have been observed in Delhi[8] and Nepal.[16]
CONCLUSION
Non-fatal injuries in road traffic crashes were encountered most frequently (73.4%) in the young age groups (20-49 years) and males were affected more than 5.3 times as compared to the females. The present study recorded the highest number of cases among employees (34.7%). Occupants of the transport vehicles i.e., passengers constituted the majority of cases (45.9%). Major injuries (fractures and abd. injuries) were reported in 53.4% of the victims and fractures of lower limb were the commonest of the injuries (26.3%). Use of seat-belt was found to be alarmingly low (14.3%) amongst the four- wheeler users and was found to be significantly associated with the major injuries. Helmet was used by 36 cases (66.7%) out of total of 54 users of motorized two-wheelers at the time of crash.
RECOMMENDATIONS
Road safety may be ensured through education of the road users frequently involved and injured in road traffic crashes (e.g., students, youth). Adolescents and youth can be taught about responsible driving behaviours such as reaction time, braking distance, defensive driving and hazards of alcoholic drinks and drugs, at their respective educational institutions as well as in the unorganized sector through special road safety awareness campaigns. Strict enforcement of the rules and regulations pertaining to the traffic control and use of appropriate protective gears should be ensured by the concerned agencies.
Better road signs such as avoidance of construction of sharp curves in hilly terrain and markings can be highly effective and cost effective ways of improving road safety. Professional drivers should be given a minimum knowledge on first aid care to take care of crash victims. Health care institutions should evolve a protocol to deal with the road traffic crash victims.
Footnotes
Source of Support: Nil
Conflict of Interest: None declared.
REFERENCES
- 1.Geneva: WHO; 2004. World Health Organization. World report on road traffic injury prevention. [Google Scholar]
- 2.Krug EG, Sharma GK, Lozano R. The global burden of injuries. Am J Public Health. 2000;90:523–6. doi: 10.2105/ajph.90.4.523. [DOI] [PMC free article] [PubMed] [Google Scholar]
- 3.Odero W, Garner P, Zwi A. Road traffic injuries in developing countries: A comprehensive review of epidemiological studies. Trop Med Int Health. 1997;2:445–60. [PubMed] [Google Scholar]
- 4.Kopits E, Cropper M. Traffic fatalities and economic growth. Accid Anal Prev. 2005;37:169–78. doi: 10.1016/j.aap.2004.04.006. [DOI] [PubMed] [Google Scholar]
- 5.Parmod KV, Tiwari KN. Epidemiology of road traffic injuries in Delhi: Result of a survey. Regional health forum WHO South-East Region. 2004:8. [Google Scholar]
- 6.Tiwari G, Mohan D, Muskang R Mumbai urban transport project 2: Accident study. 1-342. New Delhi: TRIPP, Indian Institute of Technology Delhi. Final report prepared for World Bank; 1998. [Google Scholar]
- 7.Geneva: WHO; 2002. World Health Organization. The injury chart book. A graphical overview of the global burden of injuries. [Google Scholar]
- 8.Mehta SP. An epidemiological study of road traffic cases admitted in Safadarjung Hospital New Delhi. Indian J Med Res. 1968;56:456–66. [PubMed] [Google Scholar]
- 9.Jha N, Srinivasa DK, Roy G, Jagdish S. Injury pattern among road traffic accident cases: A study from south India. Indian J Community Med. 2003;28:85–90. [Google Scholar]
- 10.Chunlin C, Huichun W, Xiaohong S. New Delhi, India: Proceeding of International Conference of Traffic Safety 27-30 Jan; 1991. The investigation and analysis of 1000 cases of traffic injury emergency treatment in five cities in China 1991. [Google Scholar]
- 11.Balogun JA, Abereoje OK. Pattern of road traffic accident cases in a Nigerian university teaching hospital between 1987 and 1990. J Trop Med Hyg. 1992;95:23–9. [PubMed] [Google Scholar]
- 12.Ganveer GB, Tiwari RR. Injury pattern among non-fatal road accident cases: A Cross-sectional study in central India. Indian J Med Sci. 2005;59:9–12. [PubMed] [Google Scholar]
- 13.Patil SS, Kakade RV, Durgawale PM, Kakade SV. Pattern of road traffic injuries: A study from western Maharashtra. Indian J Community Med. 2008;33:56–57. doi: 10.4103/0970-0218.39248. [DOI] [PMC free article] [PubMed] [Google Scholar]
- 14.The Government of India, Ministry of home affairs, National Crime Record Bureau, New Delhi, Accidental deaths and suicides in India. 1999 [Google Scholar]
- 15.Ghosh PK. Epidemiological study of the victims of vehicular accidents in Delhi. J Indian Med Assoc. 1992;90:309–12. [PubMed] [Google Scholar]
- 16.Jha N, Aggarwal CS. Epidemiological study of road traffic accident Cases: A Study from Eastern Nepal, WHO South-East Asia Region, RHF 8-1. 2004 [Google Scholar]
- 17.Singh A, Bhardwaj A, Pathak R, Ahluwalia SK. An epidemiological study of road traffic accident cases at a tertiary care hospital in rural Haryana. Indian J Community Health. 2011;23:53–5. [Google Scholar]
- 18.Servadei F, Begliomini C, Gardini E, Giustini M, Taggi F, Kraus J. Effect of Italy's motorcycle helmet law on traumatic brain injuries. Inj Prev. 2003;9:257–60. doi: 10.1136/ip.9.3.257. [DOI] [PMC free article] [PubMed] [Google Scholar]
- 19.Kulanthayan S, Umar RS, Hariza HA, Nasir MT, Harwant S. Compliance of proper safety helmet usage in motorcyclists. Med J Malaysia. 2000;55:40–4. [PubMed] [Google Scholar]
- 20.Mishra BK, Banerji AK, Mohan D. Two-wheeler injuries in Delhi, India: A study of crash victims hospitalized in a neuro-surgery ward. Accid Anal Prev. 1984;16:407–16. [Google Scholar]
- 21.Hill JR, Mackay GM, Morris AP. Chicago: Association for Advancement of Automotive Medicine; 1992. Chest and abdominal injuries caused by seat belt loading. In: Proceedings of the 36th Annual Conference of the Association for the Advancement of Automotive Medicine (AAAM), Portland, Oct 1992; pp. 25–41. [Google Scholar]


