Abstract
A new graph-based approach for segmentation of luminal and external elastic lamina (EEL) surface of coronary vessels in gated 20 MHz intravascular ultrasound (IVUS) image sequences (volumes) is presented. The approach consists of a fully automated segmentation stage (‘new automated’ or NA) and a user-guided computer-aided refinement (‘new refinement’ or NR) stage. Both approaches are based on the LOGISMOS approach for simultaneous dual-surface graph-based segmentation. This combination allows the user to efficiently combine general information about IVUS image appearance and case-specific IVUS morphology and therefore deal with frequently occurring issues like calcified plaque – causing signal shadowing – and imaging artifacts. The automated segmentation stage starts with pre-segmenting the lumen to automatically define the lumen centerline, which is used to transform the segmentation task into a LOGISMOS-family graph optimization problem. Following the automated segmentation, the user can inspect the result and correct local or regional segmentation inaccuracies by (iteratively) providing approximate clues regarding the location of the desired surface locations. This expert information is utilized to modify the previously calculated cost functions, locally reoptimizing the underlying modified graph without a need to start the new optimization from scratch.
Validation of our method was performed on 41 gated 20 MHz IVUS data sets for which an expert-defined independent standard was available. Resulting from the automated stage of the approach (NA), the mean and standard deviation of the RMS area errors for the luminal and external elastic lamina surfaces were 1.12 ± 0.67 mm2 and 2.35 ± 1.61 mm2, respectively. Following the refinement stage (NR), the RMS area errors significantly decreased to 0.82±0.44 mm2 and 1.17±0.65 mm2 for the same surfaces, respectively (p < 0.001 for both surfaces). The approach is delivering a previously unachievable speed of obtaining clinically relevant segmentations compared to the current approaches of automated segmentation followed by manual editing.
Index Terms: intravascular ultrasound, segmentation, graph-based segmentation, segmentation refinement
I. Introduction
Intravascular ultrasound (IVUS) provides two-dimensional cross-sectional images of vessel wall architecture and plaque morphology. When augmented with motorized pullback, three-dimensional images are formed. IVUS imaging is common in coronary catheterization laboratories, augmenting traditional X-ray angiography imaging and providing information about the coronary wall morphology. While traditional coronary angiography provides information about the coronary lumen, IVUS adds information about the coronary wall, its remodeling in response to the atherosclerotic processes, and – when virtual histology is included – about atherosclerotic plaque composition. IVUS imaging is routinely performed during percutaneous coronary interventions like balloon angioplasty with or without stent placement to determine vessel geometry, plaque status, presence of ulcerations, to correctly size the angioplasty balloons, determine proper diameter and length of coronary stents, assess resulting stent apposition, etc.
To obtain IVUS images, an imaging catheter is extended distally to the desired location of the coronary artery under fluoroscopic guidance. Three-dimensional IVUS imaging is performed by mechanical pullback of the imaging catheter from its initial distal (downstream) position. Typically, the acquired image frames are cardiac cycle (usually R-wave) gated to provide phase-specific 3-D IVUS image sequences. Such R-wave gated sequences can be visualized and quantitatively analyzed as a straight pipe or in its correct geometry when fused with two-plane angiographic image data providing 3-D vessel geometry [1].
Atherosclerotic plaque is located between two borders (in 2-D) or surfaces (in 3-D) that can be identified in IVUS images – luminal surface (interface between blood and intima) and the surface formed by the external elastic lamina (EEL, media–adventitia interface). IVUS segmentation of the lumen and EEL borders/surfaces is of substantial clinical interest and contributes to clinical decision making. Yet, no truly reliable and consistently accurate IVUS segmentation methods exist that would guarantee segmentation success in a clinical setting. This is especially true considering that close-to-realtime performance is required.
IVUS segmentation methods have been reported for almost 20 years. Despite a considerable effort devoted to this task and a number of partial successes, no perfect solution emerged that would allow reliable automated analysis of IVUS data. There is a number of reasons making IVUS segmentation very difficult due to the presence of a variety of artifacts including blood speckle, near-field artifacts, strut or guide wire artifacts, reverberations, non-uniform rotational or axial distortion, missing information due to calcified plaque shadowing, etc. The early methods were based on 2-D dynamic programming detecting the lumen and EEL borders independently [2]–[4]. Three-dimensional approaches followed and included active surfaces [5], [6], level sets [7], [8], shape models [9], inverse scattering algorithms [10], or combination of transversal and longitudinal model- and knowledge-guided contour detection techniques [11], to name a few. Recently, our group has developed a method for simultaneous segmentation of multiple surfaces called LOGISMOS [12], [13] and applied to 3-D IVUS segmentation [14]. Despite the variety of approaches developed for IVUS segmentation, one observation remains omnipresent in all these methods – while each of the cited automated methods successfully segments IVUS image data in many IVUS image frames, they all fail in a considerable number of frames making automated IVUS segmentation virtually impossible to use in a clinical setting. In all these locations – many of which are of utmost clinical relevance – the interventional cardiologist must resort to tedious and time-consuming manual tracing of a large number of IVUS frames to obtain acceptable boundaries and desirable quantitative indices of morphology or plaque virtual histology. The fact that obtaining virtual histology information about the plaque tissue is directly dependent on correct segmentation of the luminal and EEL surfaces further increases importance of this task.
Motivated by the pressing clinical need of achieving successful segmentation of all IVUS frames of interest and realizing that the most important coronary locations are the most diseased ones, which may suffer from the most severe imaging artifacts like calcium shadowing (Fig. 1), we have developed a two-stage approach consisting of automated and semi-automated steps based on optimal dual-surface graph based segmentation (LOGISMOS) [12]–[14]. The approach was designed for gated 20 MHz IVUS image data, but the principle can be adapted/generalized to other IVUS imaging protocols (e.g., 40 MHz IVUS pullbacks). In the first stage, the graph is built and an initial segmentation of the lumen and EEL are determined automatically. The second stage is optional and can be seen as a “dialog” between the user and the previously utilized algorithm, where the user provides rough clues for the desired locations of at-this-stage incorrectly positioned boundaries by augmenting the graph's objective function. Utilizing such locally targeted expert interactions that act directly on the optimized graph, real-time interaction responses yield updated pairs of segmentation surfaces in an interactive, user-driven, and semi-automated fashion. A small number of interactions is typically sufficient to achieve fully satisfactory 3-D segmentations of IVUS image sequences consisting of hundreds of R-wave gated frames. As a result, a highly accurate, highly automated, and performance-efficient method has been developed facilitating routine segmentation of complete IVUS pullback sequences almost immediately after completing the IVUS image acquisition.
Fig. 1.

Example of regional segmentation errors caused by plaque calcification and image artifacts (locations marked with ellipses). Note that the image was axially reformatted from a sequence of R-wave gated IVUS pullback images.
II. Method
As mentioned in the Introduction, the proposed approach to gated 20 MHz IVUS segmentation consists of two main stages: a) initial automated segmentation and b) interactive graph-optimization driven segmentation refinement, if needed. In stage a), lumen (inner) surface and EEL (outer) surface are segmented simultaneously in 3-D. For this purpose, the lumen is first roughly pre-segmented and luminal centerline determined, facilitating construction of the graph for LOGISMOS-based dual surface segmentation [12], [13]. Both the pre-segmentation and the simultaneous dual-surface segmentation are fully automated and yield optimal surfaces with respect to the employed objective function. Any local or regional segmentation errors can be identified by the expert operator and efficiently corrected in the second stage of our approach. The basic idea behind our refinement stage is that the user is allowed to interact directly with the LOGISMOS-based segmentation algorithm by providing rough clues regarding the desired boundary location.
A. Graph Construction for LOGISMOS Segmentation
Both the lumen pre-segmentation and dual-surface segmentation in stage a) of our approach utilize the LOGISMOS approach. The main idea of the LOGISMOS-based segmentation strategy is to transform the segmentation problem into a graph optimization problem (finding a minimum-cost closed set) [12] by means of a maximum-flow algorithm [15]. Thus, global optimality of the resulting dual-surface segmentation is guaranteed according to the employed cost function, hard smoothness constraints of the respective surfaces, and interaction constraints between pairs of surfaces. The hard smoothness constraint for a particular surface corresponds to its maximum allowed roughness. Surface interaction constraints reflect the minimum and maximum allowed distances between surface pairs [12].
For dual-surface LOGISMOS, a weighted graph G containing two sub-graphs G = {Gi = (Vi, Ai) : i = 1,2} is constructed, where Vi represents a graph node set, Ai a graph arc set, G1 inner surface (S1) sub-graph and G2 outer surface (S2) sub-graph. υ ∈ Vi is a graph node on a column, the length of which is lp. Each node υ corresponds to a point of intensity I(x, y, z) in the volumetric image stack I. In this context, the final LOGISMOS segmentation result is represented by two meshes; one for the inner surface and one for the outer surface. The vertices of these meshes correspond to nodes of the graph G that are determined by the LOGISMOS (optimization) method. Thus, for each column of the graph G, each surface will be assigned exactly one node. As will be described below, inter-surface constraints will be introduced to avoid folding or overlap of inner and outer surface.
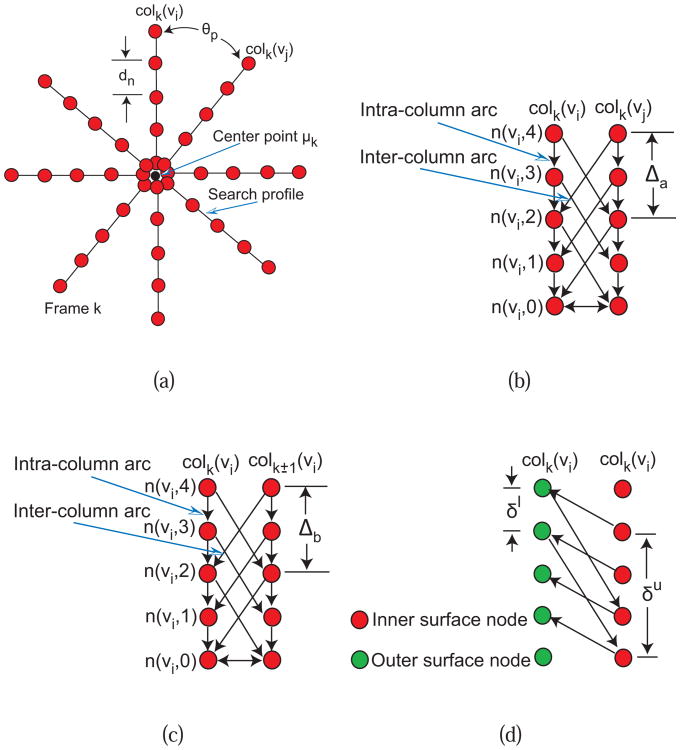
Gi consists of sub-graphs Gik ∈ Gi with k = 1,2, …,Z where Z represents the number of image frames in the stack. For each sub-graph Gik, np graph columns are generated from a center point μk in radial directions at θp = 2π/np angle increments (Fig. 2(a)). The distance between nodes along the column is dn, which is set to half the pixel size. Based on this graph construction, we have lp = rf/2 nodes, where rf is half the frame (image) size in pixels.
Fig. 2.
Graph construction for dual-surface LOGISMOS. (a) Search profiles of a single surface are constructed starting from vessel centerline point μk determined for every IVUS frame. (b) LOGISMOS graph structure of a single surface with arcs enforcing the surface smoothness constraints between adjacent columns on the same frame. (c) LOGISMOS graph structure of a single surface with arcs enforcing the surface smoothness constraints between the corresponding columns on adjacent image frames. (d) LOGISMOS graph structure with arcs enforcing the inter-surface constraints. See [12], [13] for additional details.
Intra-column arcs are built to connect nodes n(υ, m) to n(υ, m − 1) on a column colk(υ) with infinite weights, where m is the column node index. Inter-column arcs are built to connect the node n(υi,m) to the node n(υj,m − Δa) with infinite weights (Fig. 2(b)), where Δa is the in-frame hard smoothness constraint between neighboring columns. To obtain a 3-D graph Gi, sub-graphs {Gik: k = 1, 2,…,Z} are connected by inter-column arcs, which pairwise connect nodes n(υi, m) to nodes n(υi, m − Δb) on the column colk(υi) and colk±1(υi) with infinite weights (Fig. 2(c)), where Δb is inter-frame hard smoothness constraint.
Graphs G1 and G2 are interconnected by inter-surface arcs which connect nodes n(υi,m) of G2 and n(υi,m − δu) of G1 with infinite weights, and nodes n(υi, m) of G1 and n(υi, m + δl) of G2 with infinite weights (Fig. 2(d)), where δl and δu are lower-limit and upper-limit interaction constraints representing the minimum and maximum allowed distances between surfaces S1 and S2.
Graph node weight sets Ci with i ∈ {1,2} (objective or cost functions) are derived from volumetric image data to reflect local image characteristics. In this context, note that weights (costs) can be arbitrary real values [12]. In addition, linear soft smoothness constraints are utilized, as proposed by Song et al. in [16]. For this purpose, constant weight αia (in-frame) and αib (inter-frame) arcs are introduced to penalize shifts between adjacent vertices on surfaces Si.
The same LOGISMOS-based segmentation approach is utilized for lumen pre-segmentation and dual-surface lumen–EEL segmentation. All parameters of our method were determined experimentally on five cases, which were not included in the test data set described in Section III-A. Both approaches use the same graph construction, with the exceptions of hard smoothness constraints, cost function design and utilized center point locations {μk : k = 1,2, …, Z}. Most graph-construction parameters (e.g., Fig. 2) directly related to the imaging protocol like in-frame resolution and pullback speed. In this context note that information about in-frame pixel sizes is available from the DICOM headers of the IVUS image sequences. Frame-to-frame spacing is derived from the IVUS catheter pullback speed. While the frame-to-frame spacing may vary slightly for different locations of the frame in curved vessels, these differences are small from frame to frame due to a substantial rigidity of the IVUS catheter tip. Currently, these differences are not considered by the utilized approach although they may be determined from the reconstructed 3D geometry of the vessel and the associated IVUS pullback trajectory as previously described in [1].
In this application, the graph-construction parameters common to the pre-segmentation and dual-surface segmentation were: np = 36, δl = 4 nodes, and δu = lp nodes. Also, the following common soft smoothness α1a = 0.01, α1b = 0.01, α2a = 0.005, and α2b = 0.005 were utilized. Specific parameters for hard smoothness constraints of inner (Δ1) and outer (Δ2) surfaces are provided in Sections II-B1 and II-B2 below. In general, we found that setting parameters for graph construction is not critical for performance as long as: a) the segmentation result can be represented within the graph framework and b) reasonable constraints (e.g., smoothness) are defined. Consequently, for a new imaging protocol, these graph construction parameters can be easily adjusted by utilizing a small set of representative IVUS pullbacks. Furthermore, the cost function design presented in the subsequent sections depends on the utilized IVUS transducer and needs to be adapted accordingly.
B. Automated Segmentation
1) Lumen Pre-segmentation
The goal of this step is to roughly pre-segment the inner surface S1 (luminal surface) of the IVUS volume to estimate the lumen centerline, which will be used for the subsequent dual-surface segmentation (Section II-B2).
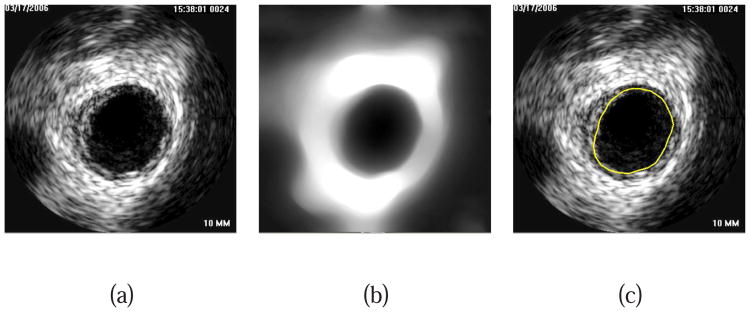
For the lumen pre-segmentation, a dual-surface LOGISMOS framework is utilized and G2 presence is solely used to constrain the search for G1; there is no goal of determining an accurate location of the S2 surface at this step. Note that only rough boundary locations are required for this step. First, a total variation (TV) regularized L1 model-based decomposition [17] with regularization parameter λ = 0.01 is used to remove high-frequency details like speckle noise, but preserves information regarding location of the inner wall boundary (Figs. 3(a) and 3(b)).
Fig. 3.
Lumen pre-segmentation. (a) Original IVUS image. (b) Image after TV decomposition. (c) Lumen pre-segmentation result shown in yellow.
The LOGISMOS-based lumen pre-segmentation uses the center of the imaging catheter (image center) as μk for k = 1,2,…,Z. The cost functions (C1 and C2) for surfaces Si assign the following costs to column nodes n(υ,j):
| (1) |
Normalized gradient magnitude (range of [0, 1]), gradient direction, and surface normal vectors (in graph column direction and pointing away from μk) are denoted gmag(υ, j), gdir(υ, j), and nυ, respectively. gmax is the maximum gradient magnitude of the volume. The definition of costs (Eq.1) is motivated by the observation that for the majority of normal (i.e., without pathology or artifacts) 20 MHz IVUS image frames, the lumen is darker than media/adventitia layer, which is darker than surrounding background of the vessel. Note that smaller deviations from this pattern are likely not critical, because of other additional constraints (smoothness). However, large areas that deviate from this pattern may require interactive refinement. The gradient calculation is based on Gaussian derivatives with standard deviation of σ = 0.1 mm. This parameter depends on image resolution and needs to be adjusted for different imaging protocols. Linear interpolation is utilized to obtain costs ci(υ, j). The following hard smoothness constraints were used for pre-segmentation: Δ1a = 15, Δ1b = 15, Δ2a = 6, and Δ2b = 9. Note that parameters were set such that smoothness constraint is more relaxed for the inner boundary (Δ1a and Δ1b) compared to the outer boundary (Δ2a and Δ2a), because the inner boundary (lumen) frequently exhibits more shape variation than the outer boundary (EEL), which is more circularly shaped. Fig. 3(c) shows an example of lumen pre-segmentation.
2) Dual-Surface Segmentation
The dual-surface segmentation is based on the same LOGISMOS framework (Section II-A). The center position μk for each image frame is however derived from the lumen pre-segmentation (Section II-B1) and original unfiltered image data are utilized for calculating cost functions.
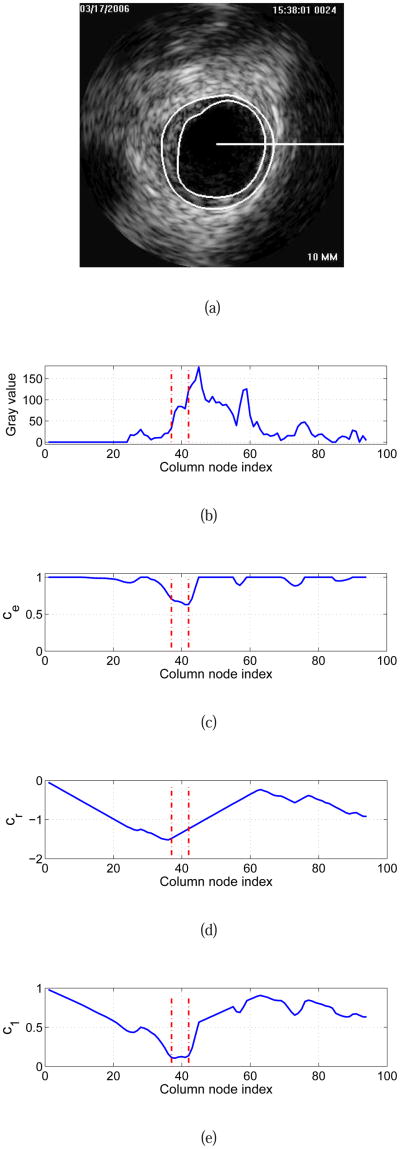
Outer boundary (EEL) costs c2(υ, j) are calculated as given in Eq. 1. As a cost function for the inner boundary (luminal surface), a combination of edge-based and in-region-based costs are utilized
| (2) |
as depicted in the example given in Fig. 5. In Eq. 2, ξ is set to 0.4 and represents a weighting factor between two cost terms. The term ce(υ, j) represents an edge based cost function equivalent to Eq. 1, and
Fig. 5.
Cost function calculation for dual-surface automated segmentation. (a) Original IVUS image with expert-defined segmentation (independent standard). The horizontal white line indicates the location of a graph column (starting at the pre-segmentation determined lumen center μk) that is utilized for illustration of cost calculation. (b) Column-corresponding gray-value profile. Zero on the horizontal axis represents center μk. (c) Edge cost function ce and (d) in-region cost function cr derived from (b). (e) Final cost function c1 for the inner surface. Vertical lines shown in red indicate the locations of the inner and outer contours of the independent standard (Fig. 5(a)) on this column.
| (3) |
represents an in-region cost term with a gray-value weighting function
| (4) |
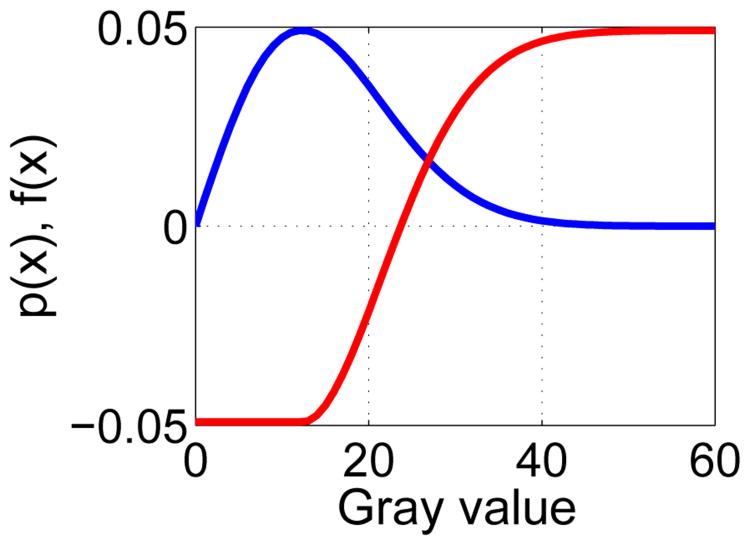
In this context, the gray-value at node n(υ, m) is denoted by x(υ, m). The design of the weighting function is inspired by the Rayleigh probability density function (PDF), which is given by
| (5) |
where x is the gray-value of a pixel and a > 0. Specifically, we model gray-values of the lumen region by means of a Rayleigh PDF, which is well suited to describe the typical speckle noise pattern found in ultrasound images [18] and has also been utilized in the context of IVUS segmentation (e.g., [1], [7]). A plot showing the relationship between Eqs. 4 and 5 is given in Fig. 4. Function f(x) returns low costs if IVUS gray-values are likely belonging to the lumen. Note that f(x) was designed such that the catheter which is blackened out with a gray-value of zero also receives low costs. Parameter a of the Rayleigh PDF is estimated from the pre-segmented lumen (Section II-B1) with
Fig. 4.
Relation between estimated Rayleigh probability density function (blue curve) and utilized gray-value weighting function f(x) (red curve); a = 12.3 was utilized for both plots.
| (6) |
where xi is a gray-value sampling point and N is the number of sampling points in the ROI defined as a sub-region of the volume between the catheter surface and the segmented lumen (inner) surface.
Graph parameters used for automated dual-surface IVUS segmentation were as follows. Parameter σ was set to the same value as in Section II-B1. For hard smoothness constraints, Δ1a = 5, Δ1b = 6, Δ2a = 4, and Δ2b = 6 was utilized. For the selection of these parameters, the same considerations, as outlined in Section II-B1, apply. However, because of the previously determined center position μk, the constraints are adjusted to be more restrictive.
C. User-Guided Segmentation Refinement
Our segmentation refinement method is directly based on the graph structure G built in step 2 of our automated segmentation approach (Section II-B2). While the reported user-driven refinement method modifies the graph node costs, it does not change the topology of the underlying graph structure. The individual processing steps of the algorithm are depicted in Fig. 6 and are described in detail below.
The user inspects the segmentation result and locates a segmentation inaccuracy (Fig. 6(a)).
The user selects either the inner or outer surface for refinement and draws a polygon line and/or specifies a point roughly at the location of the desired surface boundary (Fig. 6(b)). This task is supported by a graphical user interface (GUI).
Utilizing the information provided by the user, the algorithm locally updates costs in the graph structure G.
The maximum-flow is recalculated for the updated graph G. To speed up the computation, recomputing the maximum-flow from scratch is avoided by utilizing the previously calculated residual graph in a similar way as previously described in [19].
The display of the inner and outer surfaces is updated (Fig. 6(c)).
Fig. 6.
Illustration of interactive LOGISMOS-based refinement of an automatically generated IVUS segmentation. This case was previously depicted in Fig. 1. (a) The user inspects the IVUS segmentation produced by our automated approach and discovers a local segmentation inaccuracy of the inner (arrow 1) and outer (arrow 2) surfaces. The outer boundary segmentation got “distracted” by a high density (calcified) region inside of the vessel wall and the associated shadow. (b) The user roughly indicates the correct location of the outer wall by drawing a polygon line (arrow 3, purple line) in proximity to the desired surface location. This single polygon line is used to locally modify the cost function for the outer boundary. (c) Refinement result after recalculating the maximum-flow for the dual-surface graph. Note that outer (arrow 4) and inner boundary (arrow 5) are simultaneously corrected due to the mutually interacting dual-surface graph structure. (d) Corresponding independent standard.
The above described refinement method can be utilized iteratively, if required. The program's GUI allows the user to “undo” a refinement operation, if needed. In the following, we provide more details for step 3 of our algorithm.
As outlined above, the user can guide the segmentation result by drawing polygon lines in cross-sectional images along the vessel or placing single points in arbitrarily (desired) locations of the IVUS volume. Based on this interactively defined information, node costs in local neighborhoods of the entered points or polygonal lines are modified to affect the outcome of the optimal graph-search segmentation. Single points specified by the user are converted by the algorithm to a polygon line consisting of one start and end point that are the same.
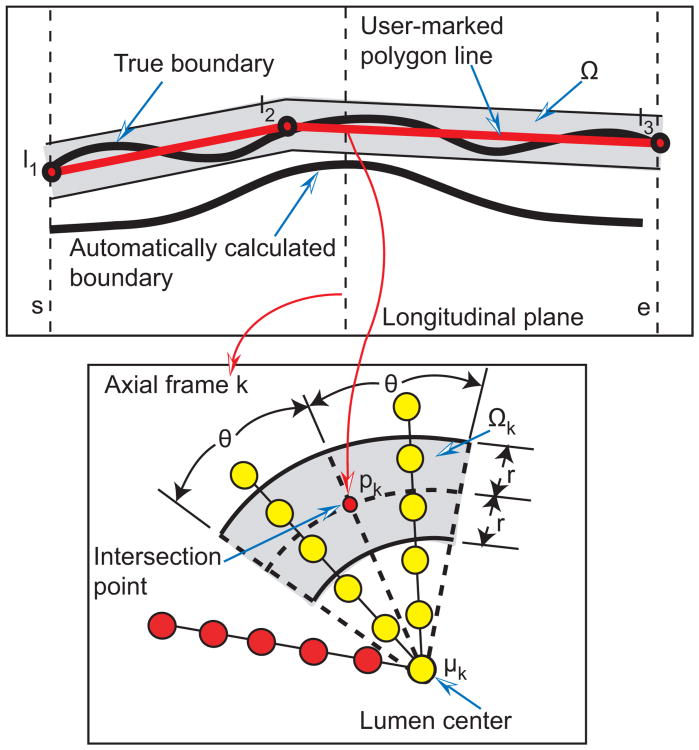
Given a polygon line represented by the point set L = {l1, l2,…, lj} that roughly approximates the correct boundary location (Fig. 7), intersection points pk with k = s, s + 1,…, e are calculated for each image frame, and wedge sector shaped influence regions Ωk are defined (gray region in Fig. 7). For the influence regions, r = 0.182 mm and angle θ = 20° were utilized, for all test data sets (Section III-A). Affected columns are defined as those that intersect the volume Ω defined by combining all influence regions Ω = {Ωs,Ωs+1,… ,Ωe}. Let and denote node costs before and after a refinement iteration, respectively. Nodes on the affected columns for surface Si are updated as follows
Fig. 7.
Influence region definition for segmentation refinement based on a user-specified polygon line. Affected and unaffected nodes are shown in yellow and red, respectively. See text for details.
| (7) |
and the costs of all other (unaffected) columns are left unchanged . The rationale behind having two update functions for affected columns is as follows. First, costs of nodes on affected columns near (inside Ω) the user-specified refinement point or polygon line need to become more “attractive” (cheaper) or at least stay the same. This is accomplished by
| (8) |
where d() denotes the Euclidean distance function. Parameter σr = 0.13 mm adjusts the locality of the cost modification and must be considered in combination with parameter r, defining the width of the circular sector Ω (Fig. 7). Second, costs of nodes on affected columns far away from user-specified point or polygon line (outside Ω) are made less attractive by utilizing an update function
| (9) |
to penalize nodes (locations) that are very unlikely a part of correct surfaces.
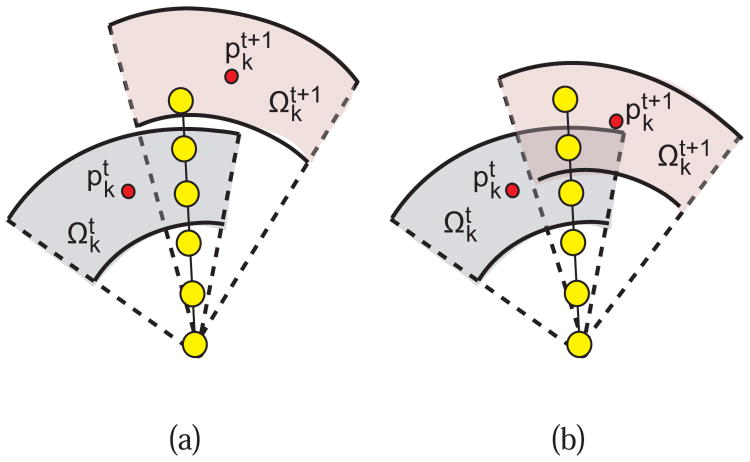
Any single graph column may be impacted by multiple refinement iterations. Thus, the current (t +1) and the previous (t) iteration must be considered. Let and be intersection points in frame k that correspond to impact regions and respectively. For each frame, the following rules are used in conjunction with Eqs. (7), (8), and (9) for updating the costs of a column υ that is affected by and/or :
If there is no overlap between and (Fig. 8(a)) then the impact region and the corresponding intersection point are used in Eqs. (8) and (9).
If and are overlapping (Fig. 8(b)) then both and are employed based on the rules given in Table I.
Fig. 8.
Example of a graph column affected by a previous and current refinement operation. (a) A column is affected by two none-overlapping impact regions. (b) A column is affected by two overlapping impact regions.
Table I.
Rules for Updating the Cost Function During Segmentation Refinement in Dependence of the Location of Node n(υ, j).
|
|
|
||||
|---|---|---|---|---|---|
|
| |||||
|
|
Determine level of influence based on distance from n(υ, j) to and (i.e., the closest intersection point is utilized); replace d(pk, n(υ, j)) with in function UR (Eq. 8) | is the dominant region; replace pk with in function UR (Eq. 8) | |||
|
| |||||
|
|
is the dominant region; replace pk with in function UR (Eq. 8) | Determine level of influence based on distance from n(υ, j) to and (i.e., the closest intersection point is utilized); replace d(pk, n(υ, j)) with in function UB (Eq. 9) | |||
III. Experimental methods
A. Image Data and Experiment Setup
For our study, 41 data sets were available originating from a Volcano IVG3 imaging system with 20 MHz solid-state catheters. Combined with a mechanical pullback device, the Volcano system provides EKG R-wave gated image sequences. Considering the usual heart rate of 60-90 beats per minute, the catheter pullback speed of 0.5 mm/sec with EKG gating provides an IVUS image frame every 0.3–0.5 mm axially, on average. Each image frame is 384 × 384 pixels in size, with in-frame resolution of 0.026 × 0.026 mm. Temporal pullback sequences of 70 to 259 frames were included in our data set with frame-to-frame distances ranging from 0.25 to 0.69 mm. In the 41 pullbacks, the number of bifurcations per data set was 3.3±1.5 with a median of 4, minimum of 0 and maximum of 6.
Automated simultaneous segmentation of the inner and outer surfaces was performed on all 41 test data sets, for a total of 6467 frames. All computations were performed on a Linux workstation with a 2.93 GHz Xeon CPU with program's memory requirements never exceeding 2 GB on the 41 IVUS test data sets. An expert was asked to inspect the segmentation results generated by the fully automated approach and refine the segmentation using the second stage of our approach. For this purpose, the developed user interface allowed the user to look at arbitrary cross-sections in all three dimensions as necessary. Also, the user was allowed to freely choose between points and polygon lines for refinement.
The parameters of the algorithm were the same for all 41 test cases, as specified in Section II. For performance comparison, we have used an earlier-reported automated IVUS segmentation method [14]. Results using [14] approach are labeled as “PA” (previous automated), the results of our new automated approach are labeled as “NA”, and the results of our new refinement approach applied to NA are labeled “NR”.
B. Independent Standard
Manual tracing of the luminal and EEL borders was performed by an expert interventional cardiologist. The independent standard resulted from frame-by-frame editing or retracing borders resulting from [14]. The manual tracing environment allowed to trace surfaces either in individual frames or in one of 6 axially reformatted planes (30 degree increments). The expert observer was allowed to select the individual planes or frames in any sequence and modify the borders until full satisfaction. In the process, all frames of each image sequence were reviewed, and most if not all manually traced and repeatedly edited. In the case of bifurcations, the expert was required to smoothly interpolate the luminal and EEL surfaces. This way of defining an independent standard was very tedious and time consuming, typically requiring 2-3 hours of manual tracing and editing per image sequence. A high-quality independent standard resulted that was used for performance assessment by the methods under comparison.
C. Quantitative Indices
The following quantitative error indices are utilized: mean signed border positioning error (ds), mean unsigned border positioning error (du), root-mean-square (RMS) border positioning error (drms), mean signed area error (As), mean unsigned area error (Au) and RMS area error (Arms). All these quantitative indices were utilized in [14]. In the case of ds and As, a negative value indicates that the segmentation border is inside and a positive value indicates that the border is outside of the expert-defined boundary/surface. To compute quantitative indices, borders on each frame are considered as points in polar coordinates at 360 one-degree angles. Border positioning errors are calculated for each boundary point as a distance between the independent standard point and the point on the segmented boundary. Indices ds, du, drms are calculated per sequence as averaged distances over all boundary points of the 3-D pullback sequence. Similarly, the area errors are calculated for each frame and As, Au and Arms are the averaged results over the entire pullback sequence.
IV. Results
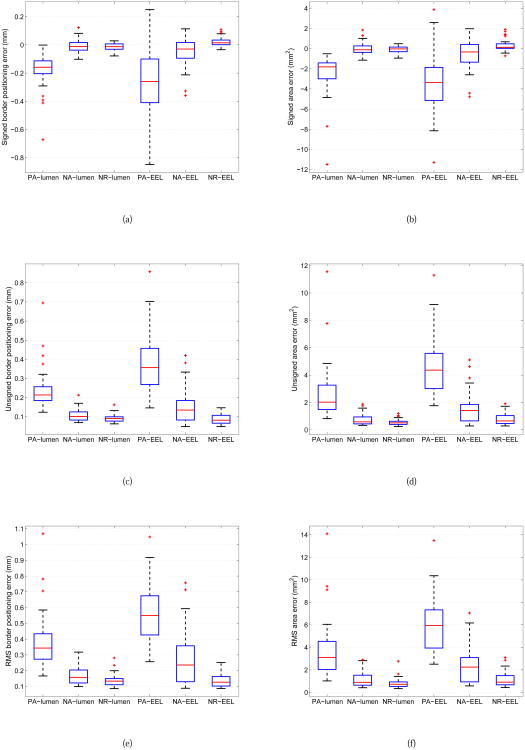
The mean and standard deviation of quantitative indices for lumen and EEL surfaces for PA, NA and NR approaches are summarized in Table II. A comparison between boxplots of all quantitative indices and methods is shown in Fig. 9. In addition, paired Student's t-tests at a significance level of 0.05 were performed to determine whether the average error indices were significantly different when comparing segmentation approaches (Table III).
Table II.
Quantitative Segmentation Performance Indices of Methods PA, NA, and NR for the Luminal and Eel Surfaces on 41 Ivus Data Sets. The mean ± standard deviation are Given for Each Index.
| PA-lumen | NA-lumen | NR-lumen | PA-EEL | NA-EEL | NR-EEL | |
|---|---|---|---|---|---|---|
| ds (mm) | −0.182 ± 0.119 | −0.007 ± 0.044 | −0.013 ± 0.026 | −0.252 ± 0.240 | −0.049 ± 0.107 | 0.024 ± 0.034 |
| du (mm) | 0.238 ± 0.104 | 0.109 ± 0.033 | 0.092 ± 0.020 | 0.384 ± 0.158 | 0.148 ± 0.089 | 0.088 ± 0.025 |
| drms (mm) | 0.378 ± 0.175 | 0.168 ± 0.055 | 0.138 ± 0.038 | 0.563 ± 0.190 | 0.264 ± 0.169 | 0.136 ± 0.043 |
| As (mm2) | −2.452 ± 1.995 | −0.005 ± 0.624 | −0.108 ± 0.340 | −3.489 ± 3.067 | −0.578 ± 1.495 | 0.367 ± 0.601 |
| Au (mm2) | 2.573 ± 1.960 | 0.749 ± 0.406 | 0.551 ± 0.221 | 4.618 ± 2.134 | 1.559 ± 1.118 | 0.793 ± 0.435 |
| Arms (mm2) | 3.624 ± 2.532 | 1.124 ± 0.668 | 0.817 ± 0.437 | 5.919 ± 2.478 | 2.348 ± 1.611 | 1.173 ± 0.650 |
Fig. 9.
Comparison between boxplots of quantitative indices for IVUS segmentation of luminal and EEL surfaces with methods PA, NA, and RA. (a) Signed border positioning error. (b) Signed area error. (c) Unsigned border positioning error. (d) Unsigned area error. (e) RMS of border positioning error. (f) RMS of area error. The boxplots provide a graphical display of five statistical values (from the bottom to the top vertical line): the so-called smallest observation (Q1 − 1.5(Q3 − Q1)), first quartile (Q1), median (Q2), third quartile (Q3), and the so-called largest observation (Q3 + 1.5(Q3 − Q1)); + markers indicate outliers.
Table III.
Student's t-test Statistics Comparing the Tested Segmentation Approaches - p-values Provided.
| Luminal surface | EEL surface | |||||
|---|---|---|---|---|---|---|
| PA vs. NA | NA vs. NR | PA vs. NR | PA vs. NA | NA vs. NR | PA vs. NR | |
| ds (mm) | ≪ 0.001 | 0.25 | ≪ 0.001 | ≪ 0.001 | ≪ 0.001 | ≪ 0.001 |
|
| ||||||
| du (mm) | ≪ 0.001 | ≪ 0.001 | ≪ 0.001 | ≪ 0.001 | ≪ 0.001 | ≪ 0.001 |
|
| ||||||
| drms (mm) | ≪ 0.001 | ≪ 0.001 | ≪ 0.001 | ≪ 0.001 | ≪ 0.001 | ≪ 0.001 |
|
| ||||||
| As (mm2) | ≪ 0.001 | 0.17 | ≪ 0.001 | ≪ 0.001 | ≪ 0.001 | ≪ 0.001 |
|
| ||||||
| Au (mm2) | ≪ 0.001 | < 0.001 | ≪ 0.001 | ≪ 0.001 | ≪ 0.001 | ≪ 0.001 |
|
| ||||||
| Arms (mm2) | ≪ 0.001 | < 0.001 | ≪ 0.001 | ≪ 0.001 | ≪ 0.001 | ≪ 0.001 |
The mean and standard deviation of the computing time needed for automated segmentation (approach NA) per data set was 42.6 ± 13.8 s, and the median was 40.0 s. The computing time ranged between 9.0 and 70.5 s. The portion of time required for obtaining the solution of the maximum-flow calculation in luminal pre-segmentation and dual-surface segmentations steps combined was 5.1±3.3 s (median: 4.2 s).
The mean and standard deviation of user interaction time needed by the expert for inspection and segmentation refinement (approach NR) per case was 5.7 ± 1.8 min. The median user interaction time was 5.8 min, and the required times ranged between 0.9 and 9.3 min for the set of all 41 tested IVUS pullbacks. The measured user interaction time includes locating local segmentation inaccuracies, identifying and marking correct border locations with polygon lines or points, and (iteratively) applying the surface refinement algorithm. The processing time required for computing the refinement results was 86 ± 57 ms (median: 79 ms) per iteration. Overall, the time needed for both stages of our method consisting of the automated segmentation and user-guided refinement was 6.5 ± 1.8 min with a median of 6.6 min. The maximum and minimum were 10.0 and 1.9 min, respectively.
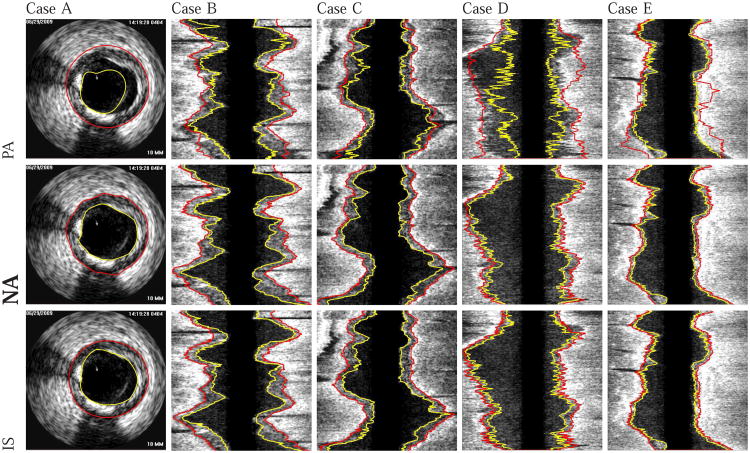
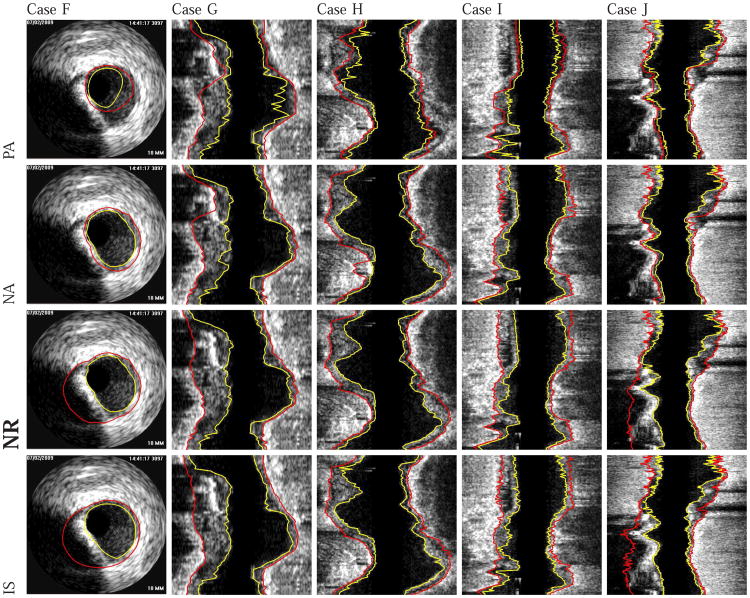
Examples of segmentation results generated with the proposed automated approach (NA) (without refinement) are shown in Fig. 10. Comparisons with the independent standard as well as with surfaces generated using the PA, NA, and NR approaches are depicted in Figs. 11 and 12.
Fig. 10.
Comparison of automatically generated segmentation results on five different data sets (cases A-E). The luminal and EEL surfaces are shown in yellow and red, respectively. (PA) Method reported in [14]. (NA) Our automated segmentation approach. (IS) Independent standard. All segmentations produced with NA were assessed by the user and found to be correct. Consequently, the user did not perform any refinement on cases A to E.
Fig. 11.
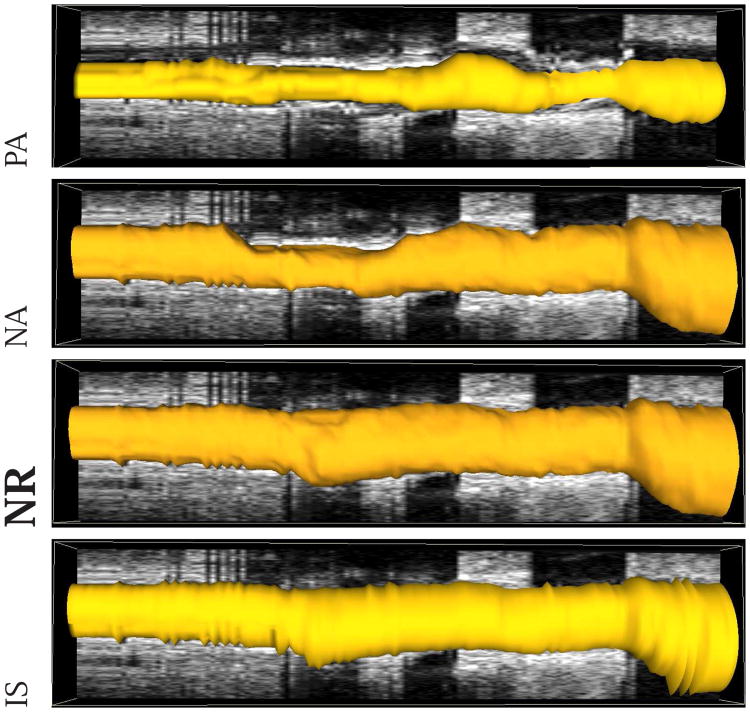
Comparison of segmentation results in mesh-based 3-D representation of the EEL surface. Note that this data set was also shown in Figs. 1 and 6. (PA) Method reported in [14]. (NA) Our automated segmentation approach. (NR) Segmentation refinement result. (IS) Independent standard.
Fig. 12.
Examples of segmentation results on five different data sets (cases F-J). The luminal and EEL surfaces are shown in yellow and red, respectively. (PA) Method reported in [14]. (NA) Our automated segmentation approach. (NR) Segmentation refinement result. (IS) Independent standard.
Out of the 41 gated 20 MHz IVUS data sets utilized for performance assessment in this paper, a subset of ten pullback subsections was provided to the organizers of the IVUS Segmentation Challenge that was part of the 2011 Medical Image Computing and Computer Assisted Intervention (MICCAI) workshop on Computing and Visualization for (Intra) Vascular Imaging (CVII)1. As defined on the IVUS challenge website2, the used quantitative performance indices were Jaccard measure (JM), Hausdorff Distance (HD) and Percentage of Area Difference (PAD). Our results on the complete ten IVUS pullback subsections, based on these indices and the independent standard described in Section III-B, are summarized in Table IV. Currently, the IVUS Segmentation Challenge summary paper is in review. However, the paper is expected to be published in the near future. Once challenge results are available, Table IV can be utilized for comparison. In this context, note that for segmentations submitted to the IVUS challenge, performance indices were calculated only for a validation set, consisting of a small subset of frames that were randomly chosen and for which the organizers created their own reference standard.
Table IV.
Quantitative Segmentation Performance Indices of Methods PA, NA, and NR for the Luminal and EEL Surfaces on Gated 20 mhz IVUS Pullbacks Utilized by the 2011 IVUS Segmentation Challenge (See Section IV for Details). The Mean ± Standard Deviation are Given for Each Index.
| PA-lumen | NA-lumen | NR-lumen | PA-EEL | NA-EEL | NR-EEL | |
|---|---|---|---|---|---|---|
| JM | 0.79 ± 0.11 | 0.91 ± 0.04 | 0.91 ± 0.03 | 0.76 ± 0.20 | 0.92 ± 0.08 | 0.95 ± 0.03 |
| HD (mm) | 0.42 ± 0.24 | 0.27 ± 0.13 | 0.25 ± 0.12 | 0.69 ± 0.53 | 0.30 ± 0.30 | 0.21 ± 0.12 |
| PAD | 0.17 ± 0.14 | 0.05 ± 0.04 | 0.04 ± 0.04 | 0.22 ± 0.21 | 0.05 ± 0.07 | 0.03 ± 0.03 |
V. Discussion
Our new automated IVUS segmentation method (the NA method) outperformed our previous approach (the PA method) as documented by the results shown in Table II and Fig. 9. The obtained improvements are practically relevant and statistically significant across all quantitative indices of border positioning and area errors (Table III).
As can be seen from comparing the performance indices for all tested methods, the segmentation errors of the EEL surface (outer wall) were consistently larger than those of the luminal surface (inner wall) for all investigated segmentation methods (Table II and Fig. 9). This should not be surprising, because segmenting the EEL surface is considerably more difficult than segmenting the lumen. Among others, the blood speckle dynamics, which helps resolve most ambiguities of the luminal segmentation is not relevant for resolving the EEL ambiguities, of which there are many. Out of these, calcified plaque shadows frequently cause most of the EEL segmentation inaccuracies due to a partial or complete lack of the ultrasound signal from the EEL interface. In such situations, the human experts use 3-D context as well as his/her anatomical knowledge and coronary remodeling experience to estimate the course of the EEL surface. Clearly, the automated approach such as the NA has only a limited chance to succeed in the cases of an almost complete lack of usable IVUS data depicting the EEL interface, and any human-based approach inevitably suffers from inter- and even intra-observer variability. Notably, this variability also affects the definition of the independent standard. As such, larger errors should be expected for the EEL surface as they have been observed.
In the context of IVUS surface segmentation, some of the published IVUS segmentation methods like [7]–[10] tried to tackle segmentation problems by utilizing classification approaches or by including automated approaches for detection of calcification, diseased arterial sections, or side branches in their algorithms. However, in the case of local segmentation failure, no efficient refinement methods have been available. With the proposed method, we address this problem. Consequently, the performance reported for such methods might be somewhat lower, compared to our approach. Furthermore, such approaches for classification/detection of diseased arterial sections etc. could also be integrated in our NA method to further reduce the need for segmentation refinement.
Compared to our previous dual-surface approach [14], notable improvements of the performance is attributed to the combination of the improvements to a) the underlying graph structure (both lumen-centering of the constructed graph resulting from the novel pre-segmentation step and incorporation of arc-based soft constraints allowing to model shape priors [16]) and b) the novel terms of the employed cost function dependent on edge as well as regional information from the IVUS images. Because of the lumen-centering, we have utilized 3-times more columns (parameter np) compared to our previous work [14], thus providing sufficient node density for our application. Due to the efficient refinement approach, utilizing more columns does not translate into an increase of user interaction during refinement. Based on our experiments, we found that a common center for lumen and EEL graphs is a sufficiently good approximation.
Our second-stage – the computer-aided approach to segmentation refinement – enables the user to further improve the quality of IVUS segmentations in a very time efficient manner, even in difficult cases. In terms of segmentation performance, the two-stage NR approach in which the refinement follows the automated NA stage, the segmentation improvements were again found statistically significant when compared to the tested automated approaches, both the previous automated PA approach and the new automated NA approach (Table III) – with the signed error indices ds and As computed from the luminal surfaces being an exception and not showing statistically significant improvement of the NR approach compared to the NA method alone. In other words, the NA approach is already providing highly accurate luminal surface as far as signed border positioning and area errors are concerned. Still, as can be seen from the boxplots in Figs. 9(a) and 9(b), the ranges of deviation around the median are smaller for NR compared to NA.
The average user interaction time required for utilizing our NR approach is more than 25-fold lower compared to fully manual editing and tracing that started with the result of the PA method. One reason for this improvement is that the user interactions in the NR approach fully utilize the advantages of the simultaneous dual-surface segmentation approach. Thus, when correcting, e.g., the inner luminal surface, the outer EEL surface is adjusted automatically without a need to indicate the desired locations of the outer surface and vice versa (Fig. 6). Equally important, our refinement approach is inherently three-dimensional. Thus, the resulting surfaces are smoother and less likely to show discontinuities that may be unavoidable when performing slice-by-slice manual segmentation editing. These improvements are practically important since they will contribute to making real-clinical-time IVUS segmentation a reality in the near future.
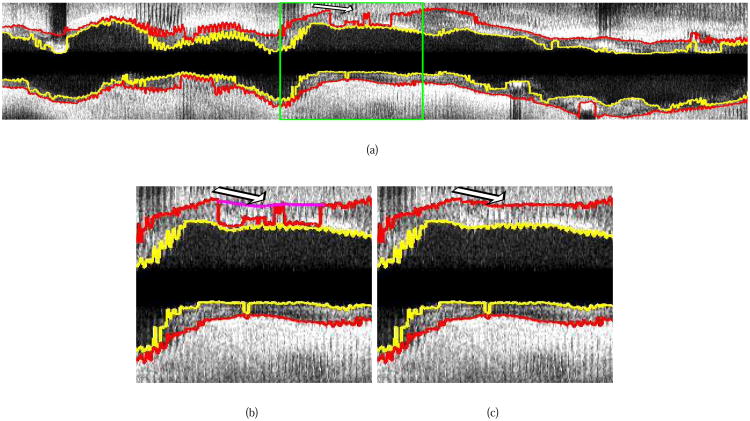
The presented method was specifically designed for gated 20 MHz IVUS data. While IVUS segmentation of gated 20 MHz IVUS pullbacks might be somewhat less challenging, compared to non-gated 20 MHz or 40, 45 and 60 MHz IVUS data, it is still a demanding task. In addition, our approach can be generalized to non-gated 20 MHz or 40, 45 and 60 MHz IVUS pullbacks, if needed. Fig. 13 depicts one example where the proposed segmentation method was applied to a non-gated 20 MHz IVUS sequence with 5379 frames. Note that the algorithm was not modified and none of the parameters were adapted for this application. The automatic segmentation (NA) took 1145 s due to the large size of the IVUS pullback (0.6 GB DICOM file), and the peak memory usage during computation never exceeded 42 GB. While the segmentation produced with our algorithm generally follows the basic shape of lumen and EEL surface reasonably well (Fig. 13), it fails to locally follow the zig-zag pattern due to the cardiac motion cycle in some locations. This is not surprising, because in the case of non-gated 20 MHz pullbacks, the vessel surfaces show more local variation, compared to the gated sequences. Consequently, the surface smoothness constraint between adjacent IVUS images (Fig. 2(c)) would need to be adjusted accordingly.
Fig. 13.
Example of ungated 20 MHz IVUS pullback segmentation with the proposed method. (a) Segmentation result produced by our automated approach (NA). (b and c) Detailed view of the area marked by the green box in (a). (b) The user roughly indicates the correct location of the outer wall by drawing a polygon line (arrow, purple line). (c) Refinement result (method NR).
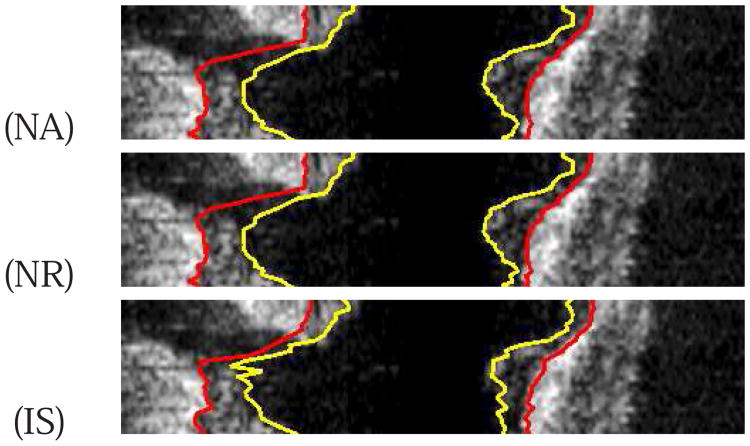
One potential disadvantage of our refinement scheme might be that the shapes of any allowed refinement solutions (resulting surfaces) are limited by the hard shape constraints of the graph structure (e.g., hard smoothness constraints). These constraints cannot be changed easily on the fly without modifying the graph representation and recomputing the graph possibly from scratch. A solution for this limitation may be to perform an additional step of highly localized purely manual editing after completing the NR if/as needed. This would allow to deal with flaps and dissections. Also, in our current implementation, we assume that the vessel is formed by a single tube. Clearly, bifurcations violate this assumption. Typically, our approach interpolates the vessel surfaces at locations where vessels branch off, as depicted in Fig. 14. To more correctly model bifurcations, additional processing steps subsequent to our segmentation methods will be required. Such post-processing may consist of bifurcation identification and 3-D modeling of branches, as outlined in [20], [21].
Fig. 14.
Example of the behavior of our approach at vessel bifurcations. (NA) Our automated approach. (NR) Result after refinement. Note that the user did not perform any refinement in the region of the bifurcation. (IS) Independent standard (Section III-B).
Fig. 15 depicts a segmentation example of an IVUS pullback with a stent. Note that for the result depicted in image in Fig. 15(a), no editing was performed.
Fig. 15.
Segmentation of an IVUS pullback with a stent. (a) Result of our automated method (NA). (b) Manually generated independent reference standard.
Despite the demonstrated performance improvements in the 41 tested 3-D data sets, the study design is not free of several limitations, one of which was the way how the independent standard was originally defined. As stated earlier, the PA method served for initial IVUS pullback segmentation and the resulting surfaces were used as a start of a manual editing process that yielded the independent standard as described in Section III-B. As such, the independent standard is not fully independent from the PA method although the manual tracing and editing required about 100 hours of expert editing resulting in substantial changes of the surface definitions (compare panels PA and IS in Figs. 10, 11, and 12). Arguing that the resulting independent standard is quite distant from the original PA segmentation would be well justified. More important and ultimately relevant to the presented study, there is no such real or perceived dependence between the NA or NR surfaces and the independent standard since the NA approach is based on a different graph construction, different interaction priors, and different cost functions. Consequently, even if there are some remaining dependencies between the independent standard and the PA segmentations, these would solely favor performance assessment of the PA method, which – however – fared worst among the three compared approaches. Clearly, any benefit that the definition of the independent standard may have provided to the PA method did not affect the ultimate assessment of the PA method as being significantly worse than the two other compared approaches. Therefore, this limitation of the study design can be regarded as insignificant with respect to the overall outcome of the reported work. This conclusion is also supported by an experiment where a second expert (Expert 2) traced ten randomly selected cross-sections of ten IVUS pullbacks from the 41 data sets described in Section III-A. Utilizing this second expert opinion, the performance of PA and NR methods was assessed by means of the RMS border positioning error (drms) and RMS area error (Arms). The results for the selected 100 IVUS frames are summarized in Fig. 16. The same trend as depicted by the corresponding boxplots in Figs. 9(e) and 9(f) can be observed. For all performance indices based on Expert 2 tracings and for luminal as well as EEL surfaces, the proposed NR approach significantly outperformed the PA method (p-values < 0.02). Fig. 17 shows a comparison between expert opinions as well as PA and NR segmentation results.
Fig. 16.
Boxplots of performance indices for luminal and EEL surfaces generated with methods PA and RA based on Expert 2 tracings of 100 randomly selected IVUS frames. (a) RMS border positioning error and (b) RMS area error.
Fig. 17.
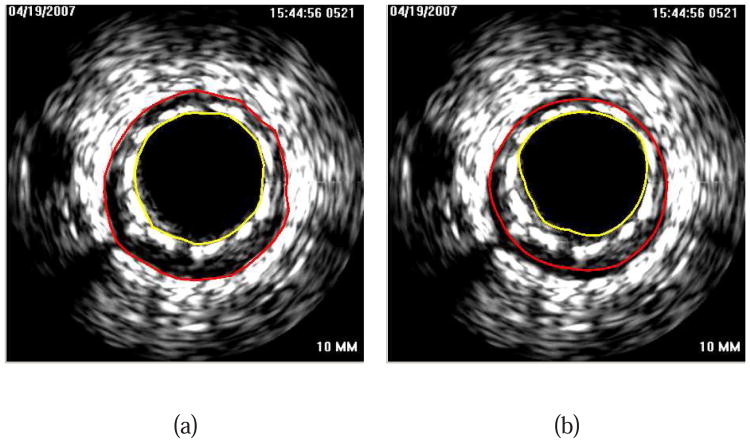
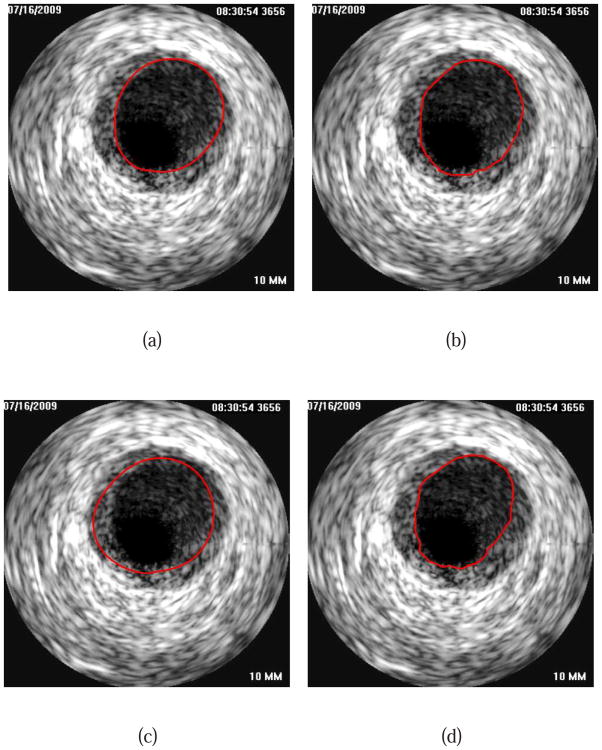
Comparison of expert tracing and computer-method performance for luminal surface. (a) Expert 1. (b) Expert 2. Segmentation results of (c) method PA and (d) method NR.
VI. Conclusion
Segmentation of lumen and EEL surfaces in IVUS volumes is a difficult task. In this paper we proposed a combination of automated segmentation and computer-aided refinement to facilitate this process. Our new automated segmentation method (NA) delivered significantly better results compared to the work reported by us previously in [14]. The presented approach to segmentation refinement (NR) was found to be efficient, effective, and allowed the user to produce high quality segmentation results in cases of clinical quality images with a barrage of typical imaging artifacts. Overall, the average time required for producing IVUS segmentations suitable for further quantitative analysis was reduced from several hours to 6.5 min on average while demonstrating excellent segmentation accuracy. As such, our approach enables close-to-real-time IVUS segmentation, which is an important factor for enabling quantitative analysis of IVUS image data in routine clinical setting.
Acknowledgments
This work was supported in part by NIH grants R01– EB004640, R01–HL063373, and R01–HL111453. The contribution of Tomas Kovarnik, M.D. whose manual tracing of IVUS image data formed the independent standard is gratefully acknowledged.
Footnotes
Contributor Information
Shanhui Sun, Email: shanhui-sun@uiowa.edu, Department of Electrical and Computer Engineering and the Iowa Institute for Biomedical Imaging, The University of Iowa, Iowa City, IA 52242, USA.
Milan Sonka, Email: milan-sonka@uiowa.edu, Department of Electrical and Computer Engineering and the Iowa Institute for Biomedical Imaging, The University of Iowa, Iowa City, IA 52242, USA.
Reinhard R. Beichel, Email: reinhard-beichel@uiowa.edu, Department of Internal Medicine, the Department of Electrical & Computer Engineering, and the Iowa Institute for Biomedical Imaging, The University of Iowa, Iowa City, IA 52242, USA (Tel: +1 319 335 4597. Fax: +1 319 335 6028.
References
- 1.Wahle A, Lopez JJ, Olszewski ME, Vigmostad SC, Chandran KB, Rossen JD, Sonka M. Plaque development, vessel curvature, and wall shear stress in coronary arteries assessed by x-ray angiography and intravascular ultrasound. Medical Image Analysis. 2006;10(4):615–631. doi: 10.1016/j.media.2006.03.002. [DOI] [PMC free article] [PubMed] [Google Scholar]
- 2.Sonka M, Zhang X, Siebes M, Bissing MS, DeJong SC, Collins SM, McKay CR. Segmentation of intravascular ultrasound images: A knowledge-based approach. IEEE Transactions on Medical Imaging. 1995;14:719–732. doi: 10.1109/42.476113. [DOI] [PubMed] [Google Scholar]
- 3.Zhang X, McKay CR, Sonka M. Image segmentation and tissue characterization in intravascular ultrasound. IEEE Transactions on Medical Imaging. 1998;17:889–899. doi: 10.1109/42.746622. [DOI] [PubMed] [Google Scholar]
- 4.Dijkstra J, Koning G, Reiber JHC. Quantitative measurements in ivus images. Int J of Cardiac Imaging. 1999;15:513–522. doi: 10.1023/a:1006334517720. [DOI] [PubMed] [Google Scholar]
- 5.Klingensmith J, Shekhar R, Vince D. Evaluation of three-dimensional segmentation algorithms for the identification of luminal and medial-adventitial borders in intravascular ultrasound images. Medical Imaging, IEEE Transactions on. 2000;19:996–1011. doi: 10.1109/42.887615. [DOI] [PubMed] [Google Scholar]
- 6.Klingensmith J, Nair A, Kuban B, Vince D. Segmentation of three-dimensional intravascular ultrasound images using spectral analysis and a dual active surface model. Ultrasonics Symposium, 2004 IEEE. 2004;3:1765–1768. [Google Scholar]
- 7.Cardinal MHR, Meunier J, Soulez G, Maurice RL, Therasse E, Cloutier G. Intravascular ultrasound image segmentation: a three-dimensional fast-marching method based on gray level distributions. IEEE Transactions on Medical Imaging. 2006;25(5):590–601. doi: 10.1109/TMI.2006.872142. [DOI] [PubMed] [Google Scholar]
- 8.Cardinal MHR, Soulez G, Tardif J, Meunier J, Cloutier G. Fast-marching segmentation of three-dimensional intravascular ultrasound images: A pre- and post-intervention study. Med Phys. 2010;37:3633–3647. doi: 10.1118/1.3438476. [DOI] [PubMed] [Google Scholar]
- 9.Unal G, Bucher S, Carlier S, Slabaugh G, Fang T, Tanaka K. Shape-driven segmentation of the arterial wall in intravascular ultrasound images. IEEE Trans Inf Technol Biomed. 2008;12:335–347. doi: 10.1109/titb.2008.920620. [DOI] [PubMed] [Google Scholar]
- 10.Mendizabal-Ruiz E, Biros G, Kakadiaris I. An inverse scattering algorithm for the segmentation of the luminal border on intravascular ultrasound data. Med Image Comput Comput Assist Interv. 2009;12:885–892. doi: 10.1007/978-3-642-04271-3_107. [DOI] [PubMed] [Google Scholar]
- 11.Koning G, Dijkstra J, Birgelen C, Tuinenburg J, Brunette J, Tardiff J, Oemrawsingh P, Sieling C, Melsa S, Reiber JHC. Advanced contour detection for three-dimensional intracoronary ultrasound: A validation – in-vitro and in-vivo. Int J of Cardiac Imaging. 2002:235–248. doi: 10.1023/a:1015551920382. [DOI] [PubMed] [Google Scholar]
- 12.Li K, Wu X, Chen D, Sonka M. Optimal surface segmentation in volumetric images - a graph-theoretic approach. IEEE Transactions on Pattern Analysis and Machine Intelligence. 2006;28(1):119–134. doi: 10.1109/TPAMI.2006.19. [DOI] [PMC free article] [PubMed] [Google Scholar]
- 13.Yin Y, Zhang X, Williams R, Wu X, Anderson D, Sonka M. LOGISMOS–layered optimal graph image segmentation of multiple objects and surfaces: cartilage segmentation in the knee joint. IEEE Trans Med Imaging. 2010;29:2023–2037. doi: 10.1109/TMI.2010.2058861. [DOI] [PMC free article] [PubMed] [Google Scholar]
- 14.Downe RW, Wahle A, Kovárník T, Skalická H, Lopez JJ, Horák J, Sonka M. Segmentation of intravascular ultrasound images using graph search and a novel cost function. 2nd MICCAI Workshop on Computer Vision for Intravascular and Intracardiac Imaging; 2008. [Google Scholar]
- 15.Boykov Y, Kolmogorov V. An experimental comparison of min-cut/max-flow algorithms for energy minimization in vision. IEEE Transactions on Pattern Analysis and Machine Intelligence. 2004;26(9):1124–1137. doi: 10.1109/TPAMI.2004.60. [DOI] [PubMed] [Google Scholar]
- 16.Song Q, Wu X, Liu Y, Smith M, Bautti J, Sonka M. Proc of Medical Image Computing and Computer Assisted Intervention (MICCAI) Vol. 5762. LNCS; 2009. Optimal graph search segmentation using arc-weighted graph for simultaneous surface detection of bladder and prostate; pp. 827–835. [DOI] [PubMed] [Google Scholar]
- 17.Yin W, Goldfarb D, Osher S. The total variation regularized L1 model for multiscale decomposition. Multiscale Modeling and Simulation. 2007;6(1):190–211. [Google Scholar]
- 18.Wagner RF, Smith S, Sandrik JM, Lopez H. Statistics of speckle in ultrasound B-scans. IEEE Transactions on Sonics and Ultrasonics. 1983;30(3):156–163. [Google Scholar]
- 19.Boykov Y, Jolly MP. Proc of International Conference on Computer Vision. Vol. 1. IEEE; 2001. Interactive graph cuts for optimal boundary & region segmentation of objects in N-D images; pp. 105–112. [Google Scholar]
- 20.Downe RW, Wahle A, Garvin J, Kovárník T, Horák J, Lopez JJ, Sonka M. Identification and 3-D modeling of coronary branches in intravascular ultrasound. In: Ünal G, Kakadiaris IA, Navab N, Sonka M, editors. The 3rd International Workshop on Computer Vision for Intravascular and Intracardiac Imaging (MICCAI 2011) Istanbul: Sabanci University; 2011. [Google Scholar]
- 21.Liu X, Chen D, Tawhai M, Wu X, Hoffman E, Sonka M. Optimal graph search based segmentation of airway tree double surfaces across bifurcations. Medical Imaging, IEEE Transactions on. 2013 doi: 10.1109/TMI.2012.2223760. [DOI] [PMC free article] [PubMed] [Google Scholar]


