

Abstract
The hippocampus is often treated as a uniform structure, but possesses differential projections to surrounding cortex along its longitudinal axis. This heterogeneity could create varied susceptibility to pathological influences, potentially leading to non-uniform volumetric associations with advancing age and Alzheimer’s disease (AD). Previous examinations of aging and AD effects on hippocampal subdivisions have produced highly discrepant findings. To clarify these inconsistencies, we examined the hippocampal head, body, and tail in a large sample of 292 cognitively normal, 37 very mildly demented, and 18 mildly demented individuals, divided into two independent samples. As often done in the literature, we characterized qualitative patterns across these regions, but extended these results by explicitly testing for quantitative differences. In each sample of cognitively normal individuals, the head and body demonstrated greater age effects than the tail. In each sample contrasting AD and cognitively normal individuals, all three regions showed significant volume reductions, with the greatest effect on the head. When examining increasing severity of dementia, the hippocampal head showed progressive volume loss, while the body and tail did not. The patterns of results examining both aging and AD were relatively consistent across the independent samples. These results indicate that there is an anterior-to-posterior gradient of loss within the hippocampus with both advancing age and AD.
Keywords: Brain aging, dorsal hippocampus, long-axis, ventral hippocampus
INTRODUCTION
The hippocampus is highly studied in examinations of healthy aging and Alzheimer’s disease (AD). Total hippocampal volume declines across the adult lifespan [1, 2], and this pattern accelerates with advancing age [1–5]. Similarly, total hippocampal volume is reduced in cross-sectional examinations of AD [6–10], and progressively declines with increasing cognitive impairment [11]. Total hippocampal volume is a sensitive predictor for future impairment [12–16], and for the progression from mild to more severe stages of AD [17–19].
The hippocampus is not a uniform structure, but has subdivisions differentially connected with surrounding cortices. Visual, auditory, and somatosensory association cortices are preferentially connected with the dorsal (posterior in humans) hippocampus [20, 21], while the ventral (anterior in humans) hippocampus has preferential indirect and direct connections with the amygdala, rostral hypothalamus, and subcortical nuclei involved in neuroendocrine and autonomic regulation [20–22]. Lesion studies have further elucidated the potential functional roles of these anatomical divisions of the hippocampus. Double dissociations are found in rodent work such that lesions to the dorsal hippocampus differentially impair spatial learning [23, 24], but spare fear conditioning and anxiety-related behaviors, whereas lesions to the ventral hippocampus have the opposite pattern of effects [22, 23, 25–27]. These structural and functional differences are mirrored at the molecular level, where gene expression significantly varies across the hippocampus [20, 28, 29]. The combination of these structural, functional, and molecular differences is thought to create unique vulnerabilities to pathological influences across the extent of the hippocampus (see [30]).
Subdivisions along the longitudinal axis of the hippocampus have been examined to determine if detrimental influences affect hippocampal volume uniformly or in a graded manner. For aging, the results have been inconsistent, with several researchers finding the greatest age-related associations with anterior regions [10, 31, 32], or effects in both anterior and posterior regions [33]. Other researchers have found greater posterior atrophy [34–37], or no significant differences along the longitudinal axis [38]. Similarly for AD, there is some evidence of greater volumetric differences between healthy controls and AD individuals in anterior portions of the hippocampus [10, 36, 39], but this is not always observed [40, 41].
These disparate findings may be driven by a number of factors. Many of the studies of both aging and dementia have been conducted on relatively small samples of the population, which limits their power as well as the reliability of the findings. The current literature is further complicated by the utilization of various methodologies to assess subregions along the longitudinal axis, including manual tracing [10, 31, 39–41] and voxel-based morphometry (VBM) [33–35]. Many of the studies using a form of manual volumetry only report numeric differences in percent change, beta weights, or correlation values [10, 31, 39, 40], but do not test statistical differences between subdivisions. Similarly, VBM analyses indicate where an effect is located, but provide no quantitative comparisons of differential strengths of associations across the hippocampus, and may exaggerate age-related volumetric differences compared to manual tracing [42]. Thus, much of the existing literature provides only qualitative or descriptive information rather than quantitative results on aging and AD effects along the longitudinal axis. These methodological issues limit the validity and utility of prior claims in the literature about selective or differential effects of aging or AD within the hippocampus.
Using high-resolution magnetic resonance imaging (MRI) scans, we investigate the effects of aging and AD in a well-characterized sample of middle-aged and older adults. The size of the total sample provided the opportunity to utilize two independent samples matched for demographic characteristics. The use of these two samples makes it possible to assess the consistency of any observed age and AD effects to a degree that is impossible utilizing previous work. In addition, each independent sample in the current investigation consists of a larger sample than the total sample in all but one study in the existing literature examining aging [37] and two of the four studies on AD [40, 41]. Further, we specifically test the relative strength of associations across the three subdivisions. In this way, observed numeric differences are explicitly tested to move beyond purely qualitative interpretations.
METHODS
Participants
Structural data were obtained from participants recruited from the Knight Alzheimer’s Disease Research Center (ADRC) at Washington University. A subsample (n = 155) of the cognitively normal middle-aged and older adults were recruited as part of an ongoing study at the ADRC on adult children whose parents were or were not diagnosed with AD [43]. A potential pool of 465 participants was screened for health conditions as well as for the quality of the MRI segmentations (see MRI analysis section below for details). Individuals were screened for major medical conditions (i.e., Parkinson’s disease, Huntington’s disease, seizures, major head injury, heart attack, stroke, transient ischemic attack), and non-AD dementia (i.e., frontotemporal dementia, Lewy body dementia, or family history of early onset dementia). Clinical diagnoses were made in accordance with standard criteria [44–46]. Based on the Clinical Dementia Rating scale (CDR) [45, 46], participants were classified as cognitively normal (CDR = 0), very mildly demented (CDR = 0.5), or mildly demented (CDR = 1). The final sample consisted of 347 individuals aged 45 to 95 (CDR 0 = 292, CDR 0.5 = 37, CDR 1 = 18).
Cognitively normal participants were randomized into one of two samples matched on gender and age. A similar procedure was done for the AD group, but additionally matching for dementia severity so that an equal number of CDR = 0.5 and CDR = 1 participants were assigned to each AD sample (see Table 1 for characterizations of each sample). When examining the effects of AD, one cognitively normal sample and AD sample were paired together.
Table 1.
Means and standard deviations for sample characteristics
| CN Sample 1 | CN Sample 2 | AD Sample 1 | AD Sample 2 | |
|---|---|---|---|---|
| Subjects (n) | 146 | 146 | 27 | 28 |
| Age | 68.7 (9.9) | 68.7 (9.7) | 76.1 (10.9) | 75.8 (7.3) |
| Gender (f/m) | 102/34 | 102/34 | 14/13 | 16/12 |
| Education | 16.1 (2.7) | 15.7 (2.6) | 14.6 (2.4) | 14.6 (3.3) |
| GDS | 1.1 (1.5) | 1.2 (1.6) | 2.2 (2.0) | 3.0 (3.1) |
| Lag | 3.6 (8.2) | 2.8 (7.1) | 1.3 (4.4) | 1.3 (3.3) |
| ApoE ε4 status | 35% | 34% | 56% | 57% |
| Head | 4095.4 (677.1) | 3848.9 (751.2) | 3040.8 (665.7) | 2965.1 (718.0) |
| Body | 2369.4 (423.3) | 2316.8 (442.7) | 1890.0 (338.6) | 1999.0 (353.9) |
| Tail | 1383.4 (279.9) | 1334.5 (283.2) | 1098.4 (227.4) | 1177.7 (229.3) |
CN, Cognitively Normal; AD, Alzheimer’s disease, f, female; m, male; GDS, Geriatric Depression Scale; Lag, interval (months) between MRI and clinical assessment, ApoE ε4 status, percent of the sample with at least one ε4 allele. Volumetric measures for the head, body, and tail are mm3.
Cognitively Normal Samples 1 and 2 did not significantly differ on demographic characteristics based on χ2 statistics or t-tests. AD Samples 1 and 2 did not significantly differ on demographic characteristics. When comparing Cognitively Normal and AD Samples 1, the AD individuals had significantly higher Geriatric Depression Scale (GDS) scores (t1,171 = −3.14, p < 0.005), had fewer years of education (t1,171 = 1.41, p < 0.01), were older (t1,171 = −3.63, p < 0.001), had a greater frequency of the apolipoprotein E (ApoE) ε4 allele (χ2 = 4.11 p < 0.05), and had a greater incidence of heart problems (χ2 = 8.25, p < 0.005). A similar pattern was seen in the comparison of Cognitively Normal and AD Samples 2 such that AD individuals were significantly higher on GDS scores (t1,172 = −4.59, p < 0.001), older (t1,172 = −3.67 p < 0.001), and had a greater frequency of the ApoE ε4 allele (χ2 = 5.23, p < 0.05).
APOE genotyping
TaqMan assays (Applied Biosystems, Foster City, USA) for both rs429358 (ABI#C 3084793 20) and rs7412 (ABI#C 904973 10) were used for APOE genotyping. Allele calling was performed using the allelic discrimination analysis module of ABI Sequence Detection Software. Positive controls for each of six possible APOE genotypes were included on the genotyping plate.
MRI imaging protocol
Up to two T1-weighted MPRAGE scans (TR = 2400 ms, TE = 3.16 ms, flip angle = 8°, TI = 1000 ms, 1 mm × 1 mm × 1 mm resolution, 256 mm FOV) were acquired in the sagittal direction on a Siemens 3T Trio scanner. Multiple scans for an individual were aligned using a rigid body transform and averaged together. There were on average 2.9 (SD = 7.2) months between scan acquisition and clinical assessment.
MRI analysis
Delineation of the total hippocampus
Automatic anatomic parcellations of the T1 images were obtained using the Freesurfer 5.1 [47] (http://surfer.nmr.mgh.harvard.edu/) image analysis suite. Each voxel in an MR image is assigned a neuroanatomical label based on probabilistic information from a manually labeled training set. This procedure is highly robust and generates anatomical labeling and regional volume estimates with a high correspondence to manually generated labels [48, 49], and its delineation of the hippocampus has been validated in normal aging, mild cognitive impairment, and AD [50]. Furthermore, the application of an automated procedure to outline the hippocampus facilitates expanding analyses to a much larger sample than previously examined. MRI data were examined to exclude individuals with improper hippocampal segmentations. From the initial sample of 465 individuals, two participants were excluded due to errors in the segmentation process. The structural scans were checked for gross anatomical issues (e.g., enlarged ventricles), and radiological reads were consulted to eliminate individuals with signs of pathology. One additional individual was excluded due to an abnormally large ventricle attributed to a congenital defect.
Delineation of subdivisions along the longitudinal axis
First, images were placed into Talairach stereotaxic space for manual division along the longitudinal axis using an atlas containing both younger and older adults. This was done to assure that all of the hippocampi were aligned to the same orientation before division. Second, boundary slices between hippocampal subdivisions were identified. The protocol for selecting boundary slices was based on Malykhin and colleagues [36]. This protocol is based on anatomical boundaries that are consistent with the differential patterns of connectivity across the longitudinal axis [36]. Moving anterior to posterior, while viewing coronal images, the boundary between hippocampal head and body was determined as the last slice on which the uncus was visible. The boundary between body and tail was determined as the first slice that the fornix was clearly separated from the pulvinar (see Fig. 1). The boundaries were manually determined by one of two raters, and the y-coordinate of this slice was recorded. Boundary slices were determined independently for each hemisphere. A locally generated algorithm used this boundary information to parse the Freesurfer-delineated hippocampus into regions representing the head, body, and tail by automatically assigning a unique categorical value to voxels in each region (e.g., voxels anterior to the boundary slice for the head were designated “10,” those from the first to second boundary as “20,” and those posterior to the boundary separating the body and the tail a “30”). This hippocampal mask was placed back into native space providing subdivision labeling. As the voxels were 1 mm isotropic, summing the number of voxels with each label provided volumetric estimates for that hippocampal subdivision. Volumes were adjusted for total intracranial volume using a covariance approach [51] and summed across hemispheres, as there were no a priori hypotheses regarding laterality.
Fig. 1.
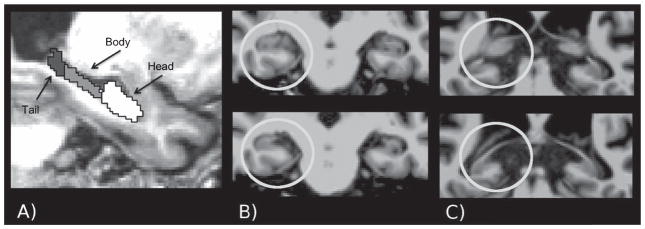
Example illustration of the subdivisions of the hippocampus: A) segmented hippocampus; B) top panel: the last slice with the uncus present, bottom panel: the first slice with the uncus absent; C) top panel: illustrates the fornix still immersed in the pulvinar, bottom panel: the fornix clearly separated from the pulvinar.
Inter-rater reliability
The anatomical boundaries were manually determined by one of two raters, blind to any information about the individual. Both raters segmented ten randomly selected brains to compute inter-rater reliability using intraclass correlations (ICC) [2] [52]. Reliability was above 0.90 for all subdivisions.
Analytic approach
Covariates
Health variables (mild heart problems, hypertension, diabetes, brief head trauma) were coded for absence (0) or history (1). Depressive symptomatology was measured using the GDS [53]. Depression information was not available for one AD and two cognitively normal participants. Their values were imputed with the mean score for their respective group.
Using the entire sample, demographic and health variables with a significant bivariate correlation with any of the volumes were considered as covariates. Gender, years of education, delay between MRI and clinical assessment, history of heart problems, history of hypertension, and GDS scores were covariates for all analyses. When examining AD effects, age and age-squared were also treated as covariates.
The cognitively normal older adult sample draws partially upon a population of individuals with a parental history of AD [43]. ApoE ε4 allele genotype information was available to code participants for the absence (0) or presence (1) of the ApoE ε4 allele to represent this genetic risk within our cognitively normal individuals. Using the entire cognitively normal sample, hierarchical regressions were used to examine the main effect of ApoE genotype as well as the ApoE genotype by age interaction after modeling the effects of all covariates as well as age and age squared. These analyses were conducted to alleviate any concerns that our sample of cognitively normal older adults contained effects that could be due to individuals particularly at-risk for developing AD. There were no main effects of ApoE genotype on the head (F1,282 = 0.04, p = 0.83), body (F1,282 = 0.10, p = 0.83), or tail (F1,282 = 0.62, p = 0.43), nor a genotype by age interaction for the head (F1,281 = 0.32, p = 0.58), body (F1,281 = 0.08, p = 0.78), or tail (F1,282 = 0.10, p = 0.75). As these effects were all nonsignificant, the influence of ApoE was not considered further.
Statistical analyses
To quantify the strength of relationships across the three hippocampal subdivisions, partial correlations were calculated between the factors of interest (i.e., age or AD status) and each region controlling for all covariates. The differential strengths of these relationships were compared using a test of correlated correlations [54, 55] that uses a standard normal z-distribution to assess statistical significance. This test compares the strength of the correlations while taking into account shared variance. This provided a quantitative test that is impossible to gather simply by presenting beta weights, percent change, or correlation values [10, 31, 39]. Additionally, it is not influenced by disparities in volume between the three hippocampal subdivisions.
Sets of hierarchical regressions were fit for each hippocampal subdivision to specifically assess the consistency of age and AD effects across samples. For the hierarchical model examining age, all covariates were entered in the first step, age was entered in the second step, age-squared in the third, a main effect of sample entered in the fourth step, and a sample by age interaction term was entered into the fifth step. Similarly the entire sample was used to compare AD effects across the two samples. In the hierarchical model examining AD effects, all covariates, including age and age-squared, were entered in the first step, AD status was entered in the second step, the main effect of sample was entered into the third step, and an interaction term between sample and AD status entered in the fourth step of the regression. These models served to measure the consistency of the observed aging and AD effects across the two samples.
RESULTS
Age effects
Relationships between age and hippocampal volumes controlling for all covariates are illustrated in Fig. 2. This relationship without controlling for covariates is presented in Supplementary Figure 1 and zero-order correlations are in Supplementary Table 1. In Cognitively Normal Sample 1, age was significantly negatively correlated with the head (rpartial = −0.442, p < 0.001), body (rpartial = −0.447, p < 0.001), and tail (rpartial = −0.273, p < 0.01). The effect of age did not differ significantly between the head and body (Z = 0.06, p = 0.48). However, both the head and body evidenced greater effects of age than the tail (Z = −1.89 and Z = −1.86, ps < 0.05, respectively). There was a significant non-linear effect of age in the body (rpartial = −0.204, p < 0.05), but not the head (rpartial = −0.073, p = 0.39), or the tail (rpartial = 0.063, p = 0.36). When comparing the non-linear effects of age across the three subdivisions, the strength of the correlations did not differ between the head and body (Z = 1.30, p = 0.10) nor the body and tail (Z = −1.34, p = 0.09), but did between the body and the tail (Z = 2.60, p < 0.05).
Fig. 2.
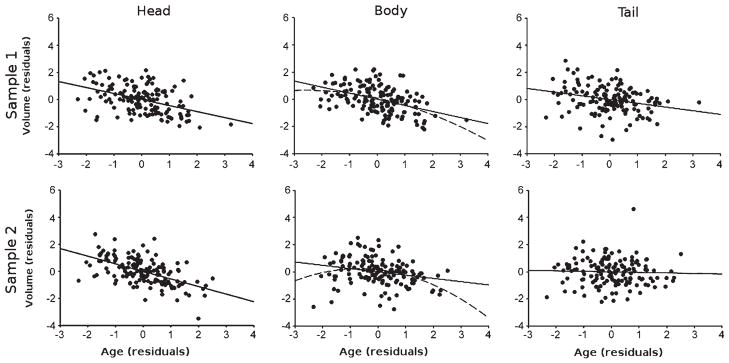
Age effects on hippocampal volumes. Top row: Cognitively Normal Sample 1; Bottom row: Cognitively Normal Sample 2. Values represent residuals controlling for covariates (see text for details). The solid line represents the linear effect while the dashed lined is the quadratic effect.
In Cognitively Normal Sample 2, age was significantly negatively correlated with volume in the head (rpartial = −0.561, p < 0.001) and body (rpartial = −0.241, p < 0.005), but not the tail (rpartial = −0.039, p = 0.65). The age effect was greater for the head than the body (Z = −4.11, p < 0.001) or the tail (Z = −6.21, p < 0.001), and greater for the body than the tail (Z = −2.14, p < 0.05). There was a significant non-linear effect of age in the body (rpartial = −0.186, p < 0.05) with neither the head (rpartial = −0.086 p = 0.31) nor the tail (rpartial = −0.019, p = 0.83) showing a significant non-linear association. When comparing the nonlinear effects of age across the three subdivisions, the correlations did not significantly differ between the head and body (Z = 1.08, p = 0.14), nor the head and the tail (Z = −0.70, p = 0.24), but the non-linear effect of age was greater for the body than the tail (Z = −1.76, p < 0.05).
In the analysis specifically examining the effects of sample (see Supplementary Table 2 for full results), there was a main effect of sample on the hippocampal head (F1,282 = 13.73, p < 0.001) with a larger volume in Cognitively Normal Sample 1. There were no main effects of sample on the body (F1,282 = 1.19, p = 0.28) or tail (F1,282 = 2.17, p = 0.14). There was a significant sample by age interaction in the body (F1,281 = 4.48, p < 0.05) with Cognitively Normal Sample 1 demonstrating a larger age effect. There were no significant interactions for the head (F1,281 = 1.51 p = 0.22) or tail (F1,281 = 2.03, p = 0.16).
AD effects
Associations between hippocampal volumes and AD were first examined in two independent samples collapsed across dementia severity (CDR = 0.5 and 1). Unadjusted means and standard deviations for hippocampal volumes for the four samples are presented in Table 1, and estimated marginal means controlling for all covariates are depicted in Fig. 3. In AD Sample 1, AD status was negatively associated with volume for the head (rpartial = −0.466, p < 0.001), body (rpartial = −0.304, p < 0.001), and tail (rpartial = −0.267, p < 0.001). AD effects were stronger for the head compared to the body (Z = −1.95, p < 0.05) and tail (Z = −2.59, p < 0.01), but the effects did not differ between the body and the tail (Z = −0.40, p = 0.34).
Fig. 3.

AD effects on hippocampal volumes. Left) Sample 1; Middle) Sample 2; and Right) Full Sample. Bars represents estimated marginal means (controlling for covariates; see text for details) and error bars are standard error of the mean.
In the second sample, AD was significantly negatively associated with volume for the head (rpartial = −0.286, p < 0.001) and the body (rpartial = −0.176, p < 0.05), but not the tail (rpartial = −0.107, p = 0.17). The AD effect was stronger for the head compared to the tail (Z = −2.13, p < 0.05), but did not differ between the head and body (Z = −1.32, p = 0.10) nor between the body and the tail (Z = −0.79, p = 0.21).
In the analysis specifically examining the effects of sample (see Supplementary Table 3 for full results), there was a main effect of sample on the hippocampal head (F1,336 = 10.78, p < 0.001) with Sample 1 having a slightly larger head, but no main effects in the body (F1,336 = 0.28, p = 0.60) or tail (F1,336 = 0.664, p = 0.42). There were no significant sample by AD interactions in the head (F1,35 = 2.02, p = 0.16), body (F1,335 = 2.79, p = 0.10), or tail (F1,335 = 3.36, p = 0.07).
An additional analysis was done in the full sample (n = 347) now separating cognitively normal (CDR = 0), very mild (CDR = 0.5), and mild (CDR = 1) AD groups. Estimated marginal means are depicted in Fig. 3. Increasing dementia severity was associated with reduced volumes for the head (rpartial = −0.403, p < 0.001), body (rpartial = −0.244, p < 0.001), and tail (rpartial = −0.185, p < 0.001). There was a greater effect of dementia severity on the head than the body (Z = −2.73, p < 0.01) and the tail (Z = −3.87, p < 0.001) but the body and tail did not significantly differ (Z = −0.94, p = 0.17). Pairwise comparisons indicated that all three subdivisions differed between cognitively normal participants and each of the AD groups (p’s < 0.05), but only the head was significantly different between CDR = 0.5 and CDR = 1 (t(45) = 2.7, p < 0.01).
DISCUSSION
Previous examinations of the differential effects of advancing age or AD on hippocampal subdivisions have yielded mixed findings, and are limited by a number of methodological concerns. To address the discrepancies found across prior work, we examined age and AD effects on hippocampal subdivisions in two large independent samples of middle-aged and older adults. The two samples provided a way to assess the reliability of our observed results. Additionally, we statistically compared the strength of associations across hippocampal subdivisions. In this way, our observed results go beyond the purely qualitative analyses often put forward in the existing literature.
Across the two samples, both the head and body demonstrated significantly greater linear age effects than the tail. Further, the magnitude of the age effects on the head and tail did not significantly differ across samples. The magnitude of the influence of age on the body varied across the two samples, although the direction of the effects was consistent. Thus, in Cognitively Normal Sample 1, there was a stronger effect of age on the head than the body, but in Cognitively Normal Sample 2, the age effects on the head and body were similar in magnitude. It is beyond the scope of the current work to fully address the underlying mechanisms of the discrepancy in age effects in the body across samples. One issue is that the body may have a greater mixture of anatomical connections than the head and tail [22]. Future work is needed to clarify how variance in underlying anatomical connections may give rise to the variability observed.
Taken together, the analyses of these two samples affirm a general anterior-to-posterior gradient in the effects of advancing age. An awareness of such variability is particularly important when trying to understand relationships between structural and behavioral measures. For example, mixed findings associating hippocampal volume with memory performance in aging samples [56] may be clarified by examining subdivisions along the longitudinal axis.
In general, the entirety of the hippocampus demonstrated atrophy in individuals with AD compared to cognitively normal individuals. When comparing cognitively normal individuals to those with early-stage AD, regardless of severity (collapsed CDR = 0.5 and 1), the head of the hippocampus evidenced greater volumetric differences than the tail in both samples. In addition, the magnitude of the AD effects did not differ across samples. Furthermore, in the combined sample, the head declined in a graded fashion between CDR = 0 to 0.5 to 1, whereas the body and tail did not. This selectivity is consistent with work indicating the sensitivity of anterior regions to an increasing severity of cognitive impairment [10, 19, 37, 39]. Correlating commonly used biomarkers of AD (e.g., cerebrospinal fluid and PET measures of amyloid and tau) and cognitive measures with volume estimates of specific hippocampal subdivisions may provide a fuller characterization of disease progression as well as provide an additional marker to examine cognitively normal individuals at risk for developing AD.
Greater anterior atrophy with both advancing age and AD may be associated with dysregulation of the hypothalamic-pituitary-adrenocortical (HPA). The hippocampus is a target of stress hormones released by the HPA axis, which is integral to the regulation of the stress response. The ventral (anterior) hippocampus has preferential connections with subcortical and hypothalamic nuclei involved in neuroendocrine function [20–22] and provides negative feedback to the HPA [57, 58]. This may predispose the anterior hippocampus to exhibit the most volume loss when HPA function is disrupted. Dysregulation of such neuroendocrine function has long been linked with advancing age [57–59], and has also been implicated in other disorders such as AD [60, 61], clinical depression [62], and chronic stress [63]. Coupled with knowledge about hippocampal projections to surrounding tissue, examining the subdivisions of the hippocampus may provide a richer understanding of these conditions.
The extant literature has varied in terms of the methods used to delineate hippocampal subdivisions, the age ranges studied, and the size of the sample populations. Protocols for delineation of the hippocampal subdivisions have included VBM [33, 35, 37], percentages of total hippocampal length on manually outlined hippocampi [31, 41], as well as manual identification of anatomical boundaries on manually outlined hippocampi [10, 32, 33, 36, 39]. The anatomical boundaries used for delineation are generally similar across studies, although some manual delineations leave out large parts of the hippocampal tail [10, 31, 34, 40]. Research that has reported greater posterior effects of aging utilized voxel-based methodologies [35, 37]. The differences between this approach and region of interest volumetric measurements may partially account for the contradictory findings in the literature examining aging, as systematic discrepancies between the two have been observed before [42]. In terms of age range, studies including younger adults have found both the greatest [32] and least [34, 36] declines in anterior regions. Thus, differences in age range do not explain the discrepancies in the literature. The current study included individuals from middle age through older adulthood. The extension of these analyses to include younger adults would provide a fuller characterization of differences throughout the lifespan. Prior work examining aging that has reported an anterior-to-posterior gradient has utilized sample sizes comparable to each of the independent samples examined here [10, 31]. In contrast, studies reporting greater posterior declines have had a small sample size (n’s < 45) [34–36]. Similarly, failure to detect significantly greater AD effects in anterior regions in past literature [40, 41] is likely related to small sample sizes (<20).
There are a number of important issues to take into account in considering the current work. The cognitively normal participants include a subset of individuals with a parental history of AD, which potentially limits the generalizability of the current findings. In addition, the results presented here do not represent change with age or AD status over time, but are derived from cross-sectional data. Future work comparing longitudinal and cross-sectional data is needed to expand upon the current results. Furthermore, the sample sizes for the cognitively normal groups were much larger than the sample sizes for the AD groups, thus the estimates of aging effects may be more robust than those for AD effects. However, the magnitudes of the aging and AD effects observed here were generally consistent with those reported in previous literature (e.g., [31–33, 37–39, 41]). Finally, underlying effects on hippocampal subfields may contribute to the effects of age and AD observed across the three subdivisions. Analyses indicate an unequal distribution of hippocampal subfields across the head, body, and tail [64], such that the head contains the bulk of the subiculum and cornu ammonis 1–3, while the largest portion of the dentate gyrus is located in the body. Understanding these relationships provides a potential connection between research examining subdivisions along the longitudinal axis in aging and AD to investigations assessing hippocampal subfields.
The work presented here expands upon previous investigations examining the effects of healthy and pathological aging across the longitudinal axis of the hippocampus. Along with careful screening criteria, the use of identical methodologies across two samples allowed for more robust determination of the effects of age and AD. We clarify previous work by examining the consistency across the two samples, as well as specifically testing the differential strength across the head, body, and tail rather than relying on qualitative approaches. We demonstrated an anterior-to-posterior gradient in the effects of both aging and AD in two cross-sectional examinations. This pattern supports the idea that the differing patterns of anatomical connectivity across the hippocampus may predispose subdivisions to specific types of vulnerability and illustrates the utility of parcellating the hippocampus.
Supplementary Material
Acknowledgments
This study was supported by NIH/NIA P01-AG03991, P50-AG05681, and P01-AG26276. Freesurfer computations were performed using the Washington University Center for High Performance Computing, which is partially supported through grant NCRR 1S10RR022984-01A1. B.A.G was supported by NIA 5T32AG00035.
The authors thank John Paul Bonadonna for assisting with the delineation of hippocampal subdivisions, the Clinical Core of the Knight ADRC at Washington University for participant assessments the Genetics Core for genotyping, and the Imaging Core for structural MRI data.
Footnotes
Authors’ disclosures available online (http://www.jalz.com/disclosures/view.php?id=1773).
Supplementary material can be found here: http://dx.doi.org/10.3233/JAD-130011
References
- 1.Allen JS, Bruss J, Brown CK, Damasio H. Normal neuroanatomical variation due to age: The major lobes and a parcellation of the temporal region. Neurobiol Aging. 2005;26:1245–1260. doi: 10.1016/j.neurobiolaging.2005.05.023. discussion 1279–82. [DOI] [PubMed] [Google Scholar]
- 2.Raz N, Ghisletta P, Rodrigue KM, Kennedy KM, Linden-berger U. Trajectories of brain aging in middle-aged and older adults: Regional and individual differences. Neuro Image. 2010;51:501–511. doi: 10.1016/j.neuroimage.2010.03.020. [DOI] [PMC free article] [PubMed] [Google Scholar]
- 3.Raz N, Lindenberger U, Rodrigue KM, Kennedy KM, Head D, Williamson A, Dahle C, Gerstorf D, Acker JD. Regional brain changes in aging healthy adults: General trends, individual differences and modifiers. Cereb Cortex. 2005;15:1676–1689. doi: 10.1093/cercor/bhi044. [DOI] [PubMed] [Google Scholar]
- 4.Walhovd KB, Fjell AM, Reinvang I, Lundervold A, Dale AM, Eilertsen DE, Quinn BT, Salat D, Makris N, Fischl B. Effects of age on volumes of cortex, white matter and subcortical structures. Neurobiol Aging. 2005;26:1261–1270. doi: 10.1016/j.neurobiolaging.2005.05.020. [DOI] [PubMed] [Google Scholar]
- 5.Walhovd KB, Westlye LT, Amlien I, Espeseth T, Reinvang I, Raz N, Agartz I, Salat DH, Greve DN, Fischl B, Dale AM, Fjell AM. Consistent neuroanatomical age-related volume differences across multiple samples. Neurobiol Aging. 2011;32:916–932. doi: 10.1016/j.neurobiolaging.2009.05.013. [DOI] [PMC free article] [PubMed] [Google Scholar]
- 6.Barnes J, Bartlett J, van de Pol L, Loy C, Scahill RI, Frost C, Thompson P, Fox NC. A meta-analysis of hippocampal atrophy rates in Alzheimer’s disease. Neurobiol Aging. 2009;30:1711–1723. doi: 10.1016/j.neurobiolaging.2008.01.010. [DOI] [PMC free article] [PubMed] [Google Scholar]
- 7.Csernansky J, Wang L, Joshi S, Miller J, Gado M, Kido D, McKeel D, Morris JC, Miller MI. Early DAT is distinguished from aging by high-dimensional mapping of the hippocampus. Neurology. 2000;55:1636–1643. doi: 10.1212/wnl.55.11.1636. [DOI] [PubMed] [Google Scholar]
- 8.deToledo-Morrell L, Sullivan M, Morrell F, Wilson RS, Bennett DA, Spencer S. Alzheimer’s disease: In vivo detection of differential vulnerability of brain regions. Neurobiol Aging. 1997;18:463–468. doi: 10.1016/s0197-4580(97)00114-0. [DOI] [PubMed] [Google Scholar]
- 9.Head D, Snyder AZ, Girton LE, Morris JC, Buckner RL. Frontal-hippocampal double dissociation between normal aging and Alzheimer’s disease. Cereb Cortex. 2005;15:732–739. doi: 10.1093/cercor/bhh174. [DOI] [PubMed] [Google Scholar]
- 10.Jack CR, Petersen RC, Xu CY, Waring SC, Brien PCO, Tangalos EG, Smith GE, Ivnik RJ, Kokmen E. Medial temporal atrophy on MRI in normal aging and very mild Alzheimer’s disease. Neurology. 1997;49:786–794. doi: 10.1212/wnl.49.3.786. [DOI] [PMC free article] [PubMed] [Google Scholar]
- 11.Convit A, De Leon M, Tarshish C, De Santi S, Tsui W, Rusinek H, George A. Specific hippocampal volume reductions in individuals at risk for Alzheimer’s disease. Neurobiol Aging. 1997;18:131–138. doi: 10.1016/s0197-4580(97)00001-8. [DOI] [PubMed] [Google Scholar]
- 12.Csernansky JG, Wang L, Swank J, Miller JP, Gado M, McKeel D, Miller MI, Morris JC. Preclinical detection of Alzheimer’s disease: Hippocampal shape and volume predict dementia onset in the elderly. Neuro Image. 2005;25:783–92. doi: 10.1016/j.neuroimage.2004.12.036. [DOI] [PubMed] [Google Scholar]
- 13.De Leon MJ, DeSanti S, Zinkowski R, Mehta PD, Pratico D, Segal S, Rusinek H, Li J, Tsui W, Saint Louis La, Clark CM, Tarshish C, Li Y, Lair L, Javier E, Rich K, Lesbre P, Mosconi L, Reisberg B, Sadowski M, DeBernadis JF, Kerkman DJ, Hampel H, Wahlund L-O, Davies P. Longitudinal CSF and MRI biomarkers improve the diagnosis of mild cognitive impairment. Neurobiol Aging. 2006;27:394–401. doi: 10.1016/j.neurobiolaging.2005.07.003. [DOI] [PubMed] [Google Scholar]
- 14.Den Heijer T, Geerlings MI, Hoebeek FE, Hofman A, Koudstaal PJ, Breteler MMB. Use of hippocampal and amygdalar volumes on magnetic resonance imaging to predict dementia in cognitively intact elderly people. Arch Gen Psychiatry. 2006;63:57–62. doi: 10.1001/archpsyc.63.1.57. [DOI] [PubMed] [Google Scholar]
- 15.Jack CR, Shiung B, Gunter J, O’Brien P, Weigand S, Knopman DS, Boeve BF, Ivnik RJ, Smith GE, Cha R, Tangalos E, Petersen RC. Comparison of different MRI brain atrophy rate measures with clinical disease progression in AD. Neurology. 2004;62:591–600. doi: 10.1212/01.wnl.0000110315.26026.ef. [DOI] [PMC free article] [PubMed] [Google Scholar]
- 16.Apostolova L, Mosconi L, Thompson PM, Green AE, Hwang KS, Ramirez A, Mistur R, Tsui WH, De Leon MJ. Subregional hippocampal atrophy predicts Alzheimer’s dementia in the cognitively normal. Neurobiol Aging. 2010;31:1077–1088. doi: 10.1016/j.neurobiolaging.2008.08.008. [DOI] [PMC free article] [PubMed] [Google Scholar]
- 17.Apostolova LG, Dutton Ra, Dinov ID, Hayashi KM, Toga AW, Cummings JL, Thompson PM. Conversion of mild cognitive impairment to Alzheimer disease predicted by hippocampal atrophy maps. Arch Neurol. 2006;63:693–699. doi: 10.1001/archneur.63.5.693. [DOI] [PubMed] [Google Scholar]
- 18.Dickerson B, Goncharova I, Sullivan M, Forchetti C, Wilson RS, Bennett DA, Beckett La, deToledo-Morrell L. MRI-derived entorhinal and hippocampal atrophy in incipient and very mild Alzheimer’s disease. Neurobiol Aging. 2001;22:747–754. doi: 10.1016/s0197-4580(01)00271-8. [DOI] [PubMed] [Google Scholar]
- 19.Whitwell JL, Przybelski SA, Weigand SD, Knopman DS, Boeve BF, Petersen RC, Jr, CRJ 3D maps from multiple MRI illustrate changing atrophy patterns as subjects progress from mild cognitive impairment to Alzheimer’s disease. Brain. 2007;130:1777–1786. doi: 10.1093/brain/awm112. [DOI] [PMC free article] [PubMed] [Google Scholar]
- 20.Moser M-B, Moser EI. Functional differentiation in the hippocampus. Hippocampus. 1998;8:608–619. doi: 10.1002/(SICI)1098-1063(1998)8:6<608::AID-HIPO3>3.0.CO;2-7. [DOI] [PubMed] [Google Scholar]
- 21.Witter MP, Amaral DG. Hippocampal formation. In: Paxinos G, editor. The Rat Nervous System. Elsevier; London: 2004. pp. 635–704. [Google Scholar]
- 22.Fanselow MS, Dong H-W. Are the dorsal and ventral hippocampus functionally distinct structures? Neuron. 2010;65:7–19. doi: 10.1016/j.neuron.2009.11.031. [DOI] [PMC free article] [PubMed] [Google Scholar]
- 23.Bannerman DM, Deacon RMJ, Offen S, Friswell J, Grubb M, Rawlins JNP. Double dissociation of function within the hippocampus: Spatial memory and hyponeophagia. Behav Neurosci. 2002;116:884–901. doi: 10.1037//0735-7044.116.5.884. [DOI] [PubMed] [Google Scholar]
- 24.Moser MB, Moser EI, Forrest E, Andersen P, Morris RG. Spatial learning with a minislab in the dorsal hippocampus. Proc Natl Acad Sci U S A. 1995;92:9697–9701. doi: 10.1073/pnas.92.21.9697. [DOI] [PMC free article] [PubMed] [Google Scholar]
- 25.Bannerman DM, Grubb M, Deacon RMJ, Yee BK, Feldon J, Rawlins JNP. Ventral hippocampal lesions affect anxiety but not spatial learning. Behav Brain Res. 2003;139:197–213. doi: 10.1016/s0166-4328(02)00268-1. [DOI] [PubMed] [Google Scholar]
- 26.Kjelstrup KG, Tuvnes FA, Steffenach H-A, Murison R, Moser EI, Moser M-B. Reduced fear expression after lesions of the ventral hippocampus. Proc Natl Acad Sci U S A. 2002;99:10825–10830. doi: 10.1073/pnas.152112399. [DOI] [PMC free article] [PubMed] [Google Scholar]
- 27.Bannerman DM, Rawlins JNP, McHugh SB, Deacon RMJ, Yee BK, Bast T, Zhang W-N, Pothuizen HHJ, Feldon J. Regional dissociations within the hippocampus—memory and anxiety. Neurosci Biobehav Rev. 2004;28:273–283. doi: 10.1016/j.neubiorev.2004.03.004. [DOI] [PubMed] [Google Scholar]
- 28.Thompson CL, Pathak SD, Jeromin A, Ng LL, MacPherson CR, Mortrud MT, Cusick A, Riley ZL, Sunkin SM, Bernard A, Puchalski RB, Gage FH, Jones AR, Bajic VB, Hawrylycz MJ, Lein ES. Genomic anatomy of the hippocampus. Neuron. 2008;60:1010–1021. doi: 10.1016/j.neuron.2008.12.008. [DOI] [PubMed] [Google Scholar]
- 29.Zhao X, Lein ES, He A, Smith SC, Aston C, Gage FH. Transcriptional profiling reveals hippocampal subregions. J Comp Neurol. 2001;441:187–196. doi: 10.1002/cne.1406. [DOI] [PubMed] [Google Scholar]
- 30.Small SA, Schobel SA, Buxton RB, Witter MP, Barnes CA. A pathophysiological framework of hippocampal dysfunction in ageing and disease. Nat Rev Neurosci. 2011;12:585–601. doi: 10.1038/nrn3085. [DOI] [PMC free article] [PubMed] [Google Scholar]
- 31.Chen KHM, Chuah LYM, Sim SKY, Chee MWL. Hippocampal region-specific contributions to memory performance in normal elderly. Brain Cogn. 2010;72:400–407. doi: 10.1016/j.bandc.2009.11.007. [DOI] [PubMed] [Google Scholar]
- 32.Rajah MN, Kromas M, Han JE, Pruessner JC. Group differences in anterior hippocampal volume and in the retrieval of spatial and temporal context memory in healthy young versus older adults. Neuropsychologia. 2010;48:4020–4030. doi: 10.1016/j.neuropsychologia.2010.10.010. [DOI] [PubMed] [Google Scholar]
- 33.Pruessner JC, Collins DL, Pruessner M, Evansa C. Age and gender predict volume decline in the anterior and posterior hippocampus in early adulthood. J Neurosci. 2001;21:194–200. doi: 10.1523/JNEUROSCI.21-01-00194.2001. [DOI] [PMC free article] [PubMed] [Google Scholar]
- 34.Driscoll I. The aging hippocampus: Cognitive, biochemical and structural findings. Cereb Cortex. 2003;13:1344–1351. doi: 10.1093/cercor/bhg081. [DOI] [PubMed] [Google Scholar]
- 35.Kalpouzos G, Chételat G, Baron J-C, Landeau B, Mevel K, Godeau C, Barré L, Constans J-M, Viader F, Eustache F, Desgranges B. Voxel-based mapping of brain gray matter volume and glucose metabolism profiles in normal aging. Neurobiol Aging. 2009;30:112–124. doi: 10.1016/j.neurobiolaging.2007.05.019. [DOI] [PubMed] [Google Scholar]
- 36.Malykhin NV, Bouchard TP, Camicioli R, Coupland NJ. Aging hippocampus and amygdala. Neuro Report. 2008;19:543–547. doi: 10.1097/WNR.0b013e3282f8b18c. [DOI] [PubMed] [Google Scholar]
- 37.Raji C, Lopez O, Kuller L, Carmichael O, Becker JT. Age, Alzheimer disease, and brain structure. Neurology. 2009;73:1899–1905. doi: 10.1212/WNL.0b013e3181c3f293. [DOI] [PMC free article] [PubMed] [Google Scholar]
- 38.Ta AT, Huang S-E, Chiu M-J, Hua M-S, Tseng W-YI, Chen S-HA, Qiu A. Age-related vulnerabilities along the hippocampal longitudinal axis. Hum Brain Mapp. 2012;33:2415–2427. doi: 10.1002/hbm.21364. [DOI] [PMC free article] [PubMed] [Google Scholar]
- 39.Martin S, Smith C, Collins H, Schmitt F, Gold BT. Evidence that volume of anterior medial temporal lobe is reduced in seniors destined for mild cognitive impairment. Neurobiol Aging. 2010;31:1099–1106. doi: 10.1016/j.neurobiolaging.2008.08.010. [DOI] [PMC free article] [PubMed] [Google Scholar]
- 40.Chan D, Fox NC, Scahill RI, Crum WR, Whitwell JL, Leschziner G, Rossor AM, Stevens JM, Cipolotti L, Rossor MN. Patterns of temporal lobe atrophy in semantic dementia and Alzheimer’s disease. Ann Neurol. 2001;49:433–442. [PubMed] [Google Scholar]
- 41.Echávarri C, Aalten P, Uylings HBM, Jacobs HIL, Visser PJ, Gronenschild EHBM, Verhey FRJ, Burgmans S. Atrophy in the parahippocampal gyrus as an early biomarker of Alzheimer’s disease. Brain Struct Funct. 2011;215:265–271. doi: 10.1007/s00429-010-0283-8. [DOI] [PMC free article] [PubMed] [Google Scholar]
- 42.Kennedy K, Erickson K, Rodrigue K, Voss MW, Colcombe SJ, Kramer AF, Acker JD, Raz N. Age-related differences in regional brain volumes: A comparison of optimized voxel-based morphometry to manual volumetry. Neurobiol Aging. 2009;30:1657–1676. doi: 10.1016/j.neurobiolaging.2007.12.020. [DOI] [PMC free article] [PubMed] [Google Scholar]
- 43.Xiong C, Roe C, Buckles V, Fagan A, Holtzman D, Balota D, Duchek J, Storand M, Mintun M, Grant E, Snyder A, Head D, Benzinger T, Mettenburg J, Csernansky J, Morris J. ROle of family history for alzheimer biomarker abnormalities in the adult children study. Arch Neurol. 2011;68:1313–1319. doi: 10.1001/archneurol.2011.208. [DOI] [PMC free article] [PubMed] [Google Scholar]
- 44.American Psychiatric Association. DSM-IV-TR Diagnostic and Statistical Manual of Mental Disorders. 4. Washington, DC: American Psychiatric Association; 2000. [Google Scholar]
- 45.Hughes CP, Berg L, Danziger WL, Coben LA, Martin RL. A new clinical scale for the staging of dementia. Br J Psychiatry. 1982;140:566–572. doi: 10.1192/bjp.140.6.566. [DOI] [PubMed] [Google Scholar]
- 46.Morris JC. The Clinical Dementia Rating (CDR): Current version and scoring rules. Neurology. 1993;43:2412–2414. doi: 10.1212/wnl.43.11.2412-a. [DOI] [PubMed] [Google Scholar]
- 47.Fischl B. FreeSurfer. Neuro Image. 2012;62:774–781. doi: 10.1016/j.neuroimage.2012.01.021. [DOI] [PMC free article] [PubMed] [Google Scholar]
- 48.Fischl B. Automatically parcellating the human cerebral cortex. Cereb Cortex. 2004;14:11–22. doi: 10.1093/cercor/bhg087. [DOI] [PubMed] [Google Scholar]
- 49.Tae WS, Kim SS, Lee KU, Nam E-C, Kim KW. Validation of hippocampal volumes measured using a manual method and two automated methods (FreeSurfer and IBASPM) in chronic major depressive disorder. Neuroradiology. 2008;50:569–581. doi: 10.1007/s00234-008-0383-9. [DOI] [PubMed] [Google Scholar]
- 50.Sánchez-Benavides G, Gómez-Ansón B, Sainz A, Vives Y, Delfino M, Peña-Casanova J. Manual validation of FreeSurfer’s automated hippocampal segmentation in normal aging, mild cognitive impairment, and Alzheimer disease subjects. Psychiatry Res. 2010;181:219–225. doi: 10.1016/j.pscychresns.2009.10.011. [DOI] [PubMed] [Google Scholar]
- 51.Buckner RL, Head D, Parker J, Fotenos AF, Marcus D, Morris JC, Snyder AZ. A unified approach for morphometric and functional data analysis in young, old, and demented adults using automated atlas-based head size normalization: Reliability and validation against manual measurement of total intracranial volume. Neuro Image. 2004;23:724–738. doi: 10.1016/j.neuroimage.2004.06.018. [DOI] [PubMed] [Google Scholar]
- 52.Shrout PE, Fleiss JL. Intraclass correlations: Uses in assessing rater reliability. Psychol Bull. 1979;86:420–428. doi: 10.1037//0033-2909.86.2.420. [DOI] [PubMed] [Google Scholar]
- 53.Yesavage JA, Brink TL, Rose TL, Lum O, Huang V, Adey M, Leirer VO. Development and validation of a geriatric depression screening scale: A preliminary report. J Psychiatr Res. 1982;17:37–49. doi: 10.1016/0022-3956(82)90033-4. [DOI] [PubMed] [Google Scholar]
- 54.Meng X, Rosenthal R, Rubin DB. Comparing correlated correlation coefficients. Psychol Bull. 1992;111:172–175. [Google Scholar]
- 55.Steiger JH. Tests for comparing elements of a correlation matrix. Psychol Bull. 1980;87:245–251. [Google Scholar]
- 56.Van Petten C. Relationship between hippocampal volume and memory ability in healthy individuals across the lifespan: Review and meta-analysis. Neuropsychologia. 2004;42:1394–1413. doi: 10.1016/j.neuropsychologia.2004.04.006. [DOI] [PubMed] [Google Scholar]
- 57.Lupien SJ, De Leon M, De Santi S, Convit a, Tarshish C, Nair NP, Thakur M, McEwen BS, Hauger RL, Meaney MJ. Cortisol levels during human aging predict hippocampal atrophy and memory deficits. Nat Neurosci. 1998;1:69–73. doi: 10.1038/271. [DOI] [PubMed] [Google Scholar]
- 58.Sapolsky R, Krey L, Mcewen BS. The neuroendocrinology of stress and aging: The glucocorticoid cascade hypothesis. Endocrine Rev. 2002;7:284–301. doi: 10.1210/edrv-7-3-284. [DOI] [PubMed] [Google Scholar]
- 59.Landfield P, Waymire J, Lynch G. Hippocampal aging and adrenocorticoids: Quantitative correlations. Science. 2011;202:1098–1102. doi: 10.1126/science.715460. [DOI] [PubMed] [Google Scholar]
- 60.Dong H, Csernansky JG. Effects of stress and stress hormones on amyloid-beta protein and plaque deposition. J Alzheimers Dis. 2009;18:459–469. doi: 10.3233/JAD-2009-1152. [DOI] [PMC free article] [PubMed] [Google Scholar]
- 61.Nation DA, Hong S, Jak AJ, Delano-Wood L, Mills PJ, Bondi MW, Dimsdale JE. Stress, exercise, and Alzheimer’s disease: A neurovascular pathway. Med Hypotheses. 2011;76:847–854. doi: 10.1016/j.mehy.2011.02.034. [DOI] [PMC free article] [PubMed] [Google Scholar]
- 62.Bremner J, Narayan M, Anderson ER, Staib LH, Miller HL, Charney DS. Hippocampal volume reduction in major depression. Am J Psychiatry. 2000;157:115–117. doi: 10.1176/ajp.157.1.115. [DOI] [PubMed] [Google Scholar]
- 63.Bremner JD. Does stress damage the brain? Biol Psychiatry. 1999;45:797–805. doi: 10.1016/s0006-3223(99)00009-8. [DOI] [PubMed] [Google Scholar]
- 64.Malykhin NV, Lebel RM, Coupland NJ, Wilmana H, Carter R. In vivo quantification of hippocampal subfields using 4.7 T fast spin echo imaging. Neuro Image. 2010;49:1224–1230. doi: 10.1016/j.neuroimage.2009.09.042. [DOI] [PubMed] [Google Scholar]
Associated Data
This section collects any data citations, data availability statements, or supplementary materials included in this article.