

Abstract
Post-translational modifications (PTMs) of proteins are essential mechanisms for virtually all dynamic processes within cellular signaling networks. Genetically encoded reporters based on fluorescent proteins (FPs) are powerful tools for spatiotemporal visualization of cellular parameters. Consequently, commonly used modular biosensor designs have been adapted to generate several protein-based indicators for monitoring various PTMs or the activity of corresponding enzymes in living cells, providing new biological insights into dynamics and regulatory functions of individual PTMs. In this review, we describe the application of general design strategies focusing on PTMs and discuss important considerations for engineering feasible indicators depending on the purpose. Moreover, we present developments and enhancements of PTM biosensors from selected studies and give an outlook on future perspectives of this versatile approach.
Introduction
Enzymatically controlled chemical modifications of proteins, commonly referred to as post-translational modifications (PTMs), assume a crucial role within cell physiology, being essential for almost all dynamic processes within living cells. Since the primary structure of a protein is ultimately determined by the encoding messenger RNA during protein synthesis, chemical modification after translation is a required and therefore ubiquitous mechanism for an organism to expand its proteome further.1 The most common covalent PTMs occurring in cells are the cleavage of the protein backbone, phosphorylation, acetylation, glycosylation, methylation, and ubiquitylation. The corresponding chemical reactions, whose reversibility is determined by the chemical nature of the involved reactants and the availability of appropriate enzymes in the cellular context, cause changes of protein surface and structure. This can result in gain or loss of enzymatic activity, generation or alteration of protein interaction sites, and changes of subcellular localization, overall mechanisms that are particularly necessary for complex cellular signaling networks.2
Because of the general importance of PTMs for cellular processes, great effort has been put into identifying PTMs and investigating their regulation of protein function and role in signaling. These tasks have been proved to be challenging, since most PTMs are transient, present in low abundance, and highly dependent on the state of related signaling pathways. Consequently, proteomic approaches have constantly been developed and improved to identify and characterize modified proteins, currently mainly focusing on investigating combinatorial PTM patterns.3
A widely-applied strategy to monitor dynamic cellular processes temporally- and spatially-resolved in living cells is the use of genetically encodable biosensors based on fluorescent proteins (FPs). This approach offers many advantages, as the cellular translational machinery is utilized to synthesize and target these probes in situ continuously, no exogenous factors are required for chromophore formation, and FPs as a main component are intensively studied and constantly refined by researchers.4 Furthermore, these biosensors typically incorporate proteins or particular domains that are genuinely involved in signaling processes, naturally evolved to sense and mediate distinct cellular responses precisely within the physiological range. Although the protein-based sensors described so far have been designed to observe several processes and interactions, basic design concepts have been demonstrated to be generally applicable. A large number of biosensors rely on Förster resonance energy transfer (FRET), a physical effect that allows the nonradiative transfer of energy between a donor and an acceptor chromophore within a nanometer range under certain conditions.5 In order to utilize FRET, a pair of fluorescent proteins capable of undergoing FRET is combined with a protein or protein domains, translating cellular events into changes of FRET efficiency.6
Shortly after the initial cloning and characterization of the green fluorescent protein (GFP)7, and concurrent with the generation of improved and color-shifted derivatives of GFP suitable for FRET, the first sensor for a PTM, protein cleavage by a protease, was published, primarily as a proof of principle.8 Over the past years, many more FRET-sensors have been developed to investigate a broad range of PTM dynamics and successfully used to acquire new biological insights (Table 1). For methodological reasons, the activity of protein-modifying enzymes on a substrate-derived protein domain integrated into the sensor is usually measured rather than the modification state of endogenous proteins.9
Table 1.
Published FP-based biosensors for monitoring PTM dynamics
| Post-translational modification | Name(s) | References |
|---|---|---|
| Acetylation | ||
| Histone 4 – K5 and K8 acetylation | Histac | 36, 37 |
| Cleavage of the protein backbone (enzyme specific) | ||
| Caspase-3 | Caspase-3 activity sensor | 40 |
| Caspase-3 and Caspase-6 | CFP-c3-YFP-c6-mRFP | 41 |
| Caspase-3 and Caspase-8 | CYR83 | 42 |
| MT1-MMP | MT1-MMP sensor | 43 |
| Glycosylation | ||
| β-O- GlcNAcylation | O-GlcNAc sensor, OS2 | 38, 39 |
| Methylation | ||
| Histone 3 – K9 methylation | K9 reporter, MARC | 32, 33 |
| Histone 3 – K27 methylation | K27 reporter, H3K27-MetBio3 | 32, 34 |
| Phosphorylation (enzyme-specific) | ||
| Abl kinase | Crk-based reporter | 44 |
| ATM kinase | ATOMIC | 45 |
| Aurora B kinase | Aurora B kinase sensor | 46 |
| Calcineurin | CaNAR (indicates phosphatase activity) | 47 |
| CyclinB1-CDK1 | CyclinB1-CDK1 sensor | 48 |
| EGFR autophosphorylation | EGFR-eCFP/PTB-eYFP, FLAME | 19 |
| EGFR | Picchu-Z, EGFR reporter, Crk-based reporter, ECaus | 44, 49, 50 |
| Extracellular signal regulated kinase | EKAR, EKAREV, Erkus | 30, 51, 52 |
| Histone 3 – S28 phosphorylation | Histone phosphorylation reporter | 53 |
| Insulin receptor kinase | Phocus, Sinphos | 54, 55 |
| c-Jun N-terminal kinase (JNK) | JNKAR1, JNKAR1EV | 30, 56 |
| Protein Kinase A (PKA) | AKAR1-4, AKAR3EV | 22, 23, 25, 30 |
| Protein Kinase B (PKB/Akt) | BKAR, AktAR, Aktus, Eevee-Akt | 30, 54, 57, 58 |
| Protein Kinase C (PKC) | CKAR, KCP1, δCKAR, Eevee-PKCβ | 13, 28–30 |
| Protein Kinase D (PKD) | DKAR | 59 |
| Receptor tyrosine kinases | Picchu, PicchuEV | 30, 60 |
| p90 ribosomal S6 kinase (RSK) | Eevee-RSK | 30 |
| p70 ribosomal S6 kinase (S6K) | Eevee-S6K | 30 |
| Src | Src reporter, Srcus | 54, 61 |
| Ubiquitination | ||
| Polyubiquitination | UbG76V-Dendra2 (based on a photoconvertible FP – does not conform with the standard design approach presented in this review) | 62 |
To illustrate recent developments and improvements of FRET-based biosensors for PTMs, this review introduces general design ideas for protein-based reporters, highlights selected examples of biosensor application and optimization, describes central corresponding biological insights provided, and illuminates possible future perspectives.
General Design Strategies for FP-based PTM Indicators
To date, hundreds of genetically encodable biosensors based on FPs have been published, utilizing over 50 different variants of FPs to monitor various types of dynamic processes in living cells.6 Despite this tremendous diversity, the strategies for designing these indicators are surprisingly similar. To engineer a custom protein-based reporter, the virtually universal design approach consists of creating two functional modules, a sensing and a reporting unit, and combining those components expediently (Figure 1).
Figure 1.
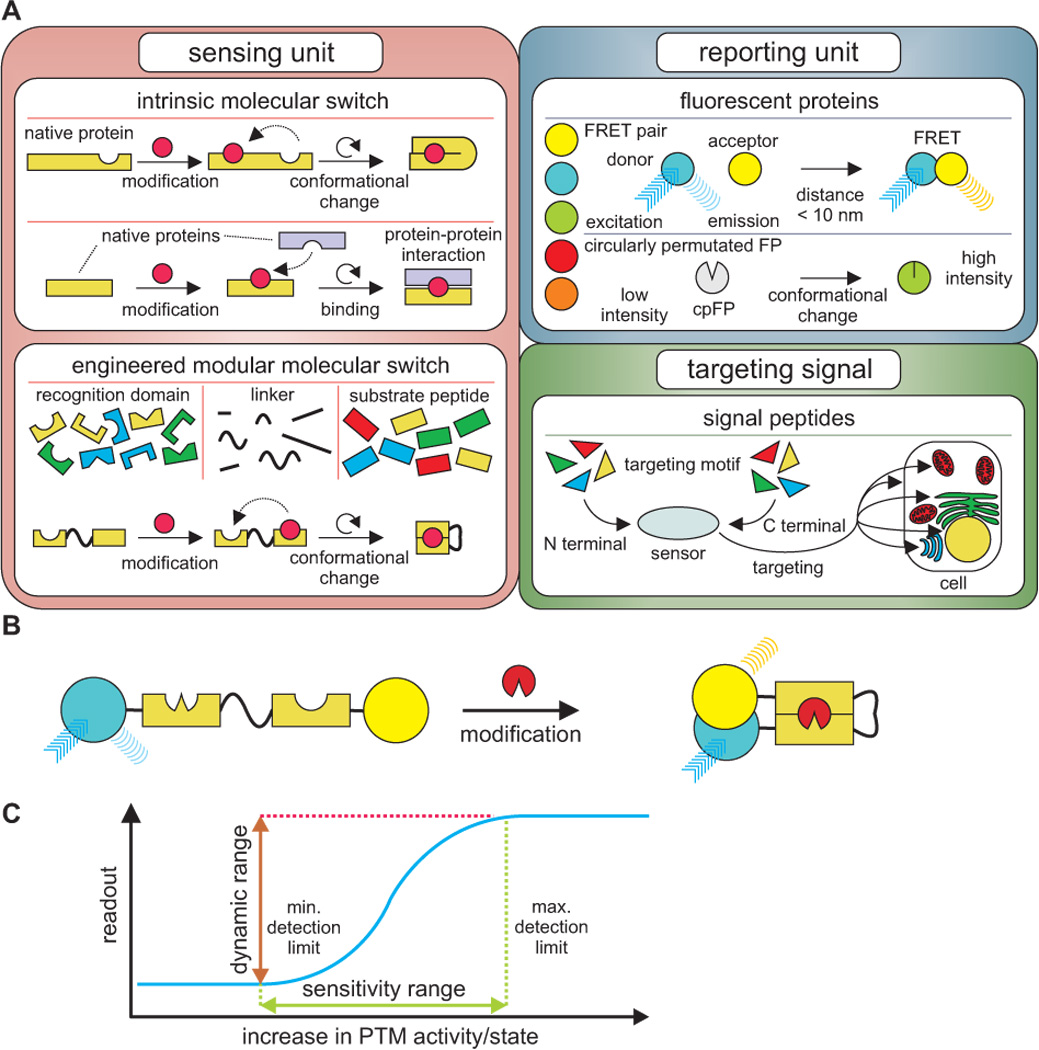
General design and operation of a FP-based biosensor. (A) Molecular toolbox for the generation of modular FP-based biosensors. A sensing unit comprised of an intrinsic or engineered molecular switch is combined with a FP-based reporting unit. Optionally, a targeting motif can be added. (B) Schematic example of the operation of a unimolecular FRET-based PTM sensor with an engineered molecular switch. The substrate peptide is modified resulting in a conformational change that increases FRET. (C) Representative schematic diagram of the dependence of the readout on the PTM activity or state, respectively, for a FP-based PTM reporter, also illustrating the general properties of a biosensor.
More specifically, the sensing unit comprises a molecular switch that consists of proteins, protein domains or peptides and responds to changes of a distinct cellular parameter by structural rearrangements that are transmitted to the reporting unit and converted to a fluorescent signal. For FRET-based biosensors, the reporting unit is normally a FRET-pair of FPs providing the FRET-efficiency as readout, which depends on the proximity within a range of 10 nm and the orientation of the fluorophores to each other. Detecting FRET therefore has a lot of advantages compared to simply measuring changes or translocation of fluorescence, particularly since molecular events at a nanometer scale, such as protein-protein interactions or conformational changes of proteins, can generally be monitored regardless of the optical resolution. In addition, ratiometric analysis of the donor and acceptor fluorescence offers higher quality imaging data due to a stronger robustness to artifacts. Aside from that, other FP-based biosensors have been developed containing only a single FP serving as reporting unit, utilizing FP variants whose fluorescence intensity is susceptible to variations in their molecular environment, like circularly permutated FPs.10 Accordingly, the readout of this type of biosensor is the fluorescence intensity.
The design of the molecular switch can be based on the intrinsic property of a protein required to mediate its functional regulation in response to a signaling event. In case of PTMs, protein-modifying enzymes or substrate proteins that undergo a conformational change upon a change of their activation or modification state, respectively, can serve to detect PTM dynamics. For instance, the termini of Protein Kinase B (PKB)/Akt, an enzyme that phosphorylates specific serine/threonine residues, have been labeled with a FRET pair of FPs for the purpose of generating a probe that indicates the activation and phosphorylation state of PKB/Akt11. In addition, chemical modification of several protein kinase substrates has been monitored exploiting single substrate protein domains as a detector flanked by FPs.12, 13 To overcome the limitation of relying on naturally occurring conformational changes, the sensing unit can be engineered, usually by combining a distinct substrate peptide and a protein domain that specifically recognizes the modified or non-modified substrate peptide with a flexible peptide linker in between. Modification of the substrate peptide then results in a gain or loss of interaction of the modules, constituting a modification-dependent switch. Advantageously, due to the functional role of PTMs, the definite existence of naturally occurring recognition domains for almost all PTMs can be presumed14 and many have already been explored.15 A whole class of biosensors reporting kinase activity is based on this modular scheme, containing a kinase substrate domain linked to a phosphoamino acid binding domain (PAABD) to detect kinase-specific phosphorylation utilizing the evoked conformational change.16 Another optional component of a genetically encoded biosensor is a targeting sequence that localizes the probe to a cellular compartment, allowing spatially refined analyses of PTM dynamics. In this regard, diverse naturally occurring targeting motifs can be selected to be fused to sensor constructs directing them to distinct cellular locations, a widely used method in several research areas.17
Several topics have to be considered following the described general design approach to create a biosensor to report PTMs dynamics. First, an appropriate switch for the PTM under study has to be chosen. The most straightforward strategy appears to be the construction of a sensing element that directly interacts with the endogenous modified protein of interest;18 however, this approach has high demands in signal generation since it lacks any signal amplification and the generated response is strictly proportional to the extent of interaction. Furthermore, the sensing process inevitably impedes regulatory functions of the PTM at high interaction levels, interfering with signal propagation by competing with endogenous interaction partners. Consequently, the use of a molecular switch sensing the activation of the enzyme catalyzing the corresponding PTM reaction on a surrogate substrate peptide, either intrinsic or engineered as described above, is a more common approach. In this case, the preceding cellular events affect endogenous and probe molecules similarly, amplifying the transmission and limiting perturbation. However, the observable readout only indirectly reflects the modification state of endogenous proteins, and depending on the purpose of the analysis and whether available intrinsic switches are feasible, it must be decided which variant is more conducive.
A crucial decision for biosensor generation is whether a unimolecular or a bimolecular design should be used. Unimolecular design strategies are usually favorable for most applications, providing a defined ratio between FRET donor and acceptor chromophores, ensuring sensitivity due to the proximity of all involved elements, and allowing reliable targeting. Nevertheless, some molecular switches effectively operate by the assembly or dissociation of proteins or protein domains, rendering the use of two separate components, each fused to a FP of a FRET pair, more feasible. While these bimolecular sensor systems require an adequate expression of both components to function properly, they potentially exhibit a higher dynamic range, defined as the maximum acquirable response, since the basal FRET is expected to be lower due to the spatial separation of the individual components. This approach has been used, for instance, to visualize phosphorylation of the epidermal growth factor receptor (EGFR), using an eCFP-labeled EGFR and an eYFP-tagged phosphotyrosine-binding domain (PTB) which specifically binds to phosphorylated EGFR.19 To overcome the challenge of stoichiometric expression, strategies such as the exploit of viral 2A peptides have been applied to generate self-cleaving polyproteins ideally resulting in equimolarly expressed sensor components.20
While the dynamic range depends on the properties of all sensor components, the other characteristics of the sensor response on the macroscopic level - sensitivity range and sensing kinetics - are primarily determined by the performance of the sensing unit, since the observable readout of FP-based biosensors simply indicates the extent of molecular switches actually detecting the PTM of interest. The feasibility of a quantitative interpretation of the response therefore depends on the properties of the sensing unit and represents a challenging task, as discrepancies may occur if the monitored parameter exceeds the sensitivity range or the sensing kinetics are significantly slower than the observed event. Moreover, as briefly mentioned above, it has to be taken into account that the introduction of a protein-based biosensor into the context of a living cell can interfere with cellular mechanisms and even distort the parameter under study, known as observer effect. Molecular switches derived from native proteins can participate in cellular pathways which may result in amplification or attenuation of subsequent signaling events; the sequestering of a target protein can slow down its turnover; and surrogate substrates buffer enzymatic activity, probably altering the occurrence of the corresponding cellular responses. The resulting deviation between readout and cellular response has recently been investigated using mathematical models, which show that the optimization of the molecular switch, particularly in terms of affinity of the recognition element for the target molecule, and the mathematical evaluation of the sensor response, minimize deviations and may permit quantitative analyses.21
Application and Improvements
Phosphorylation, the covalent addition of a phosphoryl group to the hydroxyl group of serine or threonine residues in eukaryotes, is catalyzed by kinases. The human kinase superfamily, termed the kinome, comprises over 500 members in humans, indicating the vast importance of this PTM for cellular signaling. Therefore, it is not surprising that a large number of the biosensors previously described were created to detect phosphorylation or corresponding enzyme activity of kinases and have continuously been developed further.16 The first genetically encoded FRET-based sensor to visualize protein phosphorylation by protein kinase A (PKA), a kinase activity reporter 1 (AKAR1), for instance, contains the PAABD of 14-3-3τ linked to a consensus substrate for PKA, acting as a molecular switch that is sandwiched between CFP and YFP. This indicator has been used to study compartmentalized and dynamic modulation of PKA-driven phosphorylation.22 It has been improved over the last decade by replacing the sensing unit with the forkhead associated domain 1 (FHA1)-based PAABD, which exhibits a significantly lower affinity to substrate peptides than 14-3-3τ, and an adapted consensus substrate combined with an optimized linker (AKAR2), resulting in better reversibility.23 Moreover, the FPs have been substituted several times with enhanced variants to increase the dynamic range, lately to Cerulean and circularly permutated (E172) Venus24 to generate AKAR4. Utilizing targeted versions of AKAR4, the specific PKA activity in lipid rafts and non-raft regions of the plasma membrane has been investigated, indicating that raft regions exhibit high basal PKA activity and cells respond with enhanced plasma membrane PKA activity after receptor-mediated stimulation upon raft disruption.25 Furthermore, this probe has been directed to cytosol and nucleus in order to spatially distinguish PKA-driven phosphorylation, supplying data to propose a new model for nuclear PKA dynamics.26 These experiments exemplarily prove that compartment-specific analysis of kinase-mediated phosphorylation, even on a submicroscopic level, is generally feasible using protein-based probes, and similar developments have occurred for analog sensor constructs detecting phosphorylation by other kinases.27 In this context, another interesting aim is the differentiation even between individual kinase isozymes. This has been accomplished for protein kinase C (PKC) δ by replacing the substrate peptide of the C kinase activity reporter (CKAR)28, structurally designed like AKAR, with a specific sequence laboriously derived from PKC δ-selective substrates. This probe, named δCKAR, has been targeted to diverse cellular locations, showing basal activity at the plasma membrane and, more importantly, that catalytic activity of PKC δ in the nucleus is controlled by Src family kinases.29 Due to the similar modular structure of kinase sensors involving an engineered switch containing a surrogate substrate peptide, efforts have recently been made to generally optimize the backbone of these indicators. For this purpose, a flexible linker of 116 amino acids has been inserted between PAABD and kinase consensus substrate in order to reduce basal FRET by increasing the distance between the fluorophores in the non-modified (OFF) state. Moreover, the combination of the FPs ECFP and YPet or Turquoise-GL and Ypet, respectively, have been identified to provide the largest dynamic range among the tested biosensor variants containing the long flexible linker. This optimized backbone, named ‘Eevee’, has been used to adapt existing sensors and generate new probes.30 In summary, current kinase biosensors permit spatially resolved visualization of kinase-specific phosphorylation of proteins and benefit from ongoing progress that assures further refinement of this technique.
Beyond phosphorylation, methylation, the attachment of a methyl group to the ammonium group of lysine or arginine residues, and N-acetylation, the addition of an acetyl group to the ammonium group of lysine residues, have been prominent targets for developing biosensors. These modification types can predominantly be found in the nucleus, more precisely at histones, and play regulatory roles in DNA transcription, repair, replication and condensation.31 To visualize methylation of histone 3, for example, unimolecular FRET-based indicators have been generated to monitor the modification of lysines at positions 9 and 27, which both assume an important role in the regulation of transcriptional repression, X-inactivation, and cellular differentiation. Each sensing unit consists of a short peptide sequence derived from histone 3 containing the lysine of interest, a flexible linker, and an appropriate methyllysine binding domain (bromodomain).32 Adapting the design of the H3K9 methylation sensor, a targeting motif for the chromosome centromere has been added and the FPs have been replaced with mCerulean and mVenus to create a methylation activity reporter at the centromere (MARC). MARC has been used to investigate the dynamics of H3K9 methylation by SUV39H1 methyltransferase, which is an essential regulator during mitosis at the centromere, indicating that centromere methylation is coupled to Aurora B kinase activity and a gradient of methylation marks is generated and required for chromosome segregation in mitosis.33 Moreover, the aforementioned probe for methylation of H3K27 served as a template for an optimization approach, where a new high-throughput method was developed to screen for sensor variants containing optimal linker combinations in colonies of E.Coli. By optimizing the linking sequences between the individual components, an enhanced sensor with an improved dynamic range, termed H3K27-MetBio3, has been identified.34 N-acetylation at histones has initially been visualized using bimolecular FRET-based biosensors by fusing CFP to bromodomain-containing proteins and YFP to members of different histone families. However, this has primarily been performed to determine the specificity of miscellaneous bromodomains in binding individual modified lysines.35 A protein-based FRET indicator for real-time monitoring of simultaneous acetylation of lysine 5 and 8 in histone 4, termed Histac, has been engineered subsequently, comprising the bromodomain region of the protein BRDT linked to the full histone 4 protein, flanked by the FPs Venus and CFP. Histac has been exploited to investigate the role of histone 4 acetylation dynamics within the cell cycle, indicating a significant decrease during mitosis.36, 37 Although these examples illustrate the successful application of genetically encoded FRET-based biosensors to investigate the dynamics of histone methylation and acetylation, the accurate detection of subnuclear combinatorial modification patterns requires a high spatial resolution and multiparameter imaging that is not yet available.
In comparison to the aforementioned PTMs, FP-based indicators for other modifications have rarely been generated, although the published examples display the potential of this approach to provide new findings. O-Glycosylation, for instance, the attachment of the monosaccharide β-O-N-acetyl-D-glucosamine (O-GlcNAc) to the hydroxyl group of serine and threonine residues, is known to be broadly involved in cellular signaling. A FRET biosensor has been designed based on the common unimolecular modular scheme, including GafD, a lectin from E. Coli, as recognition domain and a peptide sequence from caseine kinase II as a substrate.38 More recently, its dynamic range has been optimized, and this improved version has been targeted to nucleus, cytosol and plasma membrane compartments, showing spatially discrete dynamics upon serum-stimulation, particularly a fast rise in O-Glycosylation activity in the nucleus and at distinct membrane patches.39 Only a few more PTMs have also been analyzed applying strategies comparable to the examples presented above, leaving much room for pioneers to introduce and enhance FP-based reporters for further PTMs.
Discussion
Since GFP was first used to label and track proteins in the context of a living cell, genetically encoded FP-based indicators have emerged to a powerful tool for spatiotemporal visualization of diverse cellular events. Consequently, a number of biosensors have been developed to monitor PTMs of proteins or the activity of the corresponding enzymes. These indicators have successfully been used to characterize the PTM-dependent regulation involved in complex signaling networks, and continuously improved to address new, more complex and detailed questions. In general, every step of development has provided new perspectives and accompanying issues, and in order to extend the feasibility of this technique for the research of PTM dynamics today, further refinements have to be attained. First, regulatory functions of PTMs are frequently mediated by combinatory patterns of distinct PTMs14, and their investigation requires visualization of multiple parameters. This can be accomplished by the simultaneous use of FRET-based probes, but exploiting several FRET pairs for multiplexed imaging poses a challenge, since the spectral overlap between the FPs impedes obtaining clearly distinguishable readouts. Therefore, strategies to reduce the number of involved fluorophores, like the use of a ‘shared’ donor or acceptor, newly developed single-fluorophore-based biosensors for PTMs or the combination of different imaging techniques would be beneficial.63 Moreover, photoluminescent and water-soluble semiconductor quantum dots (QDs) might be considered as an alternative to FPs in multiparameter imaging experiments, providing narrower excitation and emission spectra. There are many difficulties in using QDs for live cell imaging, and more research is necessary for QDs to become a feasible alternative to FPs, but issues of this method, in particular the efficient delivery into the cell, have recently been addressed by using specially treated polymer-coated QDs.64 Analogous to appropriate advances in mass spectroscopy3, the establishment of a widely usable concept for high-throughput methods for the analysis of PTM dynamics in living cells with FP-based reporters is highly desirable. In order to miniaturize individual experiments for this purpose, a high dynamic range of the biosensor and a low signal to noise ratio are required, and also the employment of a certain degree of quantitative analysis would be beneficial. Efforts in this direction have allowed for analyzing changes in phosphorylation in response to a variety of compounds30, 65, and further optimization and extension to other PTMs may allow screening for new functional links between cellular signaling pathways and the occurrence of PTMs. Beside these studies displaying prospective future directions, ongoing progress in FP enhancement, imaging techniques and data evaluation will ensure that FP-based biosensors remain a promising and versatile tool to investigate spatiotemporal PTM dynamics.
Acknowledgements
We want to thank members of the Zhang lab for inspiring discussions, and particularly Laurel Oldach for carefully reading the manuscript. This work is supported by the National Institutes of Health (R01DK073368 and DP1CA174423 to J.Z.).
Contributor Information
Fabian Hertel, The Johns Hopkins University School of Medicine, Department of Pharmacology and Molecular Sciences, Baltimore, MD 21205, USA.
Jin Zhang, The Johns Hopkins University School of Medicine, Department of Pharmacology and Molecular Sciences, Baltimore, MD 21205, USA.
References
- 1.Wold F. Annu Rev Biochem. 1981;50:783–814. doi: 10.1146/annurev.bi.50.070181.004031. [DOI] [PubMed] [Google Scholar]
- 2.Walsh CT, Garneau-Tsodikova S, Gatto GJ., Jr Angew Chem Int Ed Engl. 2005;44:7342–7372. doi: 10.1002/anie.200501023. [DOI] [PubMed] [Google Scholar]
- 3.Young NL, Plazas-Mayorca MD, Garcia BA. Expert Rev Proteomics. 2010;7:79–92. doi: 10.1586/epr.09.100. [DOI] [PubMed] [Google Scholar]
- 4.Stepanenko OV, Stepanenko OV, Shcherbakova DM, Kuznetsova IM, Turoverov KK, Verkhusha VV. BioTechniques. 2011;51:313–314. doi: 10.2144/000113765. 316, 318 passim. [DOI] [PMC free article] [PubMed] [Google Scholar]
- 5.Forster T. J Biomed Opt. 2012;17:011002. doi: 10.1117/1.JBO.17.1.011002. [DOI] [PubMed] [Google Scholar]
- 6.Newman RH, Fosbrink MD, Zhang J. Chem Rev. 2011;111:3614–3666. doi: 10.1021/cr100002u. [DOI] [PMC free article] [PubMed] [Google Scholar]
- 7.Prasher DC, Eckenrode VK, Ward WW, Prendergast FG, Cormier MJ. Gene. 1992;111:229–233. doi: 10.1016/0378-1119(92)90691-h. [DOI] [PubMed] [Google Scholar]
- 8.Heim R, Tsien RY. Curr Biol. 1996;6:178–182. doi: 10.1016/s0960-9822(02)00450-5. [DOI] [PubMed] [Google Scholar]
- 9.Aye-Han NN, Ni Q, Zhang J. Curr Opin Chem Biol. 2009;13:392–397. doi: 10.1016/j.cbpa.2009.07.009. [DOI] [PMC free article] [PubMed] [Google Scholar]
- 10.Berg J, Hung YP, Yellen G. Nat Methods. 2009;6:161–166. doi: 10.1038/nmeth.1288. [DOI] [PMC free article] [PubMed] [Google Scholar]
- 11.Calleja V, Ameer-Beg SM, Vojnovic B, Woscholski R, Downward J, Larijani B. Biochem J. 2003;372:33–40. doi: 10.1042/BJ20030358. [DOI] [PMC free article] [PubMed] [Google Scholar]
- 12.Nagai Y, Miyazaki M, Aoki R, Zama T, Inouye S, Hirose K, Iino M, Hagiwara M. Nat Biotechnol. 2000;18:313–316. doi: 10.1038/73767. [DOI] [PubMed] [Google Scholar]
- 13.Schleifenbaum A, Stier G, Gasch A, Sattler M, Schultz C. J Am Chem Soc. 2004;126:11786–11787. doi: 10.1021/ja0460155. [DOI] [PubMed] [Google Scholar]
- 14.Minguez P, Parca L, Diella F, Mende DR, Kumar R, Helmer-Citterich M, Gavin AC, van Noort V, Bork P. Mol Syst Biol. 2012;8:599. doi: 10.1038/msb.2012.31. [DOI] [PMC free article] [PubMed] [Google Scholar]
- 15.Seet BT, Dikic I, Zhou MM, Pawson T. Nat Rev Mol Cell Biol. 2006;7:473–483. doi: 10.1038/nrm1960. [DOI] [PubMed] [Google Scholar]
- 16.Zhang J, Allen MD. Mol Biosyst. 2007;3:759–765. doi: 10.1039/b706628g. [DOI] [PubMed] [Google Scholar]
- 17.Mossalam M, Dixon AS, Lim CS. Ther Deliv. 2010;1:169–193. doi: 10.4155/tde.10.8. [DOI] [PMC free article] [PubMed] [Google Scholar]
- 18.Gulyani A, Vitriol E, Allen R, Wu J, Gremyachinskiy D, Lewis S, Dewar B, Graves LM, Kay BK, Kuhlman B, Elston T, Hahn KM. Nat Chem Biol. 2011;7:437–444. doi: 10.1038/nchembio.585. [DOI] [PMC free article] [PubMed] [Google Scholar]
- 19.Offterdinger M, Georget V, Girod A, Bastiaens PI. J Biol Chem. 2004;279:36972–36981. doi: 10.1074/jbc.M405830200. [DOI] [PubMed] [Google Scholar]
- 20.Hertel F, Switalski A, Mintert-Jancke E, Karavassilidou K, Bender K, Pott L, Kienitz MC. PLoS One. 2011;6:e20855. doi: 10.1371/journal.pone.0020855. [DOI] [PMC free article] [PubMed] [Google Scholar]
- 21.Haugh JM. Biophys J. 2012;102:2003–2011. doi: 10.1016/j.bpj.2012.03.055. [DOI] [PMC free article] [PubMed] [Google Scholar]
- 22.Zhang J, Ma Y, Taylor SS, Tsien RY. Proc Natl Acad Sci U S A. 2001;98:14997–15002. doi: 10.1073/pnas.211566798. [DOI] [PMC free article] [PubMed] [Google Scholar]
- 23.Zhang J, Hupfeld CJ, Taylor SS, Olefsky JM, Tsien RY. Nature. 2005;437:569–573. doi: 10.1038/nature04140. [DOI] [PubMed] [Google Scholar]
- 24.Nagai T, Yamada S, Tominaga T, Ichikawa M, Miyawaki A. Proc Natl Acad Sci U S A. 2004;101:10554–10559. doi: 10.1073/pnas.0400417101. [DOI] [PMC free article] [PubMed] [Google Scholar]
- 25.Depry C, Allen MD, Zhang J. Mol Biosyst. 2011;7:52–58. doi: 10.1039/c0mb00079e. [DOI] [PubMed] [Google Scholar]
- 26.Sample V, DiPilato LM, Yang JH, Ni Q, Saucerman JJ, Zhang J. Nat Chem Biol. 2012;8:375–382. doi: 10.1038/nchembio.799. [DOI] [PMC free article] [PubMed] [Google Scholar]
- 27.Scott JD, Newton AC. BMC Biol. 2012;10 doi: 10.1186/1741-7007-10-61. 61-7007-10-61. [DOI] [PMC free article] [PubMed] [Google Scholar]
- 28.Violin JD, Zhang J, Tsien RY, Newton AC. J Cell Biol. 2003;161:899–909. doi: 10.1083/jcb.200302125. [DOI] [PMC free article] [PubMed] [Google Scholar]
- 29.Kajimoto T, Sawamura S, Tohyama Y, Mori Y, Newton AC. J Biol Chem. 2010;285:41896–41910. doi: 10.1074/jbc.M110.184028. [DOI] [PMC free article] [PubMed] [Google Scholar]
- 30.Komatsu N, Aoki K, Yamada M, Yukinaga H, Fujita Y, Kamioka Y, Matsuda M. Mol Biol Cell. 2011;22:4647–4656. doi: 10.1091/mbc.E11-01-0072. [DOI] [PMC free article] [PubMed] [Google Scholar]
- 31.Kouzarides T. Cell. 2007;128:693–705. doi: 10.1016/j.cell.2007.02.005. [DOI] [PubMed] [Google Scholar]
- 32.Lin CW, Jao CY, Ting AY. J Am Chem Soc. 2004;126:5982–5983. doi: 10.1021/ja038854h. [DOI] [PubMed] [Google Scholar]
- 33.Chu L, Zhu T, Liu X, Yu R, Bacanamwo M, Dou Z, Chu Y, Zou H, Gibbons GH, Wang D, Ding X, Yao X. J Mol Cell Biol. 2012;4:331–340. doi: 10.1093/jmcb/mjs023. [DOI] [PMC free article] [PubMed] [Google Scholar]
- 34.Ibraheem A, Yap H, Ding Y, Campbell RE. BMC Biotechnol. 2011;11:105. doi: 10.1186/1472-6750-11-105. [DOI] [PMC free article] [PubMed] [Google Scholar]
- 35.Kanno T, Kanno Y, Siegel RM, Jang MK, Lenardo MJ, Ozato K. Mol Cell. 2004;13:33–43. doi: 10.1016/s1097-2765(03)00482-9. [DOI] [PubMed] [Google Scholar]
- 36.Sasaki K, Ito T, Nishino N, Khochbin S, Yoshida M. Proc Natl Acad Sci U S A. 2009;106:16257–16262. doi: 10.1073/pnas.0902150106. [DOI] [PMC free article] [PubMed] [Google Scholar]
- 37.Dancy BM, Crump NT, Peterson DJ, Mukherjee C, Bowers EM, Ahn YH, Yoshida M, Zhang J, Mahadevan LC, Meyers DJ, Boeke JD, Cole PA. Chembiochem. 2012;13:2113–2121. doi: 10.1002/cbic.201200381. [DOI] [PMC free article] [PubMed] [Google Scholar]
- 38.Carrillo LD, Krishnamoorthy L, Mahal LK. J Am Chem Soc. 2006;128:14768–14769. doi: 10.1021/ja065835+. [DOI] [PubMed] [Google Scholar]
- 39.Carrillo LD, Froemming JA, Mahal LK. J Biol Chem. 2011;286:6650–6658. doi: 10.1074/jbc.M110.191627. [DOI] [PMC free article] [PubMed] [Google Scholar]
- 40.Xu X, Gerard AL, Huang BC, Anderson DC, Payan DG, Luo Y. Nucleic Acids Res. 1998;26:2034–2035. doi: 10.1093/nar/26.8.2034. [DOI] [PMC free article] [PubMed] [Google Scholar]
- 41.Wu X, Simone J, Hewgill D, Siegel R, Lipsky PE, He L. Cytometry A. 2006;69:477–486. doi: 10.1002/cyto.a.20300. [DOI] [PubMed] [Google Scholar]
- 42.Kominami K, Nagai T, Sawasaki T, Tsujimura Y, Yashima K, Sunaga Y, Tsuchimochi M, Nishimura J, Chiba K, Nakabayashi J, Koyamada K, Endo Y, Yokota H, Miyawaki A, Manabe N, Sakamaki K. PLoS One. 2012;7:e50218. doi: 10.1371/journal.pone.0050218. [DOI] [PMC free article] [PubMed] [Google Scholar]
- 43.Ouyang M, Lu S, Li XY, Xu J, Seong J, Giepmans BN, Shyy JY, Weiss SJ, Wang Y. J Biol Chem. 2008;283:17740–17748. doi: 10.1074/jbc.M709872200. [DOI] [PMC free article] [PubMed] [Google Scholar]
- 44.Ting AY, Kain KH, Klemke RL, Tsien RY. Proc Natl Acad Sci U S A. 2001;98:15003–15008. doi: 10.1073/pnas.211564598. [DOI] [PMC free article] [PubMed] [Google Scholar]
- 45.Johnson SA, You Z, Hunter T. DNA Repair (Amst) 2007;6:1277–1284. doi: 10.1016/j.dnarep.2007.02.025. [DOI] [PubMed] [Google Scholar]
- 46.Fuller BG, Lampson MA, Foley EA, Rosasco-Nitcher S, Le KV, Tobelmann P, Brautigan DL, Stukenberg PT, Kapoor TM. Nature. 2008;453:1132–1136. doi: 10.1038/nature06923. [DOI] [PMC free article] [PubMed] [Google Scholar]
- 47.Newman RH, Zhang J. Mol Biosyst. 2008;4:496–501. doi: 10.1039/b720034j. [DOI] [PubMed] [Google Scholar]
- 48.Gavet O, Pines J. Dev Cell. 2010;18:533–543. doi: 10.1016/j.devcel.2010.02.013. [DOI] [PMC free article] [PubMed] [Google Scholar]
- 49.Itoh RE, Kurokawa K, Fujioka A, Sharma A, Mayer BJ, Matsuda M. Exp Cell Res. 2005;307:142–152. doi: 10.1016/j.yexcr.2005.02.026. [DOI] [PubMed] [Google Scholar]
- 50.Nakajima T, Sato M, Akaza N, Umezawa Y. ACS Chem Biol. 2008;3:352–358. doi: 10.1021/cb800052v. [DOI] [PubMed] [Google Scholar]
- 51.Harvey CD, Ehrhardt AG, Cellurale C, Zhong H, Yasuda R, Davis RJ, Svoboda K. Proc Natl Acad Sci U S A. 2008;105:19264–19269. doi: 10.1073/pnas.0804598105. [DOI] [PMC free article] [PubMed] [Google Scholar]
- 52.Sato M, Kawai Y, Umezawa Y. Anal Chem. 2007;79:2570–2575. doi: 10.1021/ac062171d. [DOI] [PubMed] [Google Scholar]
- 53.Lin CW, Ting AY. Angew Chem Int Ed Engl. 2004;43:2940–2943. doi: 10.1002/anie.200353375. [DOI] [PubMed] [Google Scholar]
- 54.Sato M, Umezawa Y. Methods. 2004;32:451–455. doi: 10.1016/j.ymeth.2003.10.013. [DOI] [PubMed] [Google Scholar]
- 55.Kawai Y, Sato M, Umezawa Y. Anal Chem. 2004;76:6144–6149. doi: 10.1021/ac040037s. [DOI] [PubMed] [Google Scholar]
- 56.Fosbrink M, Aye-Han NN, Cheong R, Levchenko A, Zhang J. Proc Natl Acad Sci U S A. 2010;107:5459–5464. doi: 10.1073/pnas.0909671107. [DOI] [PMC free article] [PubMed] [Google Scholar]
- 57.Kunkel MT, Ni Q, Tsien RY, Zhang J, Newton AC. J Biol Chem. 2005;280:5581–5587. doi: 10.1074/jbc.M411534200. [DOI] [PMC free article] [PubMed] [Google Scholar]
- 58.Gao X, Zhang J. Mol Biol Cell. 2008;19:4366–4373. doi: 10.1091/mbc.E08-05-0449. [DOI] [PMC free article] [PubMed] [Google Scholar]
- 59.Kunkel MT, Toker A, Tsien RY, Newton AC. J Biol Chem. 2007;282:6733–6742. doi: 10.1074/jbc.M608086200. [DOI] [PMC free article] [PubMed] [Google Scholar]
- 60.Kurokawa K, Mochizuki N, Ohba Y, Mizuno H, Miyawaki A, Matsuda M. J Biol Chem. 2001;276:31305–31310. doi: 10.1074/jbc.M104341200. [DOI] [PubMed] [Google Scholar]
- 61.Wang Y, Botvinick EL, Zhao Y, Berns MW, Usami S, Tsien RY, Chien S. Nature. 2005;434:1040–1045. doi: 10.1038/nature03469. [DOI] [PubMed] [Google Scholar]
- 62.Hamer G, Matilainen O, Holmberg CI. Nat Methods. 2010;7:473–478. doi: 10.1038/nmeth.1460. [DOI] [PubMed] [Google Scholar]
- 63.Depry C, Mehta S, Zhang J. Pflugers Arch. 2012 doi: 10.1007/s00424-012-1175-y. [DOI] [PMC free article] [PubMed] [Google Scholar]
- 64.Choi Y, Kim K, Hong S, Kim H, Kwon YJ, Song R. Bioconjug Chem. 2011;22:1576–1586. doi: 10.1021/bc200126k. [DOI] [PubMed] [Google Scholar]
- 65.Allen MD, DiPilato LM, Rahdar M, Ren YR, Chong C, Liu JO, Zhang J. ACS Chem Biol. 2006;1:371–376. doi: 10.1021/cb600202f. [DOI] [PubMed] [Google Scholar]