

Abstract
1H-magnetic resonance spectroscopy (1H-MRS) and spectral editing methods, such as MEGA-PRESS, allow researchers to investigate metabolite and neurotransmitter concentrations in-vivo. Here we address the utilization of 1H-MRS for the investigation of GABA concentrations in the ASD brain, in three locations; motor, visual and auditory areas.
An initial repeatability study (5 subjects, 5 repeated measures separated by ~ 5 days on average) indicated no significant effect of reference metabolite choice on GABA quantitation (p > 0.6). Coefficients of variation for GABA+/NAA, GABA+/Cr and GABA+/Glx were all of the order of 9–11%. Based on these findings, we investigated creatine-normalized GABA+ ratios (GABA+/Cr) in a group of (n=17) children with autism spectrum disorder (ASD) and (n=17) typically developing children (TD) for Motor, Auditory and Visual regions of interest (ROIs).
Linear regression analysis of grey matter (GM) volume changes (known to occur with development) revealed a significant decrease of GM volume with Age for Motor (F(1,30)=17.92; p<0.001) and Visual F(1,16)=14.41; p<0.005 but not the Auditory ROI(p=0.55). Inspection of GABA+/Cr changes with Age revealed a marginally significant change for the Motor ROI only (F(1,30)=4.11; p=0.054). Subsequent analyses was thus conducted for each ROI separately using Age and GM volume as covariates.
No group differences in GABA+/Cr were observed for the Visual ROI between TD vs. ASD children. However, the Motor and Auditory ROI showed significantly reduced GABA+/Cr in ASD (Motor p<0.05; Auditory p<0.01). The mean deficiency in GABA+/Cr from the Motor ROI was approximately 11% and Auditory ROI was approximately 22%. Our novel findings support the model of regional differences in GABA+/Cr in the ASD brain, primarily in Auditory and to a lesser extent Motor but not Visual areas.
Keywords: Autism Spectrum Disorder, ASD, MRS, Spectroscopy, MEGA-PRESS, y-aminobutyric acid, GABA
Introduction
Autism spectrum disorder (ASD) is a neurodevelopmental disorder characterized by persistent deficits in social communication and restricted, repetitive patterns of behavior, interests, and activities (American Psychiatric Association (APA) (APA, 1994, 2000), DSM5 http://www.dsm5.org/). These clinical signs of ASD are known to emerge concurrently with a period of abnormal brain and head “overgrowth” occurring within approximately the first year of life (between 9 and 18 months of age) and which plateaus into adulthood (Courchesne et al., 2003; Hazlett et al., 2011; Redcay and Courchesne, 2005). By early childhood (~4 years) the ASD brain is thought to demonstrate overgrowth in a variety of brain regions including frontal and temporal grey and white matter as well as the amygdala and cerebellar white matter (Courchesne et al., 2005). Numerous functional neuroimaging studies have also reported dysfunction from these brain regions (Dapretto et al., 2006; Gervais et al., 2004; Roberts et al., 2011; Roberts et al., 2010; Schmitz et al., 2006; Toal et al., 2010).
Evidence for neurochemical abnormalities in ASD is also beginning to emerge. 1H-magnetic resonance spectroscopy (1H-MRS) is a non-invasive neuroimaging technique that estimates the concentration of specific chemical metabolites and neurotransmitters in vivo (Jansen et al., 2006; Rudin, 1992). By placing volume elements (MRS voxels) at specific regions of interest (ROI), metabolite concentrations can be estimated for specific spectral resonances such as N-acetylaspartate (NAA; a marker of viable neurons (Groenendaal et al., 1994; Urenjak et al., 1992, 1993)), glutamate and glutamine (together referred to as Glx; involved in the maintenance and promotion of cell function (Newsholme et al., 2003)), choline containing compounds (Cho; a marker primarily of cell membrane constituents (Behar et al., 1983; Bottomley et al., 1985; Gadian et al., 1986)); and creatine and phosphocreatine (Cr; a marker of cellular energy metabolism (Bottomley et al., 1985; Prichard and Shulman, 1986; Urenjak et al., 1993)). A recent meta-analysis of conventional 1H-MRS studies in ASD children and adults has reported significantly lower NAA levels in numerous brain regions including frontal, parietal, temporal lobes, amygdala-hippocampus complex (AHC) and thalamus in children, however, no metabolite differences remain in adulthood. Meta-regression analysis showed that the effect size of lower NAA levels declined linearly with age from childhood to adulthood in people with ASD, most prominently from frontal brain areas (Aoki et al., 2012). Thus, the authors concluded that the association between larger-than-normal brain size and lower-than-normal NAA levels in ASD children may be suggestive of an early transient brain expansion caused by an increase in non-neuronal tissue such as disproportionate glial cell proliferation (Aoki et al., 2012).
The cortical neurons of the brain are comprised of two main classes of neurotransmitters: excitatory (mainly involving the excitatory neurotransmitter glutamate, and inhibitory (mainly involving the inhibitory neurotransmitter y-aminobutyric acid (GABA)). Further, these neurotransmitters regulate the generation of temporal synchrony and oscillatory behavior among networks of pyramidal neurons and it is this neural synchrony (typically in gamma (30 – 80 Hz) frequency bands) that is consistently associated with higher-order cognitive processes such as short-term memory formation and perceptual integration (Bertrand and Tallon-Baudry, 2000; Fries, 2005, 2009; Fries et al., 2007; Tallon-Baudry and Bertrand, 1999; Tallon-Baudry et al., 1999). Numerous post-mortem studies and animal models strongly suggest GABAergic system dysfunction in ASD (see Pizzarelli and Cherubini, 2011 for a review (Pizzarelli and Cherubini, 2011)). GABA-synthesizing enzymes GAD65 and GAD67 are significantly reduced (~50%) in the parietal cortex and cerebellum (Fatemi et al., 2002; Yip et al., 2007), and multiple studies have also found both GABA-A and GABA-B receptor alterations in ASD brains (Collins et al., 2006; Fatemi et al., 2009; Oblak et al., 2010, 2011). In addition, it is estimated that 30% of ASD patients also have epilepsy (also putatively reflecting an imbalance of excitation and inhibition), and subclinical epileptiform activity recorded on scalp EEG may occur in up to 85% of ASD children (Gillberg and Billstedt, 2000; Yasuhara, 2010). Thus it has been proposed that ASD may be characterized by an imbalance of excitation to inhibition ratio, possibly reflected in GABA and Glutamate (Rubenstein and Merzenich, 2003).
Direct (in vivo) evidence for GABA dysregulation in ASD has posed a technical challenge due to the spectral overlap of GABA resonances with other metabolites (such as Cr at 3.0 ppm) which exist in much greater concentrations. However, spectral editing methods such as the MEGA-PRESS technique (Mescher et al., 1998) allow for the separation of GABA from Cr relying on the subtraction of two spectra with different evolution of the J-coupled resonances of GABA. Intrinsic factors (such as gender) that may affect the reproducibility of these measures (when holding MRS voxel position constant over repeated measures) has only recently been evaluated (O’Gorman et al., 2011). Practical issues such as the possible influence of inevitable subject-to-subject variations in voxel placement, and thus the inclusion of varying amounts of grey and white matter volumes on GABA quantitation have yet to be explored. Moreover, absolute measurement of these neurotransmitter concentrations is not generally straightforward, and thus metabolite ratios (i.e. GABA/NAA, GABA/Cr, GABA/Glx) have all been proposed (Gaetz et al., 2011; Harada et al., 2010; O’Gorman et al.; Yoon et al., 2010). However, the most stable denominator for normalized GABA measures remains an active area of investigation, as does the specific method of spectral quantification (i.e. curve estimation, specifically time-domain vs. frequency domain fitting) (O’Gorman et al., 2011). Presently, a single report has been published using MEGA-PRESS to measure GABA in ASD children (Harada et al., 2010). Harada et al., (2010) estimated GABA spectra from two separate voxels (3×3×3 cm3) placed at basal ganglia and frontal lobe locations, and observed the ratio of both GABA/NAA and GABA/Glu were significantly lower in frontal lobe voxels only in a population of children with ASD (2–11 yrs of age). This study has yet to be replicated, and it remains unclear whether GABA downregulation observed from one brain area predicts downregulation in other cortical areas. Thus, the purpose of the current study was twofold:
In Experiment 1, we conducted a multi-region survey, motivated by findings from Harada et al., (2010) to first quantify the repeatability of GABA concentration measures derived from MEGA-PRESS in a healthy adult population. Voxel locations were placed at three separate brain regions (Motor; posterior frontal lobe, Auditory; superior temporal lobe and Visual; mid-posterior occipital lobe) over five repeated measures, to determine the optimal denominator as the most repeatable between-session (i.e. minimum variance) metric for GABA quantification.
In Experiment 2 we utilize this metric to investigate multi-region GABA measures in a group of 17 ASD children and 17 typically developing children to confirm whether GABA measures are decreased at posterior frontal lobe (i.e. Motor) locations in ASD children and to determine whether any observed decreases in GABA are generally observed throughout the brain in ASD or are regionally specific.
Methods
Experiment 1: 5×5 Repeatability Study Participants and Study Details
GABA MRS regions of interest (ROIs) for Motor, Visual and Auditory areas were collected from 5 adult male subjects (35.3 yrs ± 9.1 (mean, S.D.) on 5 separate days. The purpose of these measures was to identify the most repeatable between-session metric for GABA quantification, as evidenced by low coefficient of variation (CVs) across sessions. In order to minimize the uncontrolled influence of diet on the recorded MRS brain metabolite concentrations, care was taken to schedule scans at generally the same time of day. The average time of day for the 5×5 repeatability study was 10:50 am ± 0:52 minutes (mean, S.D.). The average inter-day MRS scan interval for all 5 subjects over all repeated sessions was 5.5 ± 7.1 days (mean, S.D). For one participant, only Motor and Visual data was collected. For another participant, technical (scanner) failure limited the final data acquisition to the Motor voxel only.
Experiment 2: MRS Spectroscopy in Typically Developing (TD) Children and Children with ASD Participants
ASD and TD control participants (total N=34) were recruited for a longitudinal study on auditory processing in children with ASD (NLMFF; TR (PI)). Full diagnostic inclusion/exclusion criteria are provided in Roberts et al. (2010) (Roberts et al., 2010). In brief, the ASD diagnosis was confirmed with standard diagnostic tools, including direct observation with the Autism Diagnostic Observation Schedule (ADOS; Lord et al., 2000) and Parent report on the Social Communication Questionnaire (SCQ; Rutter, Bailey, & Lloyd, 2003). The Autism Diagnostic Interview-Revised [ADI-R; Lord, Rutter, LeCouteur, 1994] was also administered in instances where additional diagnostic clarification was needed (e.g., when ADOS positive but parent screening questionnaires negative); two additional children were included via this methodology. Dimensional symptom severity ratings were also obtained by parent report on the Social Responsiveness Scale (SRS; Constantino & Gruber, 2005). Children who no longer met diagnostic criteria at the time of longitudinal follow-up were excluded from current analyses.
Cognitive and language abilities of the ASD sample were further characterized using the Wechsler Intelligence Scale for Children-4th Edition (WISC-IV) and the Clinical Evaluation of Language Fundamentals-4th Edition (CELF-4).
In addition to the above inclusion/exclusion criteria, all subjects and families were native English speakers and had no known genetic syndromes or neurological (e.g., cerebral palsy, epilepsy), or sensory (hearing, visual) or motor impairments. The study was approved by the CHOP Institutional Review Board and all participants’ families gave written informed consent. As indicated by institutional policy, where competent to do so, children over the age of seven additionally gave assent.
The total set of MRI specific measures (in addition to MRS) on these participants was considerable (total MRI time 1.0 to 1.5 hrs). Thus ASD and TD participants were not typically expected to complete all MRS acquisitions. Given our motive to attempt to confirm GABA downregulation from frontal lobe ROIs in ASD, our approach was to start (in a non-counterbalanced fashion) with the Motor MRS voxel, and proceed to the Visual or Auditory voxel depending on participant compliance and balancing auditory and visual collections. Thus, GABA MRS voxels for (at least one of) three ROIs (Motor, Visual and Auditory) were collected from 17 children (1 Females) with ASD (11.5 ± 2.7 years (mean, S.D.). MRS voxel measures were taken from Motor: n=17, Auditory: n=15, Visual: n=8. Post-processing quality assurance (QA) was conducted to exclude data with inadequate shimming, excessive levels of subject motion or excessive lipid contamination which can compromise MR spectroscopic data. QA procedures resulted in the elimination of 2 Auditory MRS datasets. TD control data was collected from 17 TD children (6 Female) (13.3 ± 2.87 years (mean, S.D.). Post-processing QA eliminated 2 Motor data sets due to poor signal quality. Given that the gender and age distributions are different per ROI, we summarize the age and gender distributions for ASD ROIs as follows: Motor (N=17, mean age=11.5 years, Females=1); Visual (N=8, mean age=13.0 years, Females=0); Auditory (N=13, mean age =12.2 years, Females=1). The age and gender distributions for each TD ROI are as follows: Motor (N=15, mean age=12.7 years, Females=6); Visual (N=10, mean age=13.3 years, Females=5); Auditory (N=11, mean age =11.1 years, Females=4).
All participants in the TD group were medication free at the time of the MRI scan. For the ASD group, thirteen ASD subjects were unmedicated with the remaining 4 comprised of 2 taking selective serotonin reuptake inhibitors (SSRIs), 1 participants taking medication to treat mood disorder and 1 taking atypical antipsychotic medication.
General Methods (Applicable to both Experiments)
Structural MRI and MRS Methods
MRI data were acquired on a 3T Siemens Verio™ scanner using a 32-channel receive only head RF coil. For each participant, a 3D MP-RAGE anatomic scan was obtained in an axial orientation, with field of view=256×256×192mm and matrix=256×256×192 to yield 1 mm isotropic voxel resolution (TR/TE=1900/2.87 ms; Inversion time=1100 ms; Flip angle=9°). Single voxel GABA MRS was obtained using the MEGA-PRESS spectral editing sequence (Mescher et al., 1998), with TE=68 ms, T=1500ms and 128 pairs of interleaved spectra (acquisition time < 7mins per ROI). Pilot observations indicated that this approach provided a reasonable compromise between SNR (which increases with the number of transients acquired) vs. exposure to degradation due to motion (which is increased with longer scan times).
MRS Voxel Placement for 3 ROIs
Motor ROI (3×3×3 cm3): Although motivated by Harada et al., (2010) we were also interested in assessing regional specificity of GABA levels as well as inter-subject ROI placement replicability, which is improved if clear anatomic landmarks can be identified. Thus, for the current study, the motor ROI voxel was positioned based on anatomic landmarks. The Motor ROI was positioned to include the “hand-knob” of the left central sulcus (Yousry et al., 1997). The posterior margin of the voxel was then adjusted to minimize contributions from somatosensory areas. In the coronal plane, ROI voxels were then rotated to best match adjacent scalp surface (avoiding CSF/bone/fat contamination). Given that the current motor-anatomy-constrained approach and the Harada et al.’s, (2010) methods both use a 3×3×3 cm3 MRS voxel which samples left hemisphere frontal lobe structures, we anticipate considerable (but not perfect) overlap between these studies.
Auditory ROI (4×3×2 cm3): The auditory ROI voxel is first aligned to the left mid-temporal lobe with the long aspect of the cuboid aligned such that the top of the voxel contains the superior temporal gyrus. Medial-lateral adjustments are then made to abut (but not include) the left lateral ventricle.
Visual ROI (3×3×3 cm3): The visual ROI voxel was positioned based on anatomic considerations following previously published methods (Muthukumaraswamy et al., 2009). The ROI was positioned medially in the occipital lobe, the lower plane aligned with the cerebellar tentorium and positioned so as to avoid including the sagittal sinus and to remain within the occipital lobe.
MRS Analysis and Quantification
GABA measurement using the MEGA-PRESS sequence are known to contain some contribution from co-edited macromolecules. Thus, our GABA plus macromolecule measurements are reported using GABA+ notation. Post-processing of all 1H MR spectroscopic data spectral signals was carried out in the time domain using a non-linear least squares fitting algorithm (AMARES- jMRUI (Vanhamme et al., 1997, Naressi et al., 2001)). GABA+ quantitation was conducted following previously published methods (Donahue et al., 2010). A 5 Hz Lorenzian line-broadening filter was applied prior to jMRUI fitting. Prior knowledge on the spectral parameters were used to increase convergence rates and overall accuracy, i.e., NAA was modeled as a single inverted Lorenzian peak (phase =180°), and GABA+ was modeled as a pair of Lorentzian peaks (phase=0°) of fixed spectral separation. Creatine was modeled in both unsubtracted spectra and an average value derived.
Quantifying Tissue Composition
The tissue composition of each MRS voxel was computed using an automated tissue segmentation tool, FAST (Zhang et al., 2001), to segment each subject’s structural MP-RAGE scan into grey matter, white matter and cerebrospinal fluid. This process yielded three partial volume images describing the fraction of each tissue type present in the imaging voxels. The grey and white matter fractions for each of the MRS voxels was then computed by summing their respective number of imaging voxels located within the MRS voxel.
Evaluating the MRS Voxel overlap
Repeatability of the MRS voxel placement was evaluated by first aligning the MRS voxels into a common spatial domain and investigating the spatial overlap of registered MRS voxels. For each subject acquisition an affine transformation was computed, using FLIRT (Jenkinson and Smith, 2001), between the structural MPRAGE and a template structural image. For evaluating individual subjects in the 5×5 study the first time point was chosen to act as a template, where as the MNI 152 template (Mazziotta et al., 2001) was chosen for the population study. The resultant affine transform was then applied to masks representing the interior of each MRS voxel generating registered masks for each MRS voxel of each subject. These images were then averaged generating an overlap image where each voxel indicated the likelihood that it was within the MRS voxel. A representative overlap image from the 5×5 study can be seen in Figure 1.
Figure 1.

Spatial overlap of the MRS voxel locations, each acquired during separate scanning sessions, for a representative subject of the repeatability study. The large spatial overlap illustrates the high degree of repeatability of the MRS voxel placement procedures.
Statistical Analysis
Experiment 1
The between-session reproducibility for each ROI was calculated for GABA+/Cr, GABA+/NAA, and GABA+/Glx. The average coefficient of variation (CV; Standard Deviation/Mean) was calculated for each metabolite ratio and each ROI.
The slight difference in ROI placement across sessions leads to a differing proportion of grey matter within the MRS voxel. The potential impact of this was assessed using regression analysis between GABA+/Cr and GM volume, pooling data across all measures and subjects for each ROI. The proportion of GABA+/Cr variance accounted for by the variation in GM volume was interpreted from the R2 value of this regression analysis.
Experiment 2
Based on the results of Experiment 1 and the stated concerns regarding the potential for ASD specific Group differences in NAA, we restricted our analysis to the dependent variable GABA+/Cr.
Given anticipated Grey Matter changes which are known to be associated with development, we conducted separate regression analysis of GM volume and GABA+/Cr with Age within ROIs and between diagnostic group (TD vs. ASD). To evaluate effects of Diagnostic Group on GABA+/Cr we performed ROI specific univariate ANOVA including Age and GM as covariates.
Results
Experiment 1
MRS 5×5 Metabolite Reproducibility
The purpose of the 5×5 experiment was to determine the optimal denominator as the most repeatable between-session metric for GABA+ quantification. Coefficients of variation for GABA+/Cr, GABA+/NAA and GABA+/Glx are of the order of 9–11% (see table. 1) and results from ANOVA indicate no significant main effect of metabolite denominator choice (p > 0.6) and no significant interaction between ROI and metabolite denominator choice on coefficient of variation values (p > 0.4). GABA+/Glx ratios tend to be slightly less reproducible across sessions.
Furthermore, despite the careful attempt to place ROIs in similar positions, small variations in position necessarily occur (see Figure 1). Consequently, the proportion of grey matter in the voxel varies slightly from one session to another. Regression analysis shows that the proportion of the variance in the GABA+/Cr estimate accounted for by GM volume fraction was less than 8% for the motor ROI, less than 1% for the visual ROI and less than 7% for the auditory ROI, suggesting that normalizing the GABA+/Cr ratio further (i.e. dividing by grey matter volume) in this adult population would not significantly improve reproducibility.
Experiment 2
Clinical Measure
The sample of children with ASD was primarily high functioning. 88% (15 of 17) had IQ scores in the Average range or higher. 35% (6 of 17) had at least mild language impairments (CELF Core Language Score ≤ 85).
GABA+ measures from Motor, Auditory and Visual MRS Voxels in TD and ASD
ROI volumes were first assessed for group differences in GM using independent t-tests. There were no apriori differences in GM volume, white matter volume or CSF between groups. Given the concern regarding the effect of maturational factors biasing our spectroscopy measures, we then evaluated relations between GM or GABA+/Cr were predicted by Age. Linear regression analysis of grey matter (GM) volume revealed a significant decrease of GM with increasing Age for the Motor ROI (F(1,30)=17.92; p<0.001) and the Visual (F(1,16)=14.41; p<0.005) but not the Auditory ROI (p=0.55). Linear regression analysis of GABA+/Cr with Age revealed a marginally significant positive relation for the Motor ROI only (F(1,30)=4.02; p=0.054).
Due to the observed ROI specific pattern of maturation on GABA+/Cr and GM measures we performed GLM’s independently for each ROI, using Age and GM as covariates. We observed no significant difference in GABA+/Cr between groups for the Visual ROI. However, a significant group difference for the Motor ROI (F(1,28)=4.44; p<0.05) was observed. Mean and standard error of GABA+/Cr were: TD 0.35 (± 0.012) vs. ASD 0.31 (±0.011). Finally, a significant group difference was observed for the Auditory ROI (F(1,20)=13.07; p<0.01(corrected)). Mean values of GABA+/Cr were: TD 0.37 (± 0.016) vs. ASD 0.29 (± 0.011) (See Figure 2).
Figure 2.
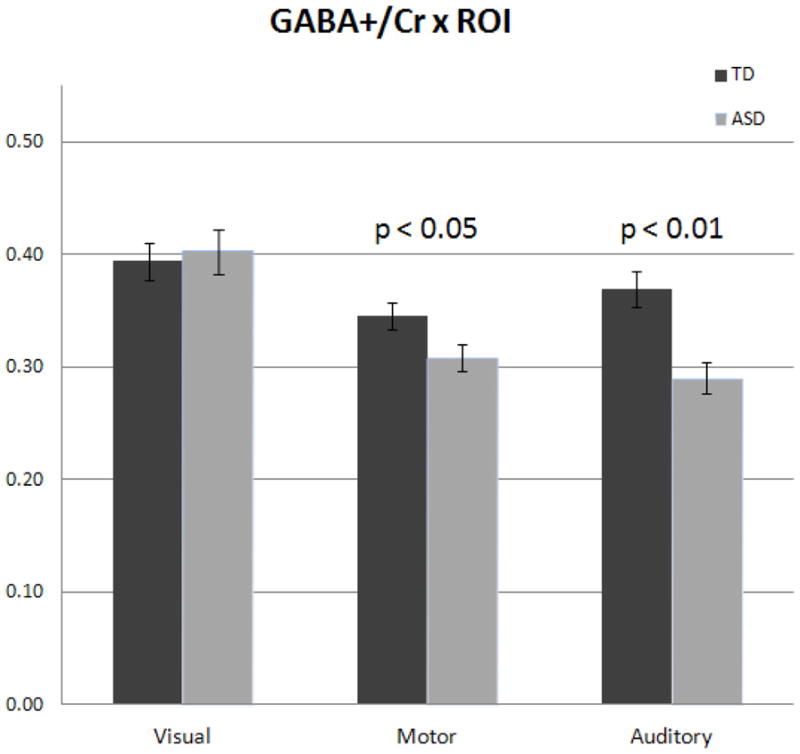
Population analysis of GABA+/Cr ratios in ASD. A) The age and GM covaried ratio of GABA+ to Cr was investigated in each of the three MRS voxels. Population level decreases were not observed for the Visual ROI. Motor ROI GABA+/Cr was significantly reduced in ASD (p<0.05), as well as Auditory ROI (p < 0.01 corrected).
The mean deficiency in GABA+/Cr from the Motor ROI was approximately 11% and Auditory ROI was approximately 22%. Figure 3 shows reproducibility of the individual spectra from Auditory ROI for all ASD and TD participants.
Figure 3.

To demonstrate generalized robustness, stacked MEGA-PRESS spectra are shown for all Auditory ROI measures (N=13 ASD, N=11 TD). The GABA peak at 3 ppm is indicated in grey. The approximate location and regional overlap for Auditory ROI placement is shown in Figure 4.
To further detail this finding and the influence of GM on this group difference, the spatial overlap of Auditory ROIs reported in the study was plotted in Figure 4, including the distribution of group GABA+/Cr in relation to GM (See Figure 4). Unlike Motor and Visual measures, Auditory GM volume did not change significantly with Age in our study population. Thus, it is unlikely that GM volume differences underlie the observed decrease in Auditory GABA (see Figure. 4).
Figure 4.

Relationship between GABA+/Cr ratio and grey matter volume. A) The spatial overlap of the auditory MRS voxel generated from the combined TD and ASD subjects is shown. B) No correlation between Age corrected auditory GABA+/Cr and the volume of grey matter within the auditory MRS voxel was found for either the TD (R2 = 0.04) or the ASD (R2 = 0.09) subjects. The high degree of spatial overlap and low correlation between GM volume and GABA+/Cr suggest that the small variations in voxel placement and individual anatomy do not affect the GABA+/Cr levels. Importantly, Auditory GABA+/Cr estimates alone may offer partial discriminatory resolution of ASD from TD.
Sensory and Motor Constituents of the “Motor” ROI
The present experiment was in part motivated to confirm whether posterior frontal lobe GABA measures are downregulated in ASD. However, for the purpose of replicability in voxel placement, all MRS Voxels in the current study were positioned using anatomical landmarks. Our Motor ROI were based on two constraints: 1. The Motor voxel captured the entire motor hand knob (observed in the axial plane), and 2. The Motor voxel was then adjusted to minimize the contributions from somatosensory cortex. Our significant finding of decreased GABA+/Cr from these ASD Motor areas raises the issue of exactly how much non-motor (ie. somatosensory cortex) contributes to our “Motor” voxel measures. Thus, post-hoc volumetric analysis was thus conducted to directly estimate the brain constituents of the Motor ROI voxel. Each Motor MRS voxel was affinely transformed into the MNI standard space as described in the Methods section. The Harvard-Oxford cortical atlas was then used to identify the proportional overlap of each subject’s MRS voxel with their pre and postcentral gyri. An analysis of these overlaps indicate that on average 48% ± 13% of the Motor MRS voxel was comprised of the precentral gyrus, with an additional ~20% ± 13% comprised of frontal lobe structures such as the superior and middle frontal gyrus, cingulate gyrus and supplementary motor cortex (SMA). The postcentral gyrus accounting for 26% ± 10% of the voxel, with an additional ~3% ±7% estimated to stem from the superior parietal lobe. Thus, the measured spectra from our Motor MRS voxel is estimated to be comprised of ~70% posterior frontal lobe structures.
Does Creatine (Cr) Also Differ Between Groups?
The current observations of the existence of group differences in GABA+/Cr in ASD and TD depends critically on the assumption that there are no pre-existing differences in Cr between groups. While generally thought to be stable across clinical conditions (Soares and Law, 2009), Cr has been reported in some studies to be altered in ASD (Levitt et al., 2003; Page et al., 2006). To directly test the concern that group differences in GABA+/Cr were due to differences in Cr rather than GABA+ we conducted a post-hoc analysis from a subset of ASD and TD participants who also had water reference spectra collected from the same auditory ROIs. Available data from 5 TD and 6 ASD participants was assessed for Cr/H20 group differences.
Group effects were tested using hierarchical regression performed on Cr/H2O values after removing variance associated with Age and GM volume. The p value associated with the resultant linear model was not significant (F(1,7)=0.11; p=0.75). For this same subset of participants, Group effects were tested using hierarchical regression performed on GABA+/Cr values after removing variance associated with Age and GM Volume. The p value associated with the resultant linear relation was significant (F(1,7)=7.95; p<0.05), even in this smaller subset, supporting the idea that (for these participants) there is a decrease in GABA+ driving the reported difference in GABA+/Cr between groups in our study.
GABA+/Cr and Clinical Measures
Correlation of auditory cortex GABA+/Cr after covarying age and GM volume with the core language index on the CELF-4 revealed a non-significant trend (p=0.14) suggesting that increased GABA was associated with better language ability. Similarly correlation of auditory cortex GABA+/Cr after covarying age and GM volume with the SRS raw score revealed a non-significant trend (p=0.13) suggesting that decreased GABA was associated with increased SRS scores (more autistic phenotype).
Correlation of Auditory GABA+/Cr after covarying age and GM volume with GAI (a measure of IQ) was not significant (p=0.61). Similar analyses of the Motor GABA+/Cr levels revealed no such trends (correlation with CELF: p=0.57, with SRS: p=0.56, with GAI: p=0.68). Similar analyses of the Visual GABA/Cr levels revealed no such trends (correlation with CELF: p=0.65, with SRS: p=0.99, with GAI: p=0.38).
Discussion
In Experiment 1 we sought to determine the most repeatable between-session (i.e. minimum variance) metric for GABA+ quantification. In our healthy male adult population we observed no significant difference in between session repeatability using either Cr, NAA, or Glx references for GABA+ quantitation. The Glx reference may be less desirable given its relatively low SNR, and consequent high variance estimation. Given our secondary aim to apply these methods to clinical populations such as children with ASD, we chose to adopt the Cr reference since NAA may be variable in development and in developmental disorders (an issue less likely to reveal itself in an adult reproducibility study). Additionally as has been shown by Aoki et al., (2012), it may be expected that there would be group differences in NAA between TD and ASD.
In addition, we observed that when using Cr normalization, ROI placement on repeated measures using anatomical landmarks does not change the constituent GM volumes sufficiently to account for significant variance in the GABA+/Cr ratio. The absence of an effect is likely due to the narrow range of GM volume values compared with the noise in the measurement as has been shown previously (e.g., Choi et al., 2007; Geramita et al., 2011). Thus whereas standardization of the MRS voxel location in the brain is generally desirable to associate MRS measures with brain regions and ideally clinical measures, the subtle differences in grey matter volume due to MRS voxel placement - and/or the expected individual differences between patients (where head size and neuroanatomy is not identical) is not expected to result in a systematic bias on measured GABA+/Cr concentrations.
In Experiment 2 we made several novel observations: GABA+/Cr was significantly reduced in Motor and Auditory areas, and not significantly different in Visual areas in ASD children. The current study supports Harada et al.’s (2010) observation of decreased GABA+ levels (both GABA+/NAA and GABA+/Glu) in ASD measured from frontal lobe MRS voxels. Whereas both studies used a 3 × 3 × 3 cm3 voxel and used MEGA-PRESS to quantify GABA+, Harada et al., (2010) described a “frontal lobe” MRS voxel placement - anterior to the motor location used in this current study, and does not appear to include contributions from somatosensory cortex. Our general agreement with Harada (reduced GABA in ASD) in this region suggests adequate support for frontal lobe downregulation of GABA+/NAA in ASD. While it remains unclear how frontal lobe or motor specific GABA downregulation could manifest behaviorally, it is interesting to note that clear motor signs (both fine and gross motor deficits) have been consistently reported in children with ASD (see Gowen and Hamilton, (2012) for a review).
Independent observations of decreased GABA+/Cr in ASD children and their first degree relatives has also recently been described. A very recent study from Rojas et al., (2013) reported GABA+/Cr downregulation observed in ASD children and their first degree relatives compared with TD. The reported decrease in GABA+/Cr was approximately 25% for both ASD children and their first degree relatives compared to age-matched controls (Rojas et al., (2013). Our observation of a ~22% decrease of GABA+/Cr from the Auditory ROI in ASD are consistent with these findings. Clear differences in auditory functional measures such as delayed M100 responses (Roberts et al., 2010), auditory mis-match field latency (Roberts et al., 2011) as well as decreased auditory gamma-band responses (Gandal et al., 2010; Rojas et al., 2012) might be the result of regional misregulation in neurotransmitters like GABA or Glutamate in auditory areas.
Effect of Age and Gender on GABA+ Quantitation
We observed a marginally significant GABA+/Cr increase with age for the Motor ROI only. In adult populations, Puts et al., (2012) measured GABA+ ROIs from visual and somatosensory cortex, and reported no significant correlation between GABA+ concentration and age, when quantifying by normalization to the unsuppressed water signal (Puts et al., 2011). Similar measures from broad age ranges (and common ROI voxel placement) might further detail the influence of development on somatosensory and motor GABA+/Cr measures and associated behavioral correlates.
Age-specific changes in total creatine have been reported previously (O’Gorman et al., 2011). However, inspection of H2O normalized Cr showed no group differences in a subset of participants in this study. Our populations were age-matched (p>0.05) and within a narrow range, we considered Cr more favorable than NAA or Glx. These choices, and regional variation in macromolecule content, may in part account for discrepant findings in the literature.
Gender may also be a significant factor in predicting GABA+ levels (Harada et al., 2011; O’Gorman et al., 2011). However, there also appears to be some inconsistency in the literature. For example, Puts el al. (2011) report no significant difference in concentration between male and female participants for either somatomotor or visual regions (p > 0.3 for both regions) (Puts et al., 2011). In our study, sample size was too small to separately investigate the regional variation of gender-based differences. This is an important factor to be considered in future larger-scale studies.
Limitations of MEGA-PRESS measurements of GABA+
We acknowledge the general limitation of spectral quantitation using metabolite ratios for the measurement of group level differences in brain metabolites such as GABA+. Our approach was to simply identify a metabolite from those available which had good reproducibility and was not likely different between TD and ASD groups. As has been discussed in the literature (e.g. Aoki et al., 2012), there may well also be group differences in NAA/Cr in ASD. GLM analysis of NAA/Cr (covarying Age and GM volume) did not resolve group differences in Motor or Visual ROIs in our study (motor p=0.564, visual p=0.422). However ANOVA of NAA/Cr for the Auditory ROI was significantly different (TD: mean 1.42 vs ASD mean 1.24, p<0.05). This observation contributes to the caution that NAA is a poor choice as a denominator in a normalized GABA+ ratio when involving ASD populations.
In addition, the MRS voxel used is relatively large (3 × 3 × 3 cm3) which improves SNR at the cost of regional specificity. By keeping the ROI volume relatively large, we proportionally shorten the scan time which is critically important if we want to measure more than one ROI. This balancing of SNR and regional, or anatomic, specificity (and thus total scan time) is a generic concern especially in pediatric clinical research. Basic research studies using MEGA-PRESS for GABA+ measures have used smaller volumes (for review, see Puts and Edden, 2011) in healthy adult participants, but typically at the expense of longer scan times, or poorer SNR. At 3T, the MEGA-PRESS methodology typically adopted results in significant excitation of co-edited macromolecule signal, and which makes a significant contribution to the edited signal at 3 ppm. Interestingly, new methods for macromolecule suppression are currently being developed which may not only better refine GABA+ quantitation, but have also shown that it may be the co-edited macromolecules included in estimates of the 3ppm resonance (and not GABA+ per se) that drives the age-dependency, although again regional variations may warrant further exploration (Aufhaus et al., 2012).
Conclusion
In conclusion, the main finding of this study is the support for a model of regional differences in GABA+/Cr in the ASD brain, primarily in Motor and Auditory areas. These in vivo observations, as well as data from numerous animal models (see Pizzarelli and Cherubini (2011) for a recent review (Pizzarelli and Cherubini, 2011)) implicate impaired inhibitory neurotransmission as a component of the disorder. Future work needs is needed to further replicate and refine these spatially coarse observations, and explore the degree to which patterns of regional downregulation in neurotransmitters such as GABA predict both domain-specific behavioral and clinical measures of severity on the autism spectrum.
Table 1.
Between-session reproducibility for GABA+/Cr vs. GABA+/NAA vs. GABA+/Glx. Concentration ratios are compared in terms of coefficient of variation (CV). Overall reproducibility (averaging over each ROI) for all metabolite variants is ~10%.
| Motor | Visual | Auditory | Overall | |
|---|---|---|---|---|
| GABA+/Cr | 0.09 | 0.11 | 0.09 | 0.10 |
| GABA+/NAA | 0.07 | 0.06 | 0.14 | 0.09 |
| GABA+/Glx | 0.10 | 0.09 | 0.13 | 0.11 |
| Average | 0.09 | 0.09 | 0.12 | 0.10 |
Highlights.
We observed no effect of reference metabolite (NAA, Cr, Glx) on GABA+ repeatability.
ASD GABA+ was not different from TD in Visual area ROIs.
ASD GABA+ was significantly lower than TD for Motor and Auditory ROIs.
Our findings support the model of regional differences in GABA+/Cr in the ASD brain.
Acknowledgments
This study was supported in part by NIH grant R01DC008871, P30HD026979 (TR) and a grant from the Nancy Lurie Marks Family Foundation (NLMFF). This research has been funded (in part) by a grant from the Pennsylvania Department of Health. The Pennsylvania Department of Health specifically disclaims responsibility for any analyses, interpretations or conclusions. Dr. Roberts gratefully acknowledges the Oberkircher Family for the Oberkircher Family Chair in Pediatric Radiology at Children’s Hospital of Philadelphia.
The authors would like to thank MR Technologists Peter Lam, Jamie Rundio, John Dell III, and Rachel Golembski for MRS data acquisition, and Keith Heberlein at Siemens Medical Solutions for the MEGA-PRESS WIP529.
Footnotes
DISCLAIMER: No author declares a conflict of interest.
Publisher's Disclaimer: This is a PDF file of an unedited manuscript that has been accepted for publication. As a service to our customers we are providing this early version of the manuscript. The manuscript will undergo copyediting, typesetting, and review of the resulting proof before it is published in its final citable form. Please note that during the production process errors may be discovered which could affect the content, and all legal disclaimers that apply to the journal pertain.
References
- Aoki Y, Kasai K, Yamasue H. Age-related change in brain metabolite abnormalities in autism: a meta-analysis of proton magnetic resonance spectroscopy studies. Transl Psychiatry. 2012;2:e69. doi: 10.1038/tp.2011.65. [DOI] [PMC free article] [PubMed] [Google Scholar]
- APA, editor. DSM-IV, Diagnostic and Statistical Manual of Mental Disorders. 4. Washington, DC: 1994. [Google Scholar]
- APA, editor. DSM-IV-TR, Diagnostic and Statistical Manual of Mental Disorders. 4. Washington, DC: 2000. text revision. [Google Scholar]
- Aufhaus E, Weber-Fahr W, Sack M, Tunc-Skarka N, Oberthuer G, Hoerst M, Meyer-Lindenberg A, Boettcher U, Ende G. Absence of changes in GABA concentrations with age and gender in the human anterior cingulate cortex: A MEGA-PRESS study with symmetric editing pulse frequencies for macromolecule suppression. Magn Reson Med. 2012 doi: 10.1002/mrm.24257. [DOI] [PubMed] [Google Scholar]
- Behar KL, den Hollander JA, Stromski ME, Ogino T, Shulman RG, Petroff OA, Prichard JW. High-resolution 1H nuclear magnetic resonance study of cerebral hypoxia in vivo. Proc Natl Acad Sci U S A. 1983;80:4945–4948. doi: 10.1073/pnas.80.16.4945. [DOI] [PMC free article] [PubMed] [Google Scholar]
- Bertrand O, Tallon-Baudry C. Oscillatory gamma activity in humans: a possible role for object representation. Int J Psychophysiol. 2000;38:211–223. doi: 10.1016/s0167-8760(00)00166-5. [DOI] [PubMed] [Google Scholar]
- Bottomley PA, Edelstein WA, Foster TH, Adams WA. In vivo solvent-suppressed localized hydrogen nuclear magnetic resonance spectroscopy: a window to metabolism? Proc Natl Acad Sci U S A. 1985;82:2148–2152. doi: 10.1073/pnas.82.7.2148. [DOI] [PMC free article] [PubMed] [Google Scholar]
- Choi C, Bhardwaj P, Kalra S, Casault C, Yasmin U, Allen P, Coupland N. Measurement of GABA and contaminants in gray and white matter in human brain in vivo. Magnetic Resonance in Medicine. 2007;58(1):27–33. doi: 10.1002/mrm.21275. [DOI] [PubMed] [Google Scholar]
- Collins AL, Ma D, Whitehead PL, Martin ER, Wright HH, Abramson RK, Hussman JP, Haines JL, Cuccaro ML, Gilbert JR, Pericak-Vance MA. Investigation of autism and GABA receptor subunit genes in multiple ethnic groups. Neurogenetics. 2006;7:167–174. doi: 10.1007/s10048-006-0045-1. [DOI] [PMC free article] [PubMed] [Google Scholar]
- Constantino J, Gruber CP. Social Responsiveness Scale. Los Angeles, CA: Western Psychological Services; 2005. [Google Scholar]
- Courchesne E, Carper R, Akshoomoff N. Evidence of brain overgrowth in the first year of life in autism. JAMA. 2003;290:337–344. doi: 10.1001/jama.290.3.337. [DOI] [PubMed] [Google Scholar]
- Courchesne E, Redcay E, Morgan JT, Kennedy DP. Autism at the beginning: microstructural and growth abnormalities underlying the cognitive and behavioral phenotype of autism. Dev Psychopathol. 2005;17:577–597. doi: 10.1017/S0954579405050285. [DOI] [PubMed] [Google Scholar]
- Dapretto M, Davies MS, Pfeifer JH, Scott AA, Sigman M, Bookheimer SY, Iacoboni M. Understanding emotions in others: mirror neuron dysfunction in children with autism spectrum disorders. Nat Neurosci. 2006;9:28–30. doi: 10.1038/nn1611. [DOI] [PMC free article] [PubMed] [Google Scholar]
- Donahue MJ, Near J, Blicher JU, Jezzard P. Baseline GABA concentration and fMRI response. Neuroimage. 2010 Nov 1;53(2):392–8. doi: 10.1016/j.neuroimage.2010.07.017. [DOI] [PubMed] [Google Scholar]
- Fatemi SH, Folsom TD, Reutiman TJ, Thuras PD. Expression of GABA(B) receptors is altered in brains of subjects with autism. Cerebellum. 2009;8:64–69. doi: 10.1007/s12311-008-0075-3. [DOI] [PMC free article] [PubMed] [Google Scholar]
- Fatemi SH, Halt AR, Realmuto G, Earle J, Kist DA, Thuras P, Merz A. Purkinje cell size is reduced in cerebellum of patients with autism. Cell Mol Neurobiol. 2002;22:171–175. doi: 10.1023/A:1019861721160. [DOI] [PMC free article] [PubMed] [Google Scholar]
- Fries P. A mechanism for cognitive dynamics: neuronal communication through neuronal coherence. Trends Cogn Sci. 2005;9:474–480. doi: 10.1016/j.tics.2005.08.011. [DOI] [PubMed] [Google Scholar]
- Fries P. Neuronal gamma-band synchronization as a fundamental process in cortical computation. Annu Rev Neurosci. 2009;32:209–224. doi: 10.1146/annurev.neuro.051508.135603. [DOI] [PubMed] [Google Scholar]
- Fries P, Nikolic D, Singer W. The gamma cycle. Trends Neurosci. 2007;30:309–316. doi: 10.1016/j.tins.2007.05.005. [DOI] [PubMed] [Google Scholar]
- Gadian DG, Proctor E, Williams SR, Cady EB, Gardiner RM. Neurometabolic effects of an inborn error of amino acid metabolism demonstrated in vivo by 1H NMR. Magn Reson Med. 1986;3:150–156. doi: 10.1002/mrm.1910030123. [DOI] [PubMed] [Google Scholar]
- Gaetz W, Edgar JC, Wang DJ, Roberts TP. Relating MEG measured motor cortical oscillations to resting gamma-aminobutyric acid (GABA) concentration. Neuroimage. 2011;55:616–621. doi: 10.1016/j.neuroimage.2010.12.077. [DOI] [PMC free article] [PubMed] [Google Scholar]
- Gandal MJ, Edgar JC, Ehrlichman RS, Mehta M, Roberts TP, Siegel SJ. Validating gamma oscillations and delayed auditory responses as translational biomarkers of autism. Biol Psychiatry. 2010;68:1100–1106. doi: 10.1016/j.biopsych.2010.09.031. [DOI] [PMC free article] [PubMed] [Google Scholar]
- Geramita M, van der Veen JW, Barnett AS, Savostyanova AA, Shen J, Weinberger DR, Marenco S. Reproducibility of prefrontal γ-aminobutyric acid measurements with J-edited spectroscopy. NMR in Biomedicine. 2011;24(9):1089–98. doi: 10.1002/nbm.1662. [DOI] [PubMed] [Google Scholar]
- Gervais H, Belin P, Boddaert N, Leboyer M, Coez A, Sfaello I, Barthelemy C, Brunelle F, Samson Y, Zilbovicius M. Abnormal cortical voice processing in autism. Nat Neurosci. 2004;7:801–802. doi: 10.1038/nn1291. [DOI] [PubMed] [Google Scholar]
- Gillberg C, Billstedt E. Autism and Asperger syndrome: coexistence with other clinical disorders. Acta Psychiatr Scand. 2000;102:321–330. doi: 10.1034/j.1600-0447.2000.102005321.x. [DOI] [PubMed] [Google Scholar]
- Gowen E, Hamilton A. Motor Abilities in Autism: A Review Using a Computational Context. Journal of Autism and Developmental Disorders. 2012;43(2):32. doi: 10.1007/s10803-012-1574-0. [DOI] [PubMed] [Google Scholar]
- Groenendaal F, Veenhoven RH, van der Grond J, Jansen GH, Witkamp TD, de Vries LS. Cerebral lactate and N-acetyl-aspartate/choline ratios in asphyxiated full-term neonates demonstrated in vivo using proton magnetic resonance spectroscopy. Pediatr Res. 1994;35:148–151. doi: 10.1203/00006450-199402000-00004. [DOI] [PubMed] [Google Scholar]
- Harada M, Kubo H, Nose A, Nishitani H, Matsuda T. Measurement of variation in the human cerebral GABA level by in vivo MEGA-editing proton MR spectroscopy using a clinical 3 T instrument and its dependence on brain region and the female menstrual cycle. Hum Brain Mapp. 2011;32:828–833. doi: 10.1002/hbm.21086. [DOI] [PMC free article] [PubMed] [Google Scholar]
- Harada M, Taki MM, Nose A, Kubo H, Mori K, Nishitani H, Matsuda T. Non-invasive evaluation of the GABAergic/glutamatergic system in autistic patients observed by MEGA-editing proton MR spectroscopy using a clinical 3 tesla instrument. J Autism Dev Disord. 2010;41:447–454. doi: 10.1007/s10803-010-1065-0. [DOI] [PubMed] [Google Scholar]
- Hazlett HC, Poe MD, Gerig G, Styner M, Chappell C, Smith RG, Vachet C, Piven J. Early brain overgrowth in autism associated with an increase in cortical surface area before age 2 years. Arch Gen Psychiatry. 2011;68:467–476. doi: 10.1001/archgenpsychiatry.2011.39. [DOI] [PMC free article] [PubMed] [Google Scholar]
- Jansen JF, Backes WH, Nicolay K, Kooi ME. 1H MR spectroscopy of the brain: absolute quantification of metabolites. Radiology. 2006;240:318–332. doi: 10.1148/radiol.2402050314. [DOI] [PubMed] [Google Scholar]
- Jenkinson M, Smith S. A global optimisation method for robust affine registration of brain images. Med Image Anal. 2001;5:143–156. doi: 10.1016/s1361-8415(01)00036-6. [DOI] [PubMed] [Google Scholar]
- Levitt JG, O’Neill J, Blanton RE, Smalley S, Fadale D, McCracken JT, Guthrie D, Toga AW, Alger JR. Proton magnetic resonance spectroscopic imaging of the brain in childhood autism. Biol Psychiatry. 2003;54:1355–1366. doi: 10.1016/s0006-3223(03)00688-7. [DOI] [PubMed] [Google Scholar]
- Lord C, Risi S, Lambrecht L, Cook EH, Jr, Leventhal BL, et al. The autism diagnostic observation schedule-generic: a standard measure of social and communication deficits associated with the spectrum of autism. Journal of Autism and Developmental Disorders. 2000;30:205–223. [PubMed] [Google Scholar]
- Mazziotta J, Toga A, Evans A, Fox P, Lancaster J, Zilles K, Woods R, Paus T, Simpson G, Pike B, Holmes C, Collins L, Thompson P, MacDonald D, Iacoboni M, Schormann T, Amunts K, Palomero-Gallagher N, Geyer S, Parsons L, Narr K, Kabani N, Le Goualher G, Boomsma D, Cannon T, Kawashima R, Mazoyer B. A probabilistic atlas and reference system for the human brain: International Consortium for Brain Mapping (ICBM) Philos Trans R Soc Lond B Biol Sci. 2001;356:1293–1322. doi: 10.1098/rstb.2001.0915. [DOI] [PMC free article] [PubMed] [Google Scholar]
- McFadden KL, Hepburn S, Winterrowd E, Schmidt GL, Rojas DC. Abnormalities in gamma-band responses to language stimuli in first-degree relatives of children with autism spectrum disorder: an MEG study. BMC Psychiatry. 2012 Nov 29;12:213. doi: 10.1186/1471-244X-12-213. [DOI] [PMC free article] [PubMed] [Google Scholar]
- Mescher M, Merkle H, Kirsch J, Garwood M, Gruetter R. Simultaneous in vivo spectral editing and water suppression. NMR Biomed. 1998;11:266–272. doi: 10.1002/(sici)1099-1492(199810)11:6<266::aid-nbm530>3.0.co;2-j. [DOI] [PubMed] [Google Scholar]
- Muthukumaraswamy SD, Edden RA, Jones DK, Swettenham JB, Singh KD. Resting GABA concentration predicts peak gamma frequency and fMRI amplitude in response to visual stimulation in humans. Proc Natl Acad Sci U S A. 2009;106:8356–8361. doi: 10.1073/pnas.0900728106. [DOI] [PMC free article] [PubMed] [Google Scholar]
- Naressi A, Couturier C, Devos JM, Janssen M, Mangeat C, de Beer R, Graveron-Demilly D. Java-based graphical user interface for the MRUI quantitation package. MAGMA. 2001;12:141–152. doi: 10.1007/BF02668096. [DOI] [PubMed] [Google Scholar]
- Newsholme P, Procopio J, Lima MM, Pithon-Curi TC, Curi R. Glutamine and glutamate--their central role in cell metabolism and function. Cell Biochem Funct. 2003;21:1–9. doi: 10.1002/cbf.1003. [DOI] [PubMed] [Google Scholar]
- O’Gorman RL, Michels L, Edden RA, Murdoch JB, Martin E. In vivo detection of GABA and glutamate with MEGA-PRESS: reproducibility and gender effects. J Magn Reson Imaging. 2011;33:1262–1267. doi: 10.1002/jmri.22520. [DOI] [PMC free article] [PubMed] [Google Scholar]
- Oblak AL, Gibbs TT, Blatt GJ. Decreased GABA(B) receptors in the cingulate cortex and fusiform gyrus in autism. J Neurochem. 2010;114:1414–1423. doi: 10.1111/j.1471-4159.2010.06858.x. [DOI] [PMC free article] [PubMed] [Google Scholar]
- Oblak AL, Gibbs TT, Blatt GJ. Reduced GABAA receptors and benzodiazepine binding sites in the posterior cingulate cortex and fusiform gyrus in autism. Brain Res. 2011;1380:218–228. doi: 10.1016/j.brainres.2010.09.021. [DOI] [PMC free article] [PubMed] [Google Scholar]
- Page LA, Daly E, Schmitz N, Simmons A, Toal F, Deeley Q, Ambery F, McAlonan GM, Murphy KC, Murphy DG. In vivo 1H-magnetic resonance spectroscopy study of amygdala–hippocampal and parietal regions in autism. Am J Psychiatry. 2006;163:2189–2192. doi: 10.1176/appi.ajp.163.12.2189. [DOI] [PubMed] [Google Scholar]
- Pizzarelli R, Cherubini E. Alterations of GABAergic signaling in autism spectrum disorders. Neural Plast. 2011;2011:297153. doi: 10.1155/2011/297153. [DOI] [PMC free article] [PubMed] [Google Scholar]
- Prichard JW, Shulman RG. NMR spectroscopy of brain metabolism in vivo. Annu Rev Neurosci. 1986;9:61–85. doi: 10.1146/annurev.ne.09.030186.000425. [DOI] [PubMed] [Google Scholar]
- Puts NA, Edden RA, Evans CJ, McGlone F, McGonigle DJ. Regionally specific human GABA concentration correlates with tactile discrimination thresholds. J Neurosci. 2011;31:16556–16560. doi: 10.1523/JNEUROSCI.4489-11.2011. [DOI] [PMC free article] [PubMed] [Google Scholar]
- Redcay E, Courchesne E. When is the brain enlarged in autism? A meta-analysis of all brain size reports. Biol Psychiatry. 2005;58:1–9. doi: 10.1016/j.biopsych.2005.03.026. [DOI] [PubMed] [Google Scholar]
- Roberts TP, Cannon KM, Tavabi K, Blaskey L, Khan SY, Monroe JF, Qasmieh S, Levy SE, Edgar JC. Auditory magnetic mismatch field latency: a biomarker for language impairment in autism. Biol Psychiatry. 2011;70:263–269. doi: 10.1016/j.biopsych.2011.01.015. [DOI] [PMC free article] [PubMed] [Google Scholar]
- Roberts TP, Khan SY, Rey M, Monroe JF, Cannon K, Blaskey L, Woldoff S, Qasmieh S, Gandal M, Schmidt GL, Zarnow DM, Levy SE, Edgar JC. MEG detection of delayed auditory evoked responses in autism spectrum disorders: towards an imaging biomarker for autism. Autism Res. 2010;3:8–18. doi: 10.1002/aur.111. [DOI] [PMC free article] [PubMed] [Google Scholar]
- Rubenstein JL, Merzenich MM. Model of autism: increased ratio of excitation/inhibition in key neural systems. Genes Brain Behav. 2003 Oct;2(5):255–67. doi: 10.1034/j.1601-183x.2003.00037.x. [DOI] [PMC free article] [PubMed] [Google Scholar]
- Rudin M, editor. In Vivo Magnetic Resonance Spectroscopy II. 1992. [Google Scholar]
- Rutter M, Bailey A, Lloyd C. SCQ: Social Communication Questionnaire. Los Angeles, CA: Western Psychological Services; 2003. [Google Scholar]
- Schmitz N, Rubia K, Daly E, Smith A, Williams S, Murphy DG. Neural correlates of executive function in autistic spectrum disorders. Biol Psychiatry. 2006;59:7–16. doi: 10.1016/j.biopsych.2005.06.007. [DOI] [PubMed] [Google Scholar]
- Soares DP, Law M. Magnetic resonance spectroscopy of the brain: review of metabolites and clinical applications. Clin Radiol. 2009;64:12–21. doi: 10.1016/j.crad.2008.07.002. [DOI] [PubMed] [Google Scholar]
- Tallon-Baudry C, Bertrand O. Oscillatory gamma activity in humans and its role in object representation. Trends Cogn Sci. 1999;3:151–162. doi: 10.1016/s1364-6613(99)01299-1. [DOI] [PubMed] [Google Scholar]
- Tallon-Baudry C, Kreiter A, Bertrand O. Sustained and transient oscillatory responses in the gamma and beta bands in a visual short-term memory task in humans. Vis Neurosci. 1999;16:449–459. doi: 10.1017/s0952523899163065. [DOI] [PubMed] [Google Scholar]
- Toal F, Daly EM, Page L, Deeley Q, Hallahan B, Bloemen O, Cutter WJ, Brammer MJ, Curran S, Robertson D, Murphy C, Murphy KC, Murphy DG. Clinical and anatomical heterogeneity in autistic spectrum disorder: a structural MRI study. Psychol Med. 2010;40:1171–1181. doi: 10.1017/S0033291709991541. [DOI] [PubMed] [Google Scholar]
- Urenjak J, Williams SR, Gadian DG, Noble M. Specific expression of N-acetylaspartate in neurons, oligodendrocyte-type-2 astrocyte progenitors, and immature oligodendrocytes in vitro. J Neurochem. 1992;59:55–61. doi: 10.1111/j.1471-4159.1992.tb08875.x. [DOI] [PubMed] [Google Scholar]
- Urenjak J, Williams SR, Gadian DG, Noble M. Proton nuclear magnetic resonance spectroscopy unambiguously identifies different neural cell types. J Neurosci. 1993;13:981–989. doi: 10.1523/JNEUROSCI.13-03-00981.1993. [DOI] [PMC free article] [PubMed] [Google Scholar]
- Vanhamme L, vanden Boogaart A, Van Huffel S. Improved method for accurate and efficient quantification of MRS data with use of prior knowledge. J Magn Reson. 1997;129:35–43. doi: 10.1006/jmre.1997.1244. [DOI] [PubMed] [Google Scholar]
- Yasuhara A. Correlation between EEG abnormalities and symptoms of autism spectrum disorder (ASD) Brain Dev. 2010;32:791–798. doi: 10.1016/j.braindev.2010.08.010. [DOI] [PubMed] [Google Scholar]
- Yip J, Soghomonian JJ, Blatt GJ. Decreased GAD67 mRNA levels in cerebellar Purkinje cells in autism: pathophysiological implications. Acta Neuropathol. 2007;113:559–568. doi: 10.1007/s00401-006-0176-3. [DOI] [PubMed] [Google Scholar]
- Yoon JH, Maddock RJ, Rokem A, Silver MA, Minzenberg MJ, Ragland JD, Carter CS. GABA concentration is reduced in visual cortex in schizophrenia and correlates with orientation-specific surround suppression. J Neurosci. 2010;30:3777–3781. doi: 10.1523/JNEUROSCI.6158-09.2010. [DOI] [PMC free article] [PubMed] [Google Scholar]
- Zhang Y, Brady M, Smith S. Segmentation of brain MR images through a hidden Markov random field model and the expectation-maximization algorithm. IEEE Trans Med Imaging. 2001;20:45–57. doi: 10.1109/42.906424. [DOI] [PubMed] [Google Scholar]