Abstract
Purpose
To examine the potential use of BOLD (Blood Oxygenation Level Dependent) and TOLD (Tissue Oxygenation Level Dependent) contrast MRI to assess tumor oxygenation and predict radiation response.
Methods
BOLD and TOLD MRI were performed on Dunning R3327-AT1 rat prostate tumors during hyperoxic gas breathing challenge at 4.7 T. Animals were divided into two groups. In Group 1 (n=9), subsequent 19F MRI based on spin lattice relaxation of hexafluorobenzene reporter molecule provided quantitative oximetry for comparison. For Group 2 rats (n=13) growth delay following a single dose of 30 Gy was compared with pre-irradiation BOLD and TOLD assessments.
Results
Oxygen (100%O2) and carbogen (CB; 95%O2/5%CO2) challenge elicited similar BOLD, TOLD and pO2 responses. Strong correlations were observed between BOLD or R2* response and quantitative 19F pO2 measurements. TOLD response showed a general trend with weaker correlation. Irradiation caused a significant tumor growth delay and tumors with larger changes in TOLD and R1 values upon oxygen breathing exhibited significantly increased tumor growth delay.
Conclusion
These results provide further insight into the relationships between oxygen sensitive (BOLD/TOLD) MRI and tumor pO2. Moreover, a larger increase in R1 response to hyperoxic gas challenge coincided with greater tumor growth delay following irradiation.
Keywords: BOLD, MRI, hypoxia, oxygen, carbogen, oximetry, radiation response
Introduction
Hypoxia is increasingly regarded as an important factor and potential prognostic biomarker for tumor aggressiveness and response to therapy (1). The fundamental studies of Gray et al. demonstrated the influence of hypoxia on response to radiation (2). More recently, polarographic needle electrode measurements of pO2 distributions and hypoxic fractions in patients confirmed poor outcome for hypoxic tumors in several disease sites including cervix (3,4), head and neck (5), and prostate (6). There have also been correlations based on PET of radionuclide labeled hypoxia markers or biopsies and histology, but to date there is no routine non-invasive approach available in the clinic to assess tumor oxygenation and help predict treatment outcome (1).
Oxygen-sensitive MRI is attractive, since it is non-invasive and avoids the need for an exogenous reporter agent. Increasingly, reports suggest the feasibility of BOLD (Blood Oxygen Level Dependent) and TOLD (Tissue Oxygen Level Dependent) contrast MRI in patients (7–14). BOLD effects have been evaluated in numerous animal models (15–25) and several studies have demonstrated a correlation with measurements of pO2 (18–20,24–26). BOLD MRI has attracted increasing interest as a non-invasive indicator of hypoxia based on intrinsic effective transverse relaxation rate (R2* =1/T2*) or response to breathing hyperoxic gas (ΔSI or ΔT2*). It provides an indication of tumor blood oxygenation, but is also sensitive to local hematocrit, vascular volume, pH, flow, and vessel density (22,23,27). Meanwhile, TOLD MRI is based on T1-weighted contrast. The measured R1 (=1/T1) is sensitive to tissue oxygenation and is distinct from BOLD imaging (28–30). Hyperoxic gas breathing has also been evaluated in several disease sites using T1W MRI (29). We hypothesized that both techniques provide complimentary information in assessing tumor oxygenation.
These reports prompted us to explore BOLD and TOLD measurements based on differences in signal intensity in T1- and T2*-weighted images, as well as relaxation rates (R1 and R2*) to predict radiation response. We chose 19F MRI relaxometry based on the reporter molecule hexafluorobenzene (HFB) as a correlative standard, since it provides quantitative assessment of partial oxygen pressure (pO2) in vivo (31). The method is finding increasing use for assessing oxygen dynamics and is convenient for correlation with proton MRI (18,32–34). Here, we examined BOLD and TOLD MRI as surrogate biomarkers to assess tumor oxygenation, as correlated with quantitative pO2 measurements. We also tested BOLD and TOLD MRI as a prognostic tool to predict radiation treatment outcome of a well-characterized Dunning R3327 rat prostate cancer: AT1.
Materials and methods
Animal model
This study was approved by the Institutional Animal Care and Use Committee. Twenty two male Copenhagen rats were implanted with syngeneic Dunning R3327-AT1 prostate tumors. The AT1 is an anaplastic tumor with a volume doubling time of 5.2 days (35) and TCD50 (single radiation dose for 50% tumor control probability) of 75.7 Gy (36). Tumor tissue fragments were implanted subcutaneously in the thigh and tumor volume was calculated as V= (π/6)*a*b*c, where a, b, c, are the three orthogonal diameters measured using a caliper.
Tumor oximetry
MRI experiments were performed two to five weeks post tumor implantation depending on the desired tumor size. MRI used a horizontal bore 4.7-T magnet system (Varian, Palo Alto, CA) with a single-turn solenoid coil tunable to 1H or 19F. Animals were anesthetized with isoflurane (1.5%) in air (1 L/min) delivered via a nose cone and kept warm (37 °C) using a circulating warm water blanket. T2-weighted (T2W) images with 0.3 mm in-plane resolution were acquired using a Fast Spin Echo (FSEMS) sequence: TR/TEeff =2000/48 ms, Echo Train Length (ETL) =8, FOV=40×40 mm with 128×128 acquisition matrix, NEX=8, 1 mm slice thickness without gap, and 15 slices acquired transaxially to the leg.
BOLD images were acquired using a multi-echo gradient echo sequence (MGEMS): TR =150 ms, 10 echo time values ranging from 6 to 69 ms with echo spacing of 7 ms, flip angle (FA) = 20°, acquisition time 21 s. TOLD images were acquired using a gradient echo sequence (GEMS): TR/TE= 30/5 ms, FA=45°, acquisition time 3 s. The two sequences were interleaved in an automated fashion to obtain BOLD and TOLD (IBT) MR images using the same FOV, matrix size and imaging plane, as for the high resolution T2W images to allow effective co-registration
Animals were divided into two groups. For Group 1 rats (n=9), IBT was acquired while animals breathed air (8 minutes baseline) followed by oxygen (100% O2) for about 30 minutes. To compare the effect of hyperoxic gas challenge, this was followed by re-equilibration breathing air for approximately 10 minutes followed by carbogen (CB, 95% O2, 5% CO2) for about 30 minutes. In addition, quantitative pO2 measurements were obtained using the FREDOM (Fluorocarbon Relaxometry using Echo planar imaging for Dynamic Oxygen Mapping) approach approximately 24 hours after IBT (31). Hexafluorobenzene (HFB, 50–100 μl) was injected directly into the tumor in a fan pattern to ensure distribution of HFB throughout a plane of the tumor approximately coinciding with the IBT study. Pulse burst saturation recovery echo planar imaging (EPI) was used to measure the spin-lattice relaxation rate, R1, of HFB by arraying 14 delay times (τ), as described previously (31). Five pO2 measurements were obtained for each gas: baseline air, O2, return to air and finally CB. The FREDOM parameters were: TR=50 ms, TE=21 ms, τ ranges from 0.2 to 90 s, NEX =1 to 12 (depending on τ), FOV=40×40 mm with 32×32 acquisition matrix, slice thickness 10 mm, giving an acquisition time of 6½ minutes.
Rats in Group 2 (n=13) underwent only 1H MRI using the same parameters as mentioned above. Based on results for Group 1, only 100% O2 challenge was examined (i.e. no CB), and quantitative T1 measurements were additionally acquired using a spin echo sequence (SEMS): TE= 20 ms, TR= 0.1, 0.2, 0.3, 0.5, 0.7, 0.9, 1.5, 2.5, 3.5 s, FOV=40×40 mm with 64×64 acquisition matrix, though this was zero-filled to 128×128 to allow voxel-wise comparison with IBT. Group 2 rats entered the radiation treatment protocol within 24 hrs of MRI as follows.
Radiation treatment
Radiation was delivered using a small animal X-ray irradiator (XRAD 225Cx, Precision X-Ray, Inc., North Branford, CT) operating at 225 kV and 13 mA, producing a dose rate of 3.5 Gy/min delivering a total dose of 30 Gy. An image guidance system utilizing a digital imaging panel for digital radiography, fluoroscopy, and cone-beam CT (CBCT) was used to ensure accurate localization to the tumor. Absolute dose calibration was performed in accordance with the recommendations of the AAPM TG-61 protocol (37).
Rats were divided into three sub-groups: Group 2a (n=2) were not irradiated (control), Group 2b (n=5) breathed air during irradiation and Group 2c (n=6) breathed 100% O2 for about 15 minutes before irradiation and during irradiation. Tumor volume (V), measured with calipers, was normalized to the day of irradiation (V0) and response was evaluated as the time to quadruple (T4). One animal died before T4 and the day of death was taken as T4.
Data analysis
MRI data were processed using Matlab (MathWorks Inc., Natick, MA). Changes in signal intensity (%ΔSI) with respect to O2 and CB challenge were calculated from the MGEMS and GEMS sequences. For BOLD images, a single TE=20 ms was selected. Signal intensity change was calculated as:
| (1) |
where SIb is the mean baseline signal intensity during air breathing and SIt is the mean signal intensity with 100% O2 or CB inhalation excluding the first minute of transition to new gas.
T2* maps were generated by fitting the multi-echo T2*W image signal intensity (MGEMS) to TE, as a monoexponential function on a voxel-by-voxel basis:
| (2) |
where SI is signal intensity at each echo time (TE), S0 represents the original magnetization and k is a constant. Initial estimates for S0 and T2* were calculated by first solving Equation (2) based on SI at the first two TE values and these preliminary estimates were used as initial values to fit Equation (2). The change of T2* due to 100% O2/CB challenge was then calculated as:
| (3) |
where T2*b represents mean baseline during air breathing, and T2*t is the mean value with 100% O2/CB inhalation. Similarly, change in R2* was calculated as (ΔR2* =R2*t − R2*b).
Tumor pO2 was estimated on a voxel-by-voxel basis using a monoexponential function, and pO2 (torr) determined using the relationship (31):
| (4) |
Voxel-by-voxel measurements allowed calculation of HF5 (fraction of voxels with pO2<5 torr). Only voxels with consistently reliable fitting (coefficient of determination, R2>0.95) throughout the experiment were selected for further statistical analysis (the number of acceptable voxels ranged from 37 to 99).
Statistical Analysis
Mean baseline SI of the T2*W and T1W images was calculated for each ROI and compared with 100% O2 and CB breathing. An average of all data points was used to determine the response to challenge excluding the first minute of transition to new gas. Significance of response to 100% O2 and CB challenge was assessed using Student’s t-tests.
Results
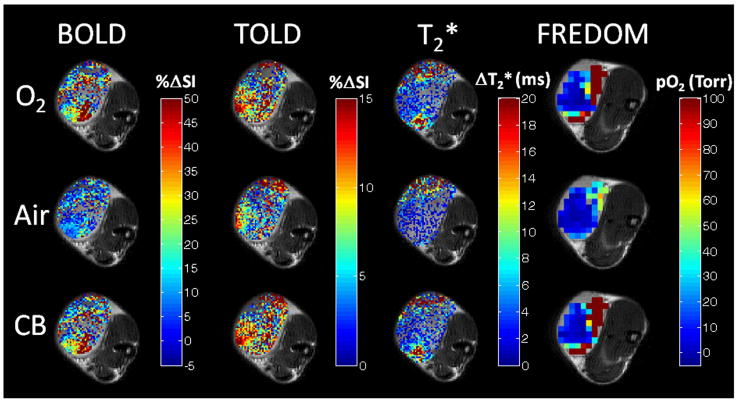
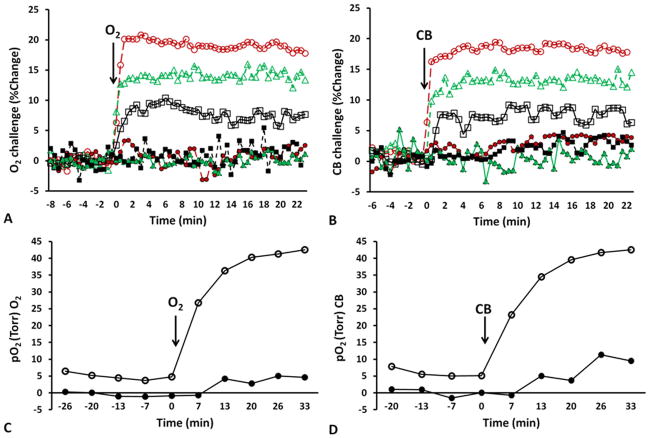
Tumors showed distinct heterogeneity in terms of baseline T2* and pO2, while breathing air, with higher pO2 near the periphery. All measurements were stable during air breathing (8 minutes) with mean values and standard deviations presented for each tumor in Table 1. Mean baseline pO2 ranged from −0.5±0.6 torr to 17.9±1.3 torr for individual tumors with a mean of 5.8±6.5 torr (median 4.1 torr) for the small tumors (<1 cm3), while larger tumors were more hypoxic (−0.7±1.6 torr to 10.1±0.4 torr, mean=3.1±6.0 torr, median=0.1 torr; size >2.9 cm3, Table 1). Hypoxic fraction (HF5) was more distinct and ranged from 40 to 80% for the small tumors and was over 95% for the larger tumors (Table 2). Spatial response of each parameter to gas challenge is presented for one tumor (#4; Fig. 1) and dynamic changes are compared for two representative tumors showing small and large responses respectively (Fig. 2).
Table 1.
Transverse relaxation times and pO2 of Dunning prostate R3327-AT1 tumors
| Rat # | Size (cm3) | T2* (air) ms | T2* (O2) ms | pO2 (air) torr | pO2 (O2) torr |
|---|---|---|---|---|---|
| 1 | 0.7 | 30.6±0.9 | 32.6±1.8 | 3.2±1.0 | 17.3±1.3 |
| 2 | 0.6 | 28.7±0.5 | 31.6±1.0 | 17.9±1.3 | 46.9±6.0 |
| 3 | 0.6 | 20.5±0.2 | 21.0±0.2 | 7.1±0.5 | 17.1±2.5 |
| 4 | 0.5 | 21.1±0.1 | 23.5±0.2 | 5.0±1.0 | 40.1±2.6 |
| 5 | 0.5 | 24.7±0.8 | 25.9±0.6 | 2.0±3.1 | 9.1±0.3 |
| 6 | 0.7 | 23.8±0.4 | 24.1±0.3 | −0.5±0.6 | 3.1±2.3 |
| 7 | 3.0 | 18.4±0.6 | 16.4±0.9 | −0.7±1.6 | −1.0±1.6† |
| 8 | 2.9 | 27.1±2.0 | 26.2±1.8 | 10.1±0.4 | 12.6±1.1 |
| 9 | 8.8 | 39.8±1.5 | 44.6±2.0 | 0.1±0.3 | −1.1±0.4 |
| Mean | 26.1±6.5 | 27.3±8.2 | 4.9±6.1 | 16.3±16.9 |
T2* and pO2 values are means for each tumor and responses were significant (p<0.01) except † (NS).
Table 2.
Effect of oxygen and carbogen breathing on BOLD and TOLD MRI
| BOLD (%ΔSI) | ΔT2*(ms) | TOLD (%ΔSI) | ΔpO2 (torr) | HF5 (%) | |||||||
|---|---|---|---|---|---|---|---|---|---|---|---|
| Rat # | Size (cm3) | Oxygen | CB | Oxygen | CB | Oxygen | CB | Oxygen | CB | Oxygen | CB |
| 1 | 0.7 | 2.7±1.2* | 0.5±1.2 | 2.0±1.9* | 3.4±2.65* | −1.0±2.4 | −3.9±2.3* | 14.1±7.4* | 15.5±3.5* | 79 to 62 | 67 to 56 |
| 2 | 0.6 | 8.2±2.9* | 3.0±0.9* | 2.9±1.3* | 0.9±0.7* | −0.4±1.4 | −2.8±2.0* | 29.0±7.1* | 13.8±3.8* | 43 to 38 | 28 to 28 |
| 3 | 0.6 | 5.3±1.8* | 4.3±1.19* | 0.5±0.4* | 0.1±0.4 | 0.5±1.1 | −1.5±2.2* | 10.0±3.6* | 7.3±1.3* | 53 to 41 | 50 to 48 |
| 4 | 0.5 | 18.7±5.3* | 20.0±0.8* | 2.4±0.6* | 2.5±0.2* | 7.3±2.2* | 8.7±1.9* | 35.2±2.7* | 36.4±1.6* | 66 to 29 | 45 to 31 |
| 5 | 0.5 | 4.3±1.4* | 4.7±1.5* | 1.2±0.7* | 0.6±0.7* | 1.2±1.0* | 1.6±0.7* | 7.1±1.3* | 15.2±1.2* | 43 to 17 | 27 to 14 |
| 6 | 0.7 | 1.2±2.1 | 3.8±1.4* | 0.3±0.5 | 1.1±0.6* | 0.2±0.8 | 2.1±1.3* | 3.6±1.0* | 6.8±3.6* | 63 to 41 | 49 to 32 |
| 7 | 3.0 | −1.7±0.7* | −1.4±0.8* | −1.6±0.9* | −2.1±1.3* | −1.1±0.8* | −3.1±1.2* | −0.3±1.5 | −3.0±0.3 | 97 to 95 | 97 to 97 |
| 8 | 2.9 | −1.4±1.1* | −1.5±1.3* | −0.9±2.4 | −2.8±4.0* | −0.3±0.9 | −1.9±1.3* | 2.6±1.0* | 4.8±0.5* | 95 to 92 | 94 to 92 |
| 9 | 8.8 | 2.8±0.8* | 1.7±0.7* | 4.8±2.3* | 6.9±2.8* | 0.7±0.5* | −0.3±0.7 | −1.2±0.4* | −0.6±0.5 | 96 to 96 | 96 to 87 |
| Average | 4.4±6.2 | 3.8±6.6 | 1.3±2.0 | 1.2±2.9 | 0.8±2.5 | −0.1±3.9 | 11±13 | 11±12 | 71 to 57 | 61 to 54 | |
Quantitative pO2 measurements were obtained using FREDOM and HF5 was calculated.
p<0.01
Figure 1. Oxygen sensitive MRI.
Semi-quantitative BOLD and TOLD, and quantitative T2* and pO2 response maps overlaid on high resolution T2W image of a small Dunning prostate R3327-AT1 tumor (#4, 0.5 cm3) with respect to oxygen challenge, return to air and carbogen breathing. Response maps compare final image with each gas versus baseline. 19F oximetry was performed following direct intratumoral injection of hexafluorobenzene reporter the next day. Each map shows considerable intratumoral heterogeneity.
Figure 2. Changes in tumor oxygenation in response to oxygen breathing.
Mean changes in BOLD (red ○), TOLD (black □), %ΔT2* (green △) for two tumors exhibiting very different response to A) 100% O2 and B) CB challenge. Tumor #4 (open symbols) and # 6 (solid symbols). Corresponding mean changes in pO2 to C) 100% O2 and D) CB challenge. The hypoxic tumor showed little response by all measures, whereas the better oxygenated tumor was rapidly responsive.
Tumor response to 100% O2/CB challenge was diverse, but the oxygen sensitive MRI parameters were highly consistent, as shown for representative tumors in Fig. 2. Tumor #4 showed large BOLD and TOLD responses (Fig. 2A and 2B) with corresponding large increase in pO2 (Fig. 2C and 2D), whereas tumor #6 showed smaller response in each parameter. Rapid BOLD signal increase and T2* enhancement were observed followed by slower TOLD response in tumor #4. By comparison baseline pO2=5.0±1.0 torr (HF5 =66%) increased by pO2=35.2±2.7 torr (HF5 =29%). Meanwhile, tumor #6 showed minimal BOLD and TOLD responses, lower baseline pO2 and smaller changes with 100% O2/CB breathing.
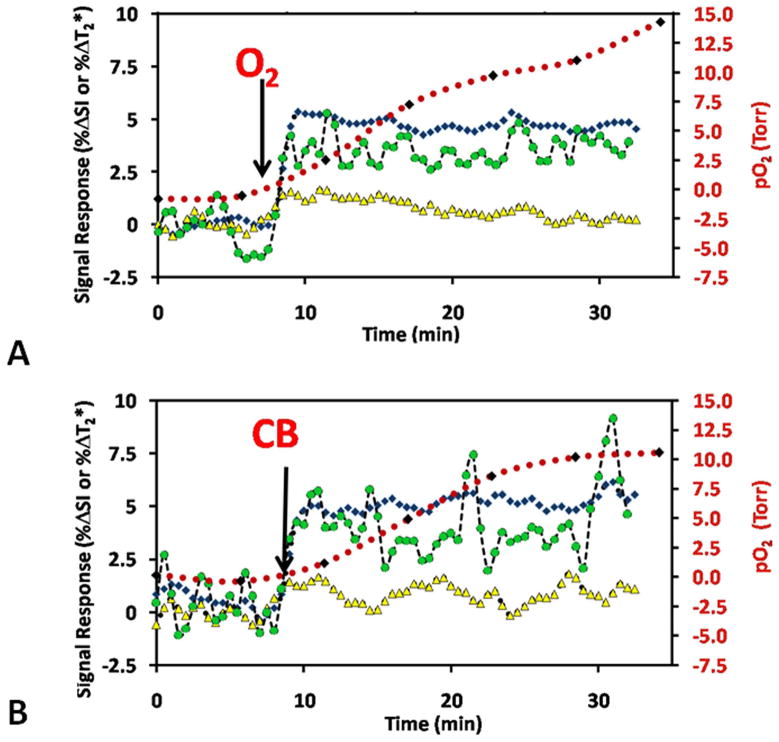
The mean change in SI (%ΔSI) for BOLD, TOLD, %ΔT2*, and pO2 for the group of nine AT1 tumors (Group 1) is presented in Fig. 3. Following the oxygen challenge, the gas was switched back to air and BOLD and TOLD measurements returned to stable baseline. The measurements were repeated while switching the gas to CB (Fig. 3B) and responses were very similar. FREDOM was performed on the second day to obtain corresponding pO2 measurements (Table 1). Upon oxygen breathing the pO2 increased to varying extents (mean ΔpO2 = 11.1±13.0 torr, Table 2), followed by slow decrease to baseline during air breathing. CB showed similar pO2 enhancement (Figs. 1, 3 and Table 2). Converting R1 relaxation values to pO2 led to some apparently negative pO2 values. The most negative pO2 in an individual voxel was −9.3 torr and the median negative value for all the tumors ranged from −1.5 to −8.5 torr giving an average negative hypoxic fraction of 22 (± 10)%. Such negative values may be interpreted as having a high likelihood of being hypoxic.
Figure 3. Oxygen dynamics assessed by MRI.
Mean BOLD (T2*W %ΔSI, blue ◆), TOLD (T1W %ΔSI, yellow ▲), and %ΔT2* (green ●) signal response to the hyperoxic gas challenge, together with pO2 (red) for Group 1 tumors (n=9). Baseline measurements were quite stable during air breathing and changed to various extents in response to A) oxygen (O2), or B) carbogen (CB) breathing. Arrows indicate the transition to each gas. Proton MRI measurements were observed in an interleaved manner and corresponding 19F oximetry was performed following injection of hexafluorobenzene reporter the next day.
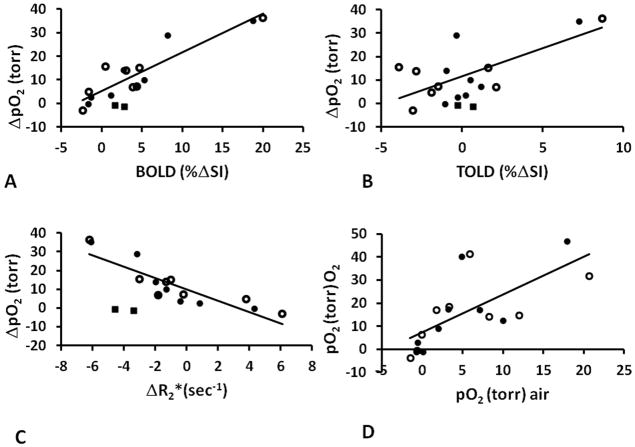
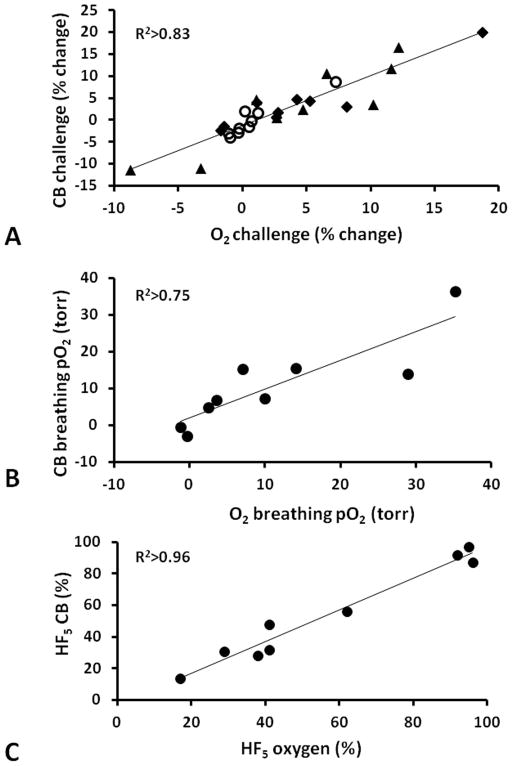
Strong correlations were observed between ΔpO2 and BOLD (R2>0.82, p<0.001) for eight animals during CB and O2 breathing (Fig. 4A). One tumor (#9 ■) was excluded from the analysis, because the HFB was primarily injected into the center of this large tumor (8.8 cm3) and therefore did not reflect the whole tumor. Somewhat weaker relationships were found between ΔpO2 and TOLD (R2>0.47, p<0.004, Fig. 4B) and ΔpO2 and ΔR2* (R2>0.58, p<0.001, though R2>0.75 for O2 challenge alone, Fig. 4C). ΔpO2 tended to increase with baseline pO2 (R2>0.47, and for O2 challenge alone R2>0.61, Fig. 4D). We note that tumor #4 showed exceptionally large responses of each parameter. Lest this one tumor bias the relationships, we also tested correlations in the absence of tumor #4. Now the correlations between ΔpO2 and BOLD weakened somewhat (R2>0.59), ΔpO2 and R2* was essentially unchanged (R2>0.5), ΔpO2 and TOLD was non-existent (R2<0.01), but pO2 during hyperoxic gas breathing and pO2 actually increased (R2>0.72).
Figure 4. Correlation between BOLD, TOLD, and pO2 for 9 AT1 tumors.
Graphs show correlations between ΔpO2 and (A) BOLD (B) TOLD and C) ΔR2* in response to oxygen (●) and carbogen (○) challenges (Group 1 tumors). The HFB injection in one tumor (■) was in the center and the data were excluded from the correlations, as being unrepresentative of the whole tumor. D) Correlation between mean pO2 during oxygen (●) or carbogen (○) breathing and baseline air-breathing pO2.
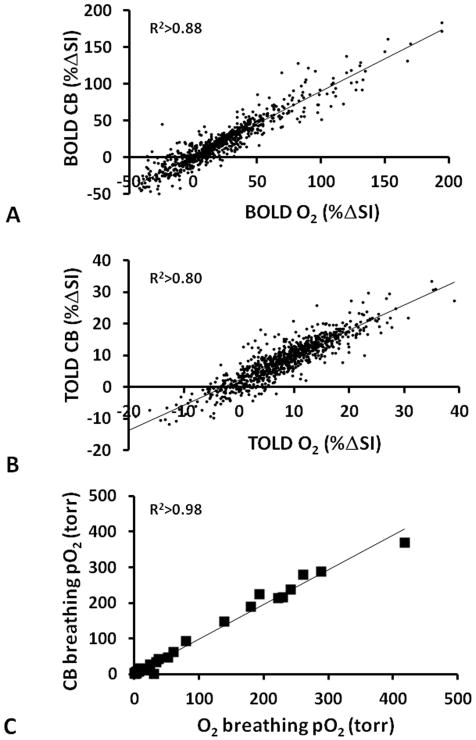
Mean responses for BOLD, TOLD, ΔT2* and ΔpO2 to the two gas challenges were very similar (Table 2). Moreover, strong correlations were observed between the responses to the two gases for individual tumors (Fig. 5). Regional responses and local effects may ultimately be more important than mean values across a whole tumor and therefore the relative response at individual locations (voxels) were compared and are presented for tumor #4 (Fig. 6). Substantial concordance was observed for the two gases and notably pO2 was very similar including the crucial hypoxic fractions (Fig. 6c).
Figure 5. Comparison of response to oxygen and carbogen for 9 AT1 tumors.
A) Correlation between mean BOLD %ΔSI (◆), Δ%SI TOLD (○), and %ΔT2* (▲) responses for each tumor in Group 1 to oxygen and carbogen challenge assessed non-invasively using 1H MRI. B) Correlation between oxygen and carbogen in modulating tumor pO2 assessed using 19F MRI relaxometry following direct intratumoral injection of HFB reporter. C) Correlation between residual hypoxic fraction (pO2 < 5 torr) in individual tumors, while breathing oxygen or carbogen.
Figure 6. Comparison of response to oxygen and carbogen for individual sites in a representative tumor.
Correlations observed between response to oxygen and carbogen challenge for individual voxels in a representative tumor (#4) based on A) T2W signal response (BOLD), B) T1W signal response (TOLD), and C) pO2 confirming similarity of the effects of both gases.
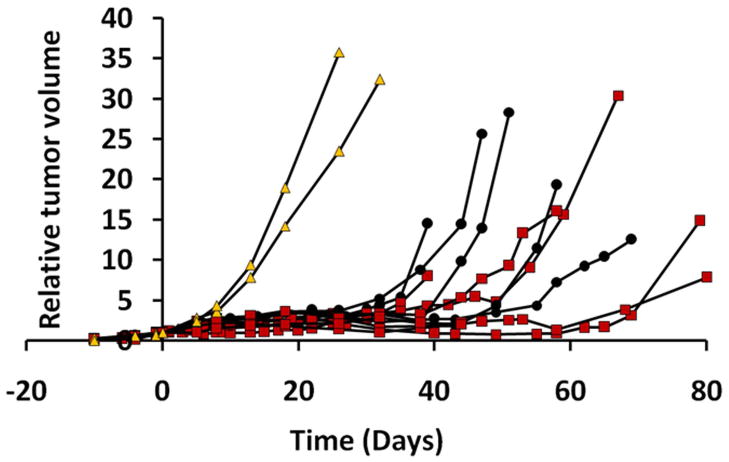
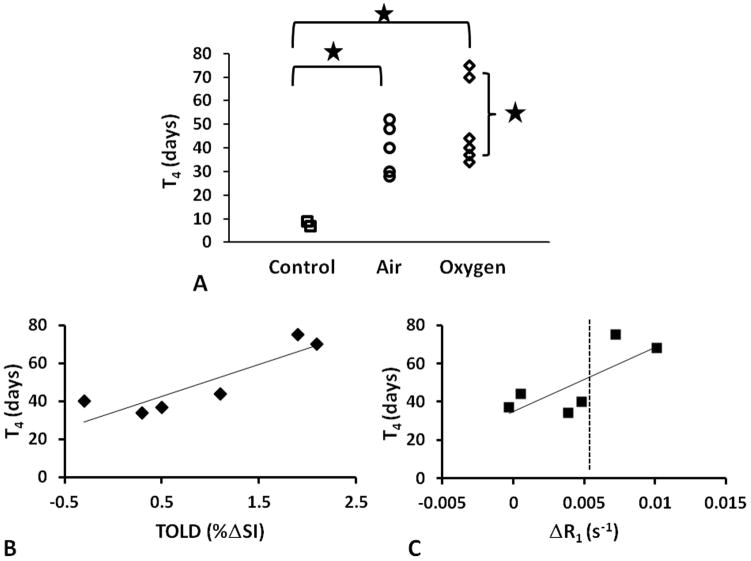
For Group 2 (13 AT1 tumors) IBT studies were performed with respect to O2 only and quantitative T1 measurements were added. Two tumors served as unirradiated controls (Group 2a, mean V0=0.4±0.1 cm3). The other tumors received a 30 Gy irradiation dose, while rats breathed air (n=5; V0=0.5±0.3 cm3) or 100% O2 (n=6; V0=0.5±0.2 cm3). Growth was measured up to four times the initial tumor size or 80 days (Fig. 7). One rat died before the tumor reached T4 and this date was used as T4. Untreated controls had the fastest growth rate with a T4 of 8±1 days (Fig. 8A). The irradiated tumors showed significantly slower growth rates with T4 =39±11 days (Group 2b) and 50±18 days (Group 2c). A correlation was found between T4 for the animals breathing 100% O2 during radiation and pre-irradiation TOLD (%ΔSI, Fig. 8B; R2> 0.79; p<0.05) or R1 (Fig. 8C; R2> 0.57) response to oxygen challenge. Significantly, Group 2c tumors could also be stratified by magnitude of response, where large responders (ΔSI > 1.5% and ΔR1 (R1(air) − R1(O2) > 0.005 s−1) showed significantly larger T4 ~70 days vs. 35 days (p< 0.05). No such correlation was seen for semi-quantitative ΔSI or quantitative R2* BOLD responses.
Figure 7. Influence of radiation on Dunning prostate R3327-AT1 tumor growth.
Growth curves for the 13 individual AT1 tumors: sham-irradiated tumors (Group 2a, n=2, yellow filled triangles), and single dose 30 Gy, while rats breathed air (Group 2b, n=5, filled circles) or oxygen (Group 2c, n=6, red filled squares).
Figure 8. Tumor growth delay.
A) Effect of air and oxygen breathing on radiation response assessed by time for tumor to quadruple is size (T4); * p<0.01. Correlation between (T4) and B) TOLD or C) ΔR1 for those tumors irradiated during oxygen breathing (n=6).
Discussion
This study showed distinct trends between BOLD, TOLD and absolute pO2 responses to hyperoxic gas breathing challenge. Quantitative BOLD and TOLD measurements were readily implemented and gave consistent results. However, TOLD response was more closely related to tumor growth delay following single high dose irradiation.
The smaller tumors (volume <1 cm3) were significantly better oxygenated than the larger ones (Tables 1 and 2) in accord with previous studies regarding AT1 tumors (38–40), although individual tumors showed a wide range of hypoxic fractions. Generally, the smaller tumors showed larger pO2 changes upon 100% O2 or CB breathing compared to larger tumors. Likewise, smaller tumors tended to exhibit larger changes in BOLD (6.3±6.3%), TOLD (1±3.7%), and T2* (1.5±1.1 ms) compared to larger tumors BOLD (−0.3±2.0%), TOLD (−0.9±1.3%), and T2* (0.7±4.1 ms), although these differences did not reach statistical significance for the groups. Tumors found to have low baseline pO2 tended to exhibit smaller pO2 response to 100% O2 or CB challenge (Table 1, Figs. 2, 4) and as a corollary those with greater baseline hypoxic fraction retained a large hypoxic fraction (Table 2). Each of the oxygen sensitive parameters behaved consistently, whereby tumors exhibiting larger BOLD, TOLD and T2* response to 100% O2 and CB challenge showed high baseline pO2 when examined by 19F MRI the following day (Figs. 2, 4).
Negative values were observed in FREDOM measurements on occasion accounting for 8.2% to 38.8% of total pixels. Although negative pO2 values are physically impossible, we believe they arise from noise generating uncertainties in the curve fitting. Provided that errors and uncertainties are considered, such negative values are consistent with high probability of actual values close to zero (i.e. hypoxic). Errors in the original calibration could also be the cause of apparently negative pO2. We do note slightly different calibrations reported for hexafluorobenzene at 4.7 T and 37 °C with the anoxic intercept reported to be as low as 0.074 s−1 (31,41). During many years of investigations we have found the calibration used here to provide highly consistent results, although we do note that the reported calibration curve and phantom showed a range of relaxation rates for 0% O2 and thus, there is clearly some uncertainty (42). We also note that the Eppendorf Histograph, sometimes considered as the “gold standard” for in vivo oximetry often indicated some negative pO2 values (43). In this study, we correlated ΔpO2 with BOLD and TOLD parameters. Therefore, the effect of errors in actual pO2 measurement, although valid, is minimized.
Strong correlations were found between both quantitative and semi-quantitative BOLD responses and ΔpO2 measurements (Figs. 4A, C) in line with previous reports for rat mammary tumors 13762NF (18) and R3230AC (44). Indeed, general correlations between BOLD response (variously assessed as change in signal intensity, change in local linewidth or quantitative T2*) and change in pO2 have been reported in diverse tumors based on various oximetry techniques (e.g., ESR (19,25), fiber optic probes (45), electrodes (26) and 19F MRI (18,24)). The relationship is often far from linear, presumably reflecting the O2-hemoglobin binding characteristics (22). Some reports indicate that T2* alone may be indicative of hypoxia in tumors (46,47), though vascular extent can exert a strong influence (23,48). As such, adding TOLD measurements ought to help identify hypoxia irrespective of vasculature, since T1 is reported to be directly sensitive to pO2 (30).
Combined BOLD and TOLD was recently reported in rabbit tumors (49) as well as normal tissues and tumors in patients (29). While the BOLD response is generally larger (often approaching 2–3 fold, c.f., Figs. 2A, 3 and Table 2) and hence easier to identify, TOLD at a minimum provides validation for changes in oxygenation. More significantly, TOLD response was found here to be related to radiation response, whereas no such stratification or correlation was seen with BOLD. T1 measurements typically require longer acquisition times and application of sequential pulse sequences, as presented here, may significantly increase study times, making it impractical for the clinic. In this regard innovative simultaneous measurements are being developed (50,51). In terms of potential clinical applications the signal to noise of individual images would be expected to be lower at 1.5 or 3 T in a large bore magnet, but this may be compensated by larger voxels. Relaxivity of oxygen in blood and tissue is reported to show complex effects on R1 and R2*, but effective studies of R1 and R2* response to oxygen breathing have been reported recently in human tumors (51).
Correlation between oxygen sensitive parameters is interesting, but ultimately the ability to predict therapeutic response is vital. As such the observation (Fig. 8) that tumors exhibiting significantly greater TOLD response (ΔR1 and ΔSI) had significantly longer tumor growth delay is promising. Specifically, those tumors showing small TOLD response to 100% O2 challenge (<1.5%ΔSI; <0.005 s−1 change in R1) showed no benefit compared with tumors in air-breathing rats. Binary stratification may be valuable in terms of defining the utility of O2-breathing during irradiation. It is also interesting to note the direct linear relationship between the time to quadruple in size (T4) and %ΔSI or ΔR1 (Fig. 8B, C). A similar result was reported in orthotopic C6 gliomas in rats subject to single high dose irradiation (52).
Others reported that, GH3 prolactinomas, which are highly vascularized, showed a significant BOLD response with respect to CB breathing challenge and experienced increased tumor growth delay in response to single dose radiation (17). There appeared to be a trend between magnitude of response (ΔR2*) and tumor volume 7 days after irradiation, although this was not explicitly stated. Meanwhile, RIF-1 tumors growing in mice showed minimal BOLD response and no benefit from CB, but a two-fold range in tumor volume 7 days following irradiation (17). We found no correlation between BOLD response and tumor growth delay for the AT1 tumors. Thus the relative utility of BOLD and TOLD may depend on tumor type.
FREDOM was used in this study to estimate the tumor pO2 and was correlated with BOLD and TOLD MRI. Relatively high pO2 values (>100 torr) were observed upon 100% O2/CB breathing in the tumor periphery (Fig. 1), which has also been noticed in previous studies using the AT1 tumor type (53). Thus, mean change in BOLD and pO2 measurements may have been dominated by extreme responses to 100% O2 or CB breathing. However, T1 oxygen dependence is more directly related to tissue pO2 and the TOLD responses tend to be considerably smaller than BOLD (typically, about 1/3) and thus, are less susceptible to large local perturbations. Thus, the TOLD response appeared less well correlated with 19F MRI pO2, but is more reflective of the whole volume and hence radiation response. Therefore, a large BOLD response may be relevant, but for relatively hypoxic tumors, such as the AT1 here, where most tumors exhibit a small response, then TOLD appears more relevant. Assessing these values with TOLD MRI provided better prediction to treatment response.
There remains controversy regarding the use of 100% O2 versus CB to modify tumor hypoxia with the goal of enhancing radiation response. Some studies have reported differential response to 100% O2 and CB (23,27,29). Here, as in our previous studies with various tumors (1,42,54,55), we found close correlations between the effects of the two gases (Figs. 3, 5 and 6). Most notably, the residual hypoxic fraction was essentially identical (Figs. 5C, 6C). Therefore, we used 100% O2 breathing with respect to irradiation since this will be more readily acceptable to patients. Indeed, our recent investigations regarding the feasibility of BOLD in humans have used oxygen breathing challenge (13,14).
Most patients still receive conventionally fractionated radiation therapy (CFRT), but hypofractionated regimens are gaining popularity due to the efficiency of fewer patient visits, opportunity for better treatment planning and development of enhanced targeting. Furthermore, in specific tumors SBRT (stereotactic body radiation therapy) has been found to provide significantly enhanced outcome (56). It is expected that hypoxia may influence each dose with little opportunity for the progressive reoxygenation thought to accompany CFRT (57). As such SBRT and adjuvant administration of hypoxic cell selective cytotoxins could be considered (58).
As noted by others, BOLD contrast imaging is sensitive to changes in vascular volume and flow as well as the inter conversion of oxy and deoxyhemoglobin (22,23). Additional challenges are provided by tissue interfaces and motion. In pre-clinical studies of subcutaneous tumors as used here, the tissues may be readily immobilized. In terms of semi-quantitative BOLD based on changes in signal intensity alone, tumor motion may prevent effective image co-registration for meaningful subtraction: indeed, we faced such a problem with bladder filling when examining cervical cancer in human patients (13). This was largely overcome by acquiring sagittal images, as opposed to transaxial. Likewise breast cancer imaging was more successful in the sagittal orientation since breathing artifacts were minimized. (14). Quantitative determination of R2* maps largely overcomes the spatial correlation issues, since histograms of population values may be compared for tumor tissue, even if voxel overlap is imperfect. Perhaps the most challenging situation is for imaging lung tumors in patients. Here, artifacts can arise from blood flow, and respiratory and cardiac motion. Breath-hold imaging has been attempted to immobilize the lung tumor during imaging, but, variation in diaphragm/lung position during different breath-holds can be encountered. In addition, most lung cancer patients cannot tolerate long breath-hold attempts. Respiratory-gating has been used to acquire images during expiration throughout the MRI exam to ensure the same anatomy was imaged, whereas sacrificing temporal resolution in the dynamic BOLD study (59). TOLD imaging tends to be slower and therefore even more susceptible to motion. In some cases, EPI sequences have proven successful as recently demonstrated in human mediastinal organs (kidney, spleen) (50), but in lung EPI is subject to severe distortions. As shown here, both R1 and R2* responses are related to pO2. We have recently shown that combined measurement of R1, R2 and blood volume fraction can provide estimates of pO2 without the need for exogenous reporter molecule (60). Currently, such measurements are relatively slow requiring 14 minutes per pO2 map and it remains to be seen whether they a provide superior prediction of radiation response.
There have been many attempts to assess and modulate tumor hypoxia prior to radiation. Approaches, as simple as inhalation of hyperoxic gases, have been successful in preclinical models (38,39), but translation to the clinic has shown marginal efficacy (1). It is suggested that the general lack of success has been inability to identify those tumors (patients) that would benefit from modified therapy. The correlations between BOLD, TOLD and pO2 measurements reported here provide further impetus for the use of non-invasive 1H MRI with respect to a hyperoxic gas challenge as surrogate biomarker for tumor oxygenation emphasizing potential value for clinical applications. Notably, the ability to stratify tumors based on hypoxia is particularly timely, since there are increasing opportunities to tailor therapy to tumor characteristics, potentially enhancing success through personalized medicine.
Acknowledgments
Supported in part by grants from the NIH NCI (R01 CA139043) and infrastructure provided by the Southwestern Small Animal Imaging Research Program (SW-SAIRP) supported in part by 1U24 CA126608, Simmons Cancer Center (P30 CA142543) and AIRC (NIH P41 RR02584). The small animal irradiator was purchased with funds from a Shared Instrumentation grant S10 RR028011.
References
- 1.Tatum JL, Kelloff GJ, Gillies RJ, Arbeit JM, Brown JM, Chao KS, Chapman JD, Eckelman WC, Fyles AW, Giaccia AJ, et al. Hypoxia: Importance in tumor biology, noninvasive measurement by imaging, and value of its measurement in the management of cancer therapy. Int J Radiat Biol. 2006;82(10):699–757. doi: 10.1080/09553000601002324. [DOI] [PubMed] [Google Scholar]
- 2.Gray L, Conger A, Ebert M, Hornsey S, Scott O. The concentration of oxygen dissolved in tissues at time of irradiation as a factor in radiotherapy. Br J Radiol. 1953;26:638–648. doi: 10.1259/0007-1285-26-312-638. [DOI] [PubMed] [Google Scholar]
- 3.Höckel M, Schlenger K, Aral B, Mitze M, Schäffer U, Vaupel P. Association between tumor hypoxia and malignant progression in advanced cancer of the uterine cervix. Cancer Res. 1996;56:4509–4515. [PubMed] [Google Scholar]
- 4.Fyles AW, Milosevic M, Wong R, Kavanagh MC, Pintilie M, Sun A, Chapman W, Levin W, Manchul L, Keane TJ, et al. Oxygenation predicts radiation response and survival in patients with cervix cancer. Radiother Oncol. 1998;48(2):149–156. doi: 10.1016/s0167-8140(98)00044-9. [DOI] [PubMed] [Google Scholar]
- 5.Brizel DM, Sibly GS, Prosmitz LR, Scher RL, Dewhirst MW. Tumor hypoxia adversely affects the prognosis of carcinoma of the head and neck. Int J Radiat Oncol Biol Phys. 1997;38:285–289. doi: 10.1016/s0360-3016(97)00101-6. [DOI] [PubMed] [Google Scholar]
- 6.Turaka A, Buyyounouski MK, Hanlon AL, Horwitz EM, Greenberg RE, Movsas B. Hypoxic Prostate/Muscle PO2 Ratio Predicts for Outcome in Patients With Localized Prostate Cancer: Long-Term Results. Int J Radiat Oncol Biol Phys. 2012;82(3):E433–E439. doi: 10.1016/j.ijrobp.2011.05.037. [DOI] [PubMed] [Google Scholar]
- 7.Alonzi R, Padhani AR, Maxwell RJ, Taylor NJ, Stirling JJ, Wilson JI, d’Arcy JA, Collins DJ, Saunders MI, Hoskin PJ. Carbogen breathing increases prostate cancer oxygenation: a translational MRI study in murine xenografts and humans. Br J Cancer. 2009;100(4):644–648. doi: 10.1038/sj.bjc.6604903. [DOI] [PMC free article] [PubMed] [Google Scholar]
- 8.Chopra S, Foltz WD, Milosevic MF, Toi A, Bristow RG, Menard C, Haider MA. Comparing oxygen-sensitive MRI (BOLD R2*) with oxygen electrode measurements: A pilot study in men with prostate cancer. Int J Radiat Biol. 2009;85(9):805– 813. doi: 10.1080/09553000903043059. [DOI] [PubMed] [Google Scholar]
- 9.Rijpkema M, Kaanders JH, Joosten FB, van der Kogel AJ, Heerschap A. Effects of breathing a hyperoxic hypercapnic gas mixture on blood oxygenation and vascularity of head-and-neck tumors as measured by magnetic resonance imaging. Int J Radiat Oncol Biol Phys. 2002;53:1185–1191. doi: 10.1016/s0360-3016(02)02825-0. [DOI] [PubMed] [Google Scholar]
- 10.Muller A, Remmele S, Wenningmann I, Clusmann H, Traber F, Flacke S, Konig R, Gieseke J, Willinek WA, Schild HH, et al. Intracranial Tumor Response to Respiratory Challenges at 3.0 T: Impact of Different Methods to Quantify Changes in the MR Relaxation Rate R2*. J Magn Reson Imaging. 2010;32(1):17–23. doi: 10.1002/jmri.22205. [DOI] [PubMed] [Google Scholar]
- 11.Taylor NJ, Baddeley H, Goodchild KA, Powell MEB, Thoumine M, Culver LA, Stirling JJ, Saunders MI, Hoskin PJ, Phillips H, et al. BOLD MRI of human tumor oxygenation during carbogen breathing. J Magn Reson Imaging. 2001;14(2):156–163. doi: 10.1002/jmri.1166. [DOI] [PubMed] [Google Scholar]
- 12.O’Connor JPB, Naish JH, Parker GJM, Waterton JC, Watson Y, Jayson GC, Buonaccorsi GA, Cheung S, Buckley DL, McGrath DM, et al. Preliminary Study of Oxygen-Enhanced Longitudinal Relaxation in MRI: a Potential Novel Biomarker of Oxygenation Changes in Solid Tumors. Int J Radiat Oncol Biol Phys. 2009;75(4):1209–1215. doi: 10.1016/j.ijrobp.2008.12.040. [DOI] [PubMed] [Google Scholar]
- 13.Hallac RR, Ding Y, Yuan Q, McColl RW, Lea J, Sims RD, Weatherall PT, Mason RP. Oxygenation in cervical cancer and normal uterine cervix assessed using blood oxygenation level-dependent (BOLD) MRI at 3T. NMR Biomed. 2012;25:1321–1330. doi: 10.1002/nbm.2804. [DOI] [PMC free article] [PubMed] [Google Scholar]
- 14.Jiang L, Weatherall PT, McColl RW, Tripathy D, Mason RP. Blood oxygenation level-dependent (BOLD) contrast magnetic resonance imaging (MRI) for prediction of breast cancer chemotherapy response: A pilot study. J Magn Reson Imaging. 2013;37:1083–1092. doi: 10.1002/jmri.23891. [DOI] [PubMed] [Google Scholar]
- 15.Neeman M, Dafni H, Bukhari O, Braun RD, Dewhirst MW. In vivo BOLD contrast MRI mapping of subcutaneous vascular function and maturation: Validation by intravital microscopy. Magn Reson Med. 2001;45(5):887–898. doi: 10.1002/mrm.1118. [DOI] [PubMed] [Google Scholar]
- 16.McPhail LD, Robinson SP. Intrinsic Susceptibility MR Imaging of Chemically Induced Rat Mammary Tumors: Relationship to Histologic Assessment of Hypoxia and Fibrosis. Radiology. 2010;254(1):110–118. doi: 10.1148/radiol.2541090395. [DOI] [PubMed] [Google Scholar]
- 17.Rodrigues LM, Howe FA, Griffiths JR, Robinson SP. Tumor R-2 * is a prognostic indicator of acute radiotherapeutic response in rodent tumors. J Magn Reson Imaging. 2004;19(4):482–488. doi: 10.1002/jmri.20024. [DOI] [PubMed] [Google Scholar]
- 18.Zhao D, Jiang L, Hahn EW, Mason RP. Comparison of 1H blood oxygen level-dependent (BOLD) and 19F MRI to investigate tumor oxygenation. Magn Reson Med. 2009;62(2):357–364. doi: 10.1002/mrm.22020. [DOI] [PMC free article] [PubMed] [Google Scholar]
- 19.Elas M, Williams BB, Parasca A, Mailer C, Pelizzari CA, Lewis MA, River JN, Karczmar GS, Barth ED, Halpern HJ. Quantitative tumor oxymetric images from 4D electron paramagnetic resonance imaging (EPRI): Methodology and comparison with blood oxygen level-dependent (BOLD) MRI. Magn Reson Med. 2003;49(4):682–691. doi: 10.1002/mrm.10408. [DOI] [PubMed] [Google Scholar]
- 20.Baudelet C, Gallez B. How does blood oxygen level-dependent (BOLD) contrast correlate with oxygen partial pressure (pO2) inside tumors? Magn Reson Med. 2002;48(6):980–986. doi: 10.1002/mrm.10318. [DOI] [PubMed] [Google Scholar]
- 21.Jordan BF, Crokart N, Baudelet C, Cron GO, Ansiaux R, Gallez B. Complex relationship between changes in oxygenation status and changes in R-2(*): The case of insulin and NS-398, two inhibitors of oxygen consumption. Magn Reson Med. 2006;56(3):637–643. doi: 10.1002/mrm.20963. [DOI] [PubMed] [Google Scholar]
- 22.Baudelet C, Gallez B. Current issues in the utility of blood oxygen level dependent MRI for the assessment of modulations in tumor oxygenation. Curr Med Imaging Rev. 2005;1:229–243. [Google Scholar]
- 23.Howe FA, Robinson SP, McIntyre DJO, Stubbs M, Griffiths JR. Issues in flow and oxygenation dependent contrast (FLOOD) imaging of tumours. NMR Biomed. 2001;14(7–8):497–506. doi: 10.1002/nbm.716. [DOI] [PubMed] [Google Scholar]
- 24.Fan XB, River JN, Zamora M, Al-Hallaq HA, Karczmar GS. Effect of carbogen on tumor oxygenation: Combined fluorine-19 and proton MRI measurements. Int J Radiat Oncol Biol Phys. 2002;54(4):1202–1209. doi: 10.1016/s0360-3016(02)03035-3. [DOI] [PubMed] [Google Scholar]
- 25.Dunn JF, O’Hara JA, Zaim-Wadghiri Y, Lei H, Meyerand ME, Grinberg OY, Hou H, Hoopes PJ, Demidenko E, Swartz HM. Changes in oxygenation of intracranial tumors with carbogen: a BOLD MRI and EPR oximetry study. J Magn Reson Imaging. 2002;16:511–521. doi: 10.1002/jmri.10192. [DOI] [PubMed] [Google Scholar]
- 26.Al-Hallaq HA, River JN, Zamora M, Oikawa H, Karczmar GS. Correlation of magnetic resonance and oxygen microelectrode measurements of carbogen-induced changes in tumor oxygenation. Int J Radiat Oncol Biol Phys. 1998;41(1):151–159. doi: 10.1016/s0360-3016(98)00038-8. [DOI] [PubMed] [Google Scholar]
- 27.Robinson SP, Howe FA, Rodrigues LM, Stubbs M, Griffiths JR. Magnetic resonance imaging techniques for monitoring changes in tumor oxygenation and blood flow. Semin Radiat Oncol. 1998;8(3):198–207. doi: 10.1016/s1053-4296(98)80045-3. [DOI] [PubMed] [Google Scholar]
- 28.Young IR, Clarke GJ, Bailes DR, Pennock JM, Doyle FH, Bydder GM. Enhancement of Relaxation Rate with Paramagnetic Contrast Agents in NMR Imaging. J Comp Tomogr. 1981;5(6):543–547. doi: 10.1016/0149-936x(81)90089-8. [DOI] [PubMed] [Google Scholar]
- 29.O’Connor JPB, Naish JH, Jackson A, Waterton JC, Watson Y, Cheung S, Buckley DL, McGrath DM, Buonaccorsi GA, Mills SJ, et al. Comparison of Normal Tissue R-1 and R-2* Modulation by Oxygen and Carbogen. Magn Reson Med. 2009;61(1):75–83. doi: 10.1002/mrm.21815. [DOI] [PubMed] [Google Scholar]
- 30.Matsumoto K, Bernardo M, Subramanian S, Choyke P, Mitchell JB, Krishna MC, Lizak MJ. MR assessment of changes of tumor in response to hyperbaric oxygen treatment. Magn Reson Med. 2006;56(2):240–246. doi: 10.1002/mrm.20961. [DOI] [PubMed] [Google Scholar]
- 31.Zhao D, Jiang L, Mason RP. Measuring Changes in Tumor Oxygenation. Methods Enzymol. 2004;386:378–418. doi: 10.1016/S0076-6879(04)86018-X. [DOI] [PubMed] [Google Scholar]
- 32.Liu S, Shah SJ, Wilmes LJ, Feiner J, Kodibagkar VD, Wendland MF, Mason RP, Hylton N, Hopf HW, Rollins MD. Quantitative tissue oxygen measurement in multiple organs using 19F MRI in a rat model. Magn Reson Med. 2011;66(6):1722–1730. doi: 10.1002/mrm.22968. [DOI] [PMC free article] [PubMed] [Google Scholar]
- 33.Baete SH, Vandecasteele J, Colman L, De Neve W, De Deene Y. An oxygen-consuming phantom simulating perfused tissue to explore oxygen dynamics and 19F MRI oximetry. Magn Reson Mat Phys Biol Med. 2010;23(4):217–226. doi: 10.1007/s10334-010-0219-6. [DOI] [PubMed] [Google Scholar]
- 34.Magat J, Jordan BF, Cron GO, Gallez B. Noninvasive mapping of spontaneous fluctuations in tumor oxygenation using F-19 MRI. Med Phys. 2010;37(10):5434–5441. doi: 10.1118/1.3484056. [DOI] [PubMed] [Google Scholar]
- 35.Peschke P, Hahn EW, Wenz F, Lohr F, Braunschweig F, Wolber G, Zuna I, Wannenmacher M. Differential Sensitivity of Three Sublines of the Rat Dunning Prostate Tumor System R3327 to Radiation and/or Local Tumor Hyperthermia. Radiat Res. 1998;150(4):423–430. [PubMed] [Google Scholar]
- 36.Peschke P, Karger CP, Scholz M, Debus J, Huber PE. Relative Biological Effectiveness of Carbon Ions for Local Tumor Control of a Radioresistant Prostate Carcinoma in the Rat. Int J Radiat Oncol Biol Phys. 2011;79(1):239–246. doi: 10.1016/j.ijrobp.2010.07.1976. [DOI] [PubMed] [Google Scholar]
- 37.Pidikiti R, Stojadinovic S, Speiser M, Song KH, Hager F, Saha D, Solberg TD. Dosimetric characterization of an image-guided stereotactic small animal irradiator. Phys Med Biol. 2011;56(8):2585–2599. doi: 10.1088/0031-9155/56/8/016. [DOI] [PubMed] [Google Scholar]
- 38.Zhao D, Ran S, Constantinescu A, Hahn EW, Mason RP. Tumor oxygen dynamics: correlation of in vivo MRI with histological findings. Neoplasia. 2003;5(4):308–318. doi: 10.1016/S1476-5586(03)80024-6. [DOI] [PMC free article] [PubMed] [Google Scholar]
- 39.Bourke VA, Zhao D, Gilio J, Chang C-H, Jiang L, Hahn EW, Mason RP. Correlation of Radiation Response with Tumor Oxygenation in the Dunning Prostate R3327-AT1 Tumor. Int J Radiat Oncol Biol Phys. 2007;67(4):1179–1186. doi: 10.1016/j.ijrobp.2006.11.037. [DOI] [PMC free article] [PubMed] [Google Scholar]
- 40.Procissi D, Claus F, Burgman P, Koziorowski J, Chapman JD, Thakur SB, Matei C, Ling CC, Koutcher JA. In vivo F-19 magnetic resonance spectroscopy and chemical shift imaging of tri-fluoro-nitroimidazole as a potential hypoxia reporter in solid tumors. Clin Cancer Res. 2007;13(12):3738–3747. doi: 10.1158/1078-0432.CCR-06-1563. [DOI] [PubMed] [Google Scholar]
- 41.Le D, Mason RP, Hunjan S, Constantinescu A, Barker BR, Antich PP. Regional tumor oxygen dynamics: 19F PBSR EPI of hexafluorobenzene. Magn Reson Imaging. 1997;15(8):971–981. doi: 10.1016/s0730-725x(97)00035-0. [DOI] [PubMed] [Google Scholar]
- 42.Hunjan S, Zhao D, Constantinescu A, Hahn EW, Antich PP, Mason RP. Tumor Oximetry: demonstration of an enhanced dynamic mapping procedure using fluorine-19 echo planar magnetic resonance imaging in the Dunning prostate R3327-AT1 rat tumor. Int J Radiat Oncol Biol Phys. 2001;49:1097–1108. doi: 10.1016/s0360-3016(00)01460-7. [DOI] [PubMed] [Google Scholar]
- 43.Nozue M, Lee I, Yuan F, Teicher BA, Brizel DM, Dewhirst MW, Milross CG, Milas L, Song CW, Thomas CD, et al. Interlaboratory variation in oxygen tension measurement by Eppendorf “Histograph” and comparison with hypoxic marker. J Surg Oncol. 1997;66(1):30–38. doi: 10.1002/(sici)1096-9098(199709)66:1<30::aid-jso7>3.0.co;2-o. [DOI] [PubMed] [Google Scholar]
- 44.Fan X, River JN, Zamora M, Al-Hallaq HA, Karczmar GS. Effect of carbogen on tumor oxygenation: combined fluorine-19 and proton MRI measurements. Int J Radiat Oncol Biol Phys. 2002;54:1202–1209. doi: 10.1016/s0360-3016(02)03035-3. [DOI] [PubMed] [Google Scholar]
- 45.Baudelet C, Gallez B. How does blood oxygen level-dependent (BOLD) contrast correlate with oxygen partial pressure (pO2) inside tumors? Magn Reson Med. 2002;48:980–986. doi: 10.1002/mrm.10318. [DOI] [PubMed] [Google Scholar]
- 46.Hoskin PJ, Carnell DM, Taylor NJ, Smith RE, Stirling JJ, Daley FM, Saunders MI, Bentzen SM, Collins DJ, d’Arcy JA, et al. Hypoxia in Prostate Cancer: Correlation of BOLD-MRI With Pimonidazole Immunohistochemistry--Initial Observations. Int J Radiat Oncol Biol Phys. 2007;68(4):1065–1071. doi: 10.1016/j.ijrobp.2007.01.018. [DOI] [PubMed] [Google Scholar]
- 47.Christen T, Lemasson B, Pannetier N, Farion R, Remy C, Zaharchuk G, Barbier EL. Is T2* Enough to Assess Oxygenation? Quantitative Blood Oxygen Level Dependent Analysis in Brain Tumor. Radiology. 2012;262(2):495–502. doi: 10.1148/radiol.11110518. [DOI] [PMC free article] [PubMed] [Google Scholar]
- 48.Robinson SP, Rijken PF, Howe FA, McSheehy PM, van der Sanden BP, Heerschap A, Stubbs M, Van Der Kogel AJ, Griffiths JR. Tumor vascular architecture and function evaluated by non-invasive susceptibility MRI methods and immunohistochemistry. J Magn Reson Imaging. 2003;17:445–454. doi: 10.1002/jmri.10274. [DOI] [PubMed] [Google Scholar]
- 49.Winter JD, Akens MK, Cheng H-LM. Quantitative MRI assessment of VX2 tumour oxygenation changes in response to hyperoxia and hypercapnia. Phys Med Biol. 2011;56(5):1225. doi: 10.1088/0031-9155/56/5/001. [DOI] [PubMed] [Google Scholar]
- 50.Ding Y, Mason RP, McColl RW, Yuan Q, Hallac RR, Sims RD, Weatherall PT. Simultaneous Measurement of TOLD and BOLD Effects in Abdominal Tissue Oxygenation Level Studies. J Magn Reson Imaging. doi: 10.1002/jmri.24006. accepted 2012. [DOI] [PubMed] [Google Scholar]
- 51.Remmele S, Sprinkart AM, Müller A, Träber F, von Lehe M, Gieseke J, Flacke S, Willinek WA, Schild HH, Sénégas J, et al. Dynamic and simultaneous MR measurement of R(1) and R(2) * changes during respiratory challenges for the assessment of blood and tissue oxygenation. Magn Reson Med. 2012 Aug 24; doi: 10.1002/mrm.24458. [Epub ahead of print] [DOI] [PubMed] [Google Scholar]
- 52.Arias N, Pacheco-Torres J, López-Larrubia P. Predicting response to hyperbaric oxygen radiotherapy treatment in high grade gliomas using Magnetic Resonance Imaging techniques. Proc ISMRM; 2012; Melbourne. p. 852. [Google Scholar]
- 53.Mason RP, Antich PP, Babcock EE, Constantinescu A, Peschke P, Hahn EW. Non-invasive determination of tumor oxygen tension and local variation with growth. Int J Radiat Oncol Biol Phys. 1994;29:95–103. doi: 10.1016/0360-3016(94)90231-3. [DOI] [PubMed] [Google Scholar]
- 54.Gu Y, Bourke V, Kim JG, Constantinescu A, Mason RP, Liu H. Dynamic Response of Breast Tumor Oxygenation to Hyperoxic Respiratory Challenge Monitored with Three Oxygen-Sensitive Parameters. Appl Optics. 2003;42:1–8. doi: 10.1364/ao.42.002960. [DOI] [PubMed] [Google Scholar]
- 55.Zhao D, Constantinescu A, Hahn EW, Mason RP. Tumor oxygen dynamics with respect to growth and respiratory challenge: investigation of the Dunning prostate R3327-HI tumor. Radiat Res. 2001;156:510–520. doi: 10.1667/0033-7587(2001)156[0510:todwrt]2.0.co;2. [DOI] [PubMed] [Google Scholar]
- 56.Timmerman R, Paulus R, Galvin J, Michalski J, Straube W, Bradley J, Fakiris A, Bezjak A, Videtic G, Johnstone D, et al. Stereotactic Body Radiation Therapy for Inoperable Early Stage Lung Cancer. JAMA. 2010;303(11):1070–1076. doi: 10.1001/jama.2010.261. [DOI] [PMC free article] [PubMed] [Google Scholar]
- 57.Carlson DJ, Keall PJ, Loo BW, Chen ZJ, Brown JM. Hypofractionation Results in Reduced Tumor Cell Kill Compared to Conventional Fractionation for Tumors with Regions of Hypoxia. Int J Radiat Oncol Biol Phys. 2011;79(4):1188–1195. doi: 10.1016/j.ijrobp.2010.10.007. [DOI] [PMC free article] [PubMed] [Google Scholar]
- 58.Brown JM, Diehn M, Loo BW., Jr Stereotactic Ablative Radiotherapy Should Be Combined With a Hypoxic Cell Radiosensitizer. Int J Radiat Oncol Biol Phys. 2010;78(2):323–327. doi: 10.1016/j.ijrobp.2010.04.070. [DOI] [PMC free article] [PubMed] [Google Scholar]
- 59.Yuan Q, Ding Y, Hallac RR, Sims RD, Weatherall PT, Boike T, Timmerman R, Mason RP. Feasibility of BOLD Magnetic Resonance Imaging of Lung Tumors at 3 T. Proc ISMRM; 2010; Stockholm, Sweden. p. 1093. [Google Scholar]
- 60.Zhang Z, Hallac RR, Peschke P, Mason RP. A noninvasive tumor oxygenation imaging strategy using magnetic resonance imaging of endogenous blood and tissue water. Magn Reson Med. 2013 doi: 10.1002/mrm.24691. in press. [DOI] [PMC free article] [PubMed] [Google Scholar]


