

Abstract
Smoking is a major risk factor for several somatic diseases, and is also emerging as a causal factor for neuropsychiatric disorders. Genome-wide association (GWA) and candidate gene studies for smoking behavior and nicotine dependence (ND) have disclosed too few predisposing variants to account for the high estimated heritability. Prior large-scale GWA studies have had very limited phenotypic definitions of relevance to smoking-related behavior, which has likely impeded the discovery of genetic effects. We performed genome-wide association analyses on 1114 adult twins ascertained for ever smoking from the population-based Finnish Twin Cohort study. The availability of 17 smoking-related phenotypes allowed us to comprehensively portray the dimensions of smoking behavior, clustered into the domains of smoking initiation, amount smoked, and ND. Our results highlight a locus on 16p12.3, with several SNPs in the vicinity of CLEC19A showing association (P<1×10⁻⁶) with smoking quantity. Interestingly, CLEC19A is located close to a previously reported attention deficit hyperactivity disorder (ADHD) linkage locus and an evident link between ADHD and smoking has been established. Intriguing preliminary association (P<1×10⁻⁵) was detected between DSM-IV ND diagnosis and several SNPs in ERBB4, coding for a Neuregulin receptor, on 2q33. The association between ERBB4 and DSM-IV ND diagnosis was replicated in an independent Australian sample. Interestingly, in the paper by Turner et al., significant increase in ErbB4 and Neuregulin 3 (Nrg3) expression was revealed following chronic nicotine exposure and withdrawal in mice. Turner et al. also detected an association between NRG3 SNPs and smoking cessation success in a clinical trial. ERBB4 has previously been associated with schizophrenia; further, it is located within an established schizophrenia linkage locus and within a linkage locus for a smoker phenotype identified in this sample. As a conclusion, we disclose novel tentative evidence for the involvement of ERBB4 in ND, suggesting the involvement of the Neuregulin/ErbB signalling pathway in addictions and providing a plausible link between the high co-morbidity of schizophrenia and ND.
Keywords: genome-wide association analysis, nicotine dependence, smoking behavior, smoking quantity, schizophrenia, ADHD
INTRODUCTION
Smoking has an established impact on several somatic conditions, such as chronic obstructive pulmonary disease, peripheral arterial disease, and various cancers 1. Further, smoking may not merely be a consequence but also a causal factor in the etiology of several common mental disorders, with growing evidence supporting the causal effect of cigarette smoking on risk of depression 2–4. However, the epidemiology of the association and underlying mechanisms are less understood than the established impact of smoking on somatic conditions 5. Persistent smoking is principally sustained by nicotine dependence (ND) which is a complex phenotype with physiological, pharmacological, social, and psychological dimensions 6. ND can be measured in various distinct ways, ranging from interview assessments based on DSM-IV (Diagnostic and Statistical Manual of Mental Disorders, 4th edition) 7 for a ND diagnosis to simple questionnaires, such as the Fagerström Test for Nicotine Dependence (FTND 8. Furthermore, the number of cigarettes smoked per day (CPD) has been widely used in genetic association studies, with heavy smoking commonly considered as a proxy for ND.
While many aspects of the biology of ND are known 6, the underlying genetic architecture is still largely uncharted. ND has a notable heritability (estimates ranging from 40% to 75%) 9, yet candidate gene and genome-wide association (GWA) studies have pinpointed only a handful of genes. A robust smoking behavior locus was established in 2008, with three GWA studies reporting association between the CHRNA5-CHRNA3-CHRNB4 nicotinic acetylcholine receptor (nAChR) gene cluster on 15q24–25 and lung cancer risk as well as CPD and ND measured by FTND 10–12, though less than 1% of the variance in amount smoked was explained by alleles of these genes 12. The proportion of variance explained increases almost five-fold when a biomarker of nicotine intake is used instead of CPD 13, suggesting that simple self-reported phenotypes measuring smoking behavior may not adequately reflect nicotine intake. Consideration of phenotype quality and precision may be more beneficial than recruitment of increasing numbers of subjects with crude phenotypes 14. By utilizing detailed phenotype profiles we have detected novel associations between the CHRNA5-CHRNA3-CHRNB4 gene cluster and various measures of ND, such as DSM-IV ND symptoms and the Nicotine Dependence Syndrome Scale (NDSS 15) tolerance subscale 16. The evidence supporting the involvement of nAChRs in the etiology of ND is indisputable and supported by their central role in mediating the rewarding effects of nicotine 6. However, variants in nAChR genes likely account for a minor fraction of the phenotypic variance; thus, other predisposing genes are bound to exist.
Evidence for predisposing loci outside the 15q24–25 locus has clearly been weaker. In 2007, the first two modestly-powered GWA studies suggested several potential genes, but with negligible overlap between the findings 17,18. In 2010, three meta-analyses assessed GWA studies with data on smoking-related phenotypes; however, all these consortia had limited smoking-related phenotypes (ever/never smoked, age at initiation, amount smoked, and cessation) 19–21. Despite a combined sample size of over 140 000 subjects, only a handful of loci achieved genome-wide significance. Various approaches have been utilized for mining the GWA data. A two-stage approach with preliminary set of SNPs identified in a discovery set followed by replication in an independent sample has been commonly employed 18,22–25. Alternatively, convergent evidence for the relevance of detected signals has been quested by pathway analyses and visualization of functional networks 22,24 as well as by scrutiny for pleiotropic effects 17. Some studies have clustered nominally significant SNPs located within a confined distance 26, while others have focused on a priori candidate genes 27. Finally, meta-analyses, either genome-wide 19–21,28 or among selected variants 24,29 have been used to gain statistical power and to demonstrate the analogical impact of the identified variants across various cohorts and populations.
Here, we utilized a Finnish twin sample (N=1114) ascertained for smoking with exceptionally detailed phenotype profiles and a genetically homogenous background. In our GWA analyses we included a total of 17 phenotypes, clustered into the domains of smoking initiation, amount smoked, and ND, in order to comprehensively portray the dimensions of smoking behavior. We listed all preliminary associating SNPs (P<1×10⁻⁵) and identified all genes with at least one such SNP within ±50kb flanking of the gene. In order to nominate genes likely to be involved in the etiology of smoking behavior we collected convergent data, i.e., supporting evidence for the involvement of the genes by utilizing several sources.
MATERIAL AND METHODS
Subjects
The sample collection has been previously described in detail 30–32. Briefly, the study sample was ascertained from the Finnish Twin Cohort study consisting of altogether 35834 adult twins born in 1938–1957. Based on earlier data, the twin pairs concordant for ever-smoking were identified and recruited along with their family members (mainly siblings) for the Nicotine Addiction Genetics (NAG) Finland study (N=2265), as part of the consortium including Finland, Australia, and USA. Twin pairs concordant for heavy smoking were primarily targeted in order to increase the genetic load. Data collection took place in 2001–2005. The GWA study sample consisted of 1114 individuals (62% males; mean age 55.0 years) including 914 dizygotic (DZ) twin individuals (both co-twins per twin pair were included), 138 monozygotic (MZ) twin individuals (one co-twin per twin pair was included), and 62 other family members. Ninety-eight percent had smoked 100 or more cigarettes over their lifetime and the average number of CPD was 19.8 (SD 9.6). The study was approved by the Ethics committee of the Hospital District of Helsinki and Uusimaa, Finland, and by the IRB of Washington University, St. Louis, Missouri, USA. Altogether 207 of the 1114 subjects have been previously used in a chromosome 15q25 meta-analysis 29 and altogether 733 subjects were used in a meta-analysis scrutinizing the rs16969968 variant on 15q25 33.
For replication of the most interesting signals we utilized a longitudinal Finnish twin study of adolescents and young adults (FT12, N=869; sample demographics previously described in 34 and an Australian twin family sample (NAG-OZALC, N=4425; sample demographics previously described in 35.
Phenotypes
Participants were interviewed using the diagnostic Semi-Structured Assessment for the Genetics of Alcoholism (SSAGA) 36 protocol including an additional section on smoking behavior and ND adapted from the Composite International Diagnostic Interview (CIDI) 37. The customized computer-assisted telephone interviews included more than 100 questions on smoking behavior. All participants provided written informed consent. All phenotypes used in analyses are based on the interview data (except for questionnaire survey for NDSS). The examined binary, continuous, and categorical smoking related phenotypes are divided into three groups: (I) smoking initiation (age at first puff, age at first cigarette, second cigarette, age of onset of weekly smoking, age of onset of daily smoking, first time sensation), (II) amount smoked (CPD, maximum CPD), and (III) nicotine dependence (DSM-IV ND diagnosis, DSM-IV ND symptoms, FTND (≥4), FTND score, FTND time to first cigarette (TTF), NDSS drive/priority factor, NDSS stereotypy/continuity factor, NDSS tolerance factor, NDSS sum score). Phenotype definitions are presented in Supplemental table 1, and their inter-correlations are in Supplemental table 2. For the majority of the traits, modest to high heritability estimates have been previously reported (Supplemental table 3). When calculating MZ and DZ correlations among 116 MZ pairs and 429 DZ pairs identified from the Finnish NAG study sample, MZ correlations were greater than DZ correlations for all of the traits (Supplemental table 3), providing evidence for the involvement of genetic factors. As our study sample has been ascertained for heavy smoking, the pattern and point estimates of MZ and DZ correlations are likely to be somewhat different from an unselected population sample. Based on an analysis of the phenotype correlation matrix 38 the number of independent traits was 11. We conducted post hoc analyses for those genes highlighted in our study that were previously associated with smoking cessation. In these analyses, we included only ever smokers (N=1095, 98.3% of the sample) and coded former smokers (N=549) i.e., successful quitters, as ‘affected’, and utilized all SNPs with ±50kb flanking of the genes.
In an attempt to replicate the most interesting findings in the NAG-OZALC sample we utilized CPD, maximum CPD, age of onset of weekly smoking, TTF, DSM-IV ND diagnosis, FTND (≥4), and NDSS drive/priority factor. In the FT12 replication sample we utilized CPD, maximum CPD, FTND (≥4), TTF, schizotypy (assessed by the Schizotypal Personality Questionnaire -Brief, SPQ-B 39, with three dimensions: cognitive-perceptual, interpersonal, and disorganization 40, DSM-IV attention deficit hyperactivity disorder (ADHD) symptoms, and three cognitive functions previously showing association in a Finnish schizophrenia sample (Wedenoja et al., unpublished data) (verbal attention: ‘Digit span forward’ from Wechsler Memory Scale-Revised, verbal ability: ‘Vocabulary’ from Wechsler Adult Intelligence Scale-Revised, and executive functioning: ‘Trail Making B’ from Trail Making Test).
Genotyping
Genotyping was performed at the Welcome Trust Sanger Institute (Hinxton, UK) on the Human670-QuadCustom Illumina BeadChip (Illumina, Inc., San Diego, CA, USA), as previously described 16. Imputation was performed by using IMPUTE v2.1.0 41 with the reference panel HapMap rel#24 CEU - NCBI Build 36 (dbSNP b126). The posterior probability threshold for "best-guess" imputed genotype was 0.9. Genotypes below the threshold were set to missing. Genotypes for altogether 2 614 137 polymorphic markers were available for analysis.
For the replication sample sets genotype data were derived from previously conducted genome-wide genotyping studies with either HapMap or 1000 Genomes (http://www.1000genomes.org/) imputation data available. The FT12 samples were genotyped on the Human670-QuadCustom Illumina BeadChip (Illumina, Inc.) at the Welcome Trust Sanger Institute (Hinxton, UK). The NAG-OZALC samples were genotyped on Illumina platforms, including the Illumina CNV370-Quadv3 platform (Illumina, Inc.) by the Center for Inherited Disease Research (Baltimore, Maryland, USA) and by deCODE (Reykjavik, Iceland), the Illumina 317K platform by the University of Helsinki Genome Center (Helsinki, Finland), and the Illumina 610 Quad platform by deCODE.
Statistical analyses summary
Details of the statistical analyses are presented in Supplemental Note. Briefly, the GWA analyses were performed with Plink 1.07 42 (http://pngu.mgh.harvard.edu/purcell/plink/). The QFAM family-based test of association in Plink was used for quantitative and categorical traits. QFAM performs a simple linear regression of phenotype on genotype. Adaptive permutation (up to 1×10⁹ permutations) was used to correct for family structures. The DFAM family-based test of association in Plink was used for the analysis of binary traits. DFAM implements the sib-TDT (transmission disequilibrium test) and also allows for unrelated individuals (i.e., singletons) to be included. Furthermore, the ‘non-founders’ option was used, as our sample contains no parents.
The linkage disequilibrium (LD) between SNPs was estimated among nonrelated individuals (one per family) in the study sample and HapMap2 release 24 CEU individuals by using Haploview 4.2 43. All genotyped and imputed SNPs within the region were considered when estimating the LD structures. The number of independent SNPs in the top loci was estimated with SNPSpD 38. Gene-based analyses were performed for all the genes with at least one SNP with P<1×10⁻⁵ within ±50kb of the gene. For binary traits we utilized VEGAS (Versatile Gene-based Association Study, http://gump.qimr.edu.au/VEGAS/) 44 which performs gene-based tests for association using the results from genetic association studies. VEGAS reads in SNP association p-values, annotates SNPs according to their position in genes, produces a gene-based test statistic, and then uses simulation to calculate an empirical gene-based P-value. As VEGAS failed to report gene-based P-values for several of the genes, we utilized the set-based test in Plink 1.07 for quantitative traits. This model takes into account the inter-marker LD and uses permutation to correct for multiple SNPs in the defined sets of independent SNPs. Family structures were ignored as the set-based test only works in the case-control setting.
To estimate effect sizes for the five loci highlighted in the GWA analyses we conducted linear and logistic regression analyses with the additive model in Stata 11.1 45.
As our sample size is limited, we did not anticipate genome-wide significant findings but rather decided to use a more liberal P-value threshold as a starting point for the gene discovery process. First we identified SNPs with P<1×10⁻⁵ (considered as ‘preliminary association’) and then identified all genes with at least one such SNP within ±50kb flanking of the gene. This was primarily done based on feasibility, as a more stringent threshold (e.g. P<1×10⁻⁶) would have resulted in the inclusion of only a handful of SNPs in the quest for convergent data. On the other hand, a less stringent threshold (e.g. P<1×10⁻⁴) would have resulted in an overwhelming number of signals to be followed up. In order to mitigate false negative discovery rate we gathered supporting evidence for the involvement of the genes by utilizing (a) gene-based analyses, (b) in silico replication utilizing previously published GWA and linkage loci for smoking related traits as well as reported associations for other substance use or dependence, as the high rates of co-morbid dependence to different substances suggest shared underlying architecture, (c) pleiotropic signals, i.e., association signals emerging also for other studied traits, and (d) relevance of known function. Finally, we focused on signals with P<1×10⁻⁶ (P-values an order of magnitude lower than those identified as ‘preliminary association’ were considered as ‘approaching genome-wide significance’) and the functionally highly relevant ERBB4, and attempted replication in two independent data sets. Genes with supporting evidence from at least one additional source were nominated as likely to be involved in the etiology of smoking behavior.
RESULTS
Genome-wide plots of p-values for all 17 traits are presented in Supplemental figure 1. Regional plots for the five highlighted loci are presented in Figure 1 and in Supplemental figure 2. We detected a total of 327 SNPs with P<1×10⁻⁵ (Supplemental table 4) and 55 genes with at least one such SNP within ±50kb flanking of the gene (Supplemental table 5). Altogether four loci (16p12.3, 10p11.21, 15q22.2, and 2q21.2) approached genome-wide significance (P<1×10⁻⁶) (Table 1).
Figure 1.
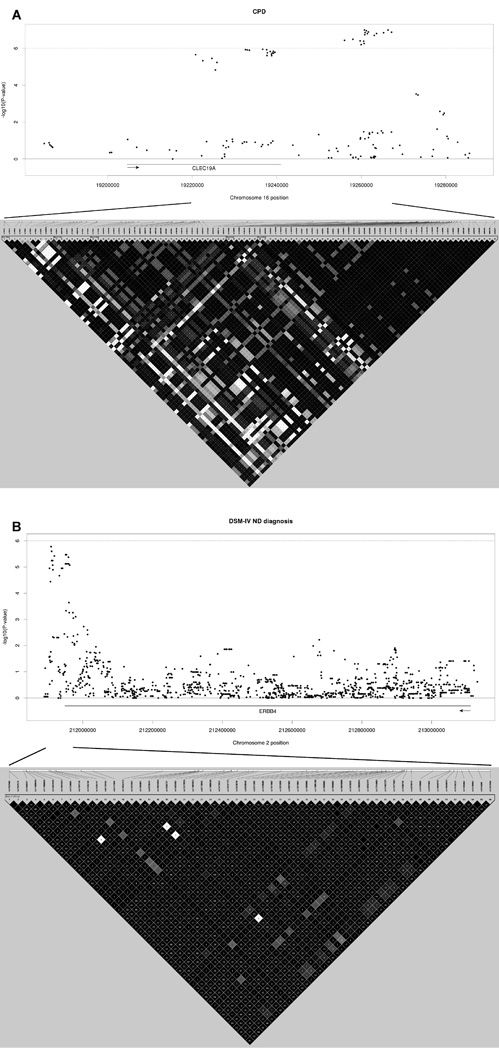
Regional plots for (A) the 16p12.3 (CLEC19A) CPD locus, and (B) the 2q33 (ERBB4) DSM-IV ND locus. The top panel shows the SNP association results including 20 kb flanking regions from the association locus. Arrow indicates the direction of the gene. The bottom panel shows the LD structure of the locus in the study sample (one individual per family, index twin prioritized), including the SNPs in Table 1 as well as all the intermediate SNPs. The boxes are shaded according to D’ values (darker shading indicated higher LD), and the numbers in the boxes are the r2 values (empty boxes represent full LD).
Table 1.
Four loci approaching genome-wide significance (P<1×10⁻⁶), and the 2q33 locus harboring ERBB4. Best SNP for each LD block is listed. All associating SNPs are listed in Supplemental table 4.
| rs-number | LD block1 | position | MAF | P-value | location | beta | 95% CI | P-value |
|---|---|---|---|---|---|---|---|---|
| CLEC19A on 16p12.3 - Smoking quantity (cigarettes per day, CPD) | ||||||||
| rs179218 | 1 | 19220801 | 0.06 | 2.22×10⁻⁶ | intron of CLEC19A | 4.265 | 2.312, 6.219 | 8.93×10⁻⁶ |
| rs8045533 | 2 | 19236668 | 0.04 | 1.14×10⁻⁶ | 7kb from CLEC19A, 93kb
from TMC5 |
5.206 | 2.892, 7.520 | 4.94×10⁻⁶ |
| rs1156327 | 3 | 19256025 | 0.04 | 3.70×10⁻⁷ | 26kb from CLEC19A, 74kb
from TMC5 |
5.678 | 3.295, 8.061 | 1.43×10⁻⁶ |
| rs762762 | 4 | 19260747 | 0.05 | 1.02×10⁻⁷ | 31kb from CLEC19A, 69kb
from TMC5 |
5.412 | 3.204, 7.620 | 7.55×10⁻⁷ |
| PARD3 on 10p11.22 - NDSS drive/priority factor | ||||||||
| rs1946931G | 1 | 34485425 | 0.02 | 7.61×10⁻⁷ | intron of PARD3 | 0.705 | 0.397, 1.014 | 3.56×10⁻⁶ |
| rs16935154 | 2 | 34492659 | 0.02 | 7.19×10⁻⁶ | intron of PARD3 | 0.676 | 0.360, 0.991 | 1.28×10⁻⁵ |
| rs10508797 | 3 | 34496537 | 0.02 | 6.81×10⁻⁶ | intron of PARD3 | 0.676 | 0.360, 0.991 | 1.28×10⁻⁵ |
| LACTB on 15q22.2 - FTND time to first cigarette (TTF) | ||||||||
| rs2652813G | 1 | 61192419 | 0.27 | 2.54×10⁻⁷ | 9kb from LACTB, 71kb from TPM1 | −0.353 | −0.487, − 0.219 |
1.17×10⁻⁷ |
| 2q21 - Age of onset of weekly smoking | ||||||||
| rs4954080G | 1 | 134296992 | 0.20 | 5.35×10⁻⁷ | 254kb from NCKAP5, 431kb
from MGAT5 |
0.881 | 0.535, 1.226 | 2.72×10⁻⁷ |
| rs1348835 | 2 | 134306137 | 0.18 | 1.63×10⁻⁶ | 264kb from NCKAP5, 422kb
from MGAT5 |
0.927 | 0.550, 1.304 | 6.83×10⁻⁷ |
| rs4953896 | 3 | 134317046 | 0.18 | 9.14×10⁻⁷ | 275kb from NCKAP5, 411kb
from MGAT5 |
0.934 | 0.559, 1.310 | 5.04×10⁻⁷ |
| ERBB4 on 2q33 - DSM-IV ND diagnosis | ||||||||
| rs7562566G | 1 | 211909126 | 0.39 | 1.68×10⁻⁶ | 40kb from ERBB4 | 1.424 | 1.201, 1.689 | 2.35×10⁻⁵ |
LD, linkage disequilibrium; position, base pair position according to NCBI36/hg18; MAF, minor allele frequency; CI, confidence interval; G, genotyped (all others imputed); 1, all genotyped and imputed SNPs within the association region were considered
16p12.3 (CLEC19A) smoking quantity (CPD) locus
Altogether 17 SNPs on 16p12.3 located close to CLEC19A (C-type lectin domain family 19, member A) showed association with CPD (best rs762762, P=1.02×10⁻⁷) (Table 1). Eighteen additional nearby SNPs showed preliminary association (P<1×10⁻⁵) with CPD. These 35 SNPs cluster within a 46-kb region, fall into four distinct LD blocks (Figure 1A), and are correlated (r2 range 0.55–1.00), representing an estimated number of 1.6 independent SNPs. Significant effect sizes were obtained for SNPs in each of the blocks (beta range 4.27–5.68), roughly corresponding to an increment of five cigarettes per day for each allele of the locus (Table 1). Gene-based analysis yielded a P-value of 2.60×10⁻⁷ (Table 2). Altogether 16 out of the 35 SNPs showed preliminary association (P<1×10⁻⁵) with maximum CPD (Supplemental table 4). In the NAG-OZALC replication sample a single SNP showed association with CPD (P=8.38×10⁻⁴), while all other CLEC19A SNPs yielded P-values in the range of 10−1–10−2 (Supplemental table 6). In the smaller FT12 replication sample no association was seen.
Table 2.
List of 33 genes plausibly involved in the tested smoking related traits. For each gene, convergent data from multiple sources is presented.
| Chr | Gene | Trait 1 | No. of genotyped SNPs / SNPs with P<1×10⁻⁵ / SNPs with P<1×10−62 |
Gene- based association P-value 3 |
Replication4 | Pleiotropic
signals (P≤10−4) (correlation with the primary associating trait is indicated in parentheses) 5 |
Phenotype showing association in a previous smoking related GWA study 6 |
Phenotype showing association in a previous GWA study of use/dependence on other substances7 |
Overlapping smoking behavior/ND linkage locus identified in the same Finnish sample 8 or in a meta-analysis 9 |
Relevant known / suspected function 10 |
|---|---|---|---|---|---|---|---|---|---|---|
| 1p31.1 | AK5 | Age of onset of weekly smoking |
375 / 2 / 0 | 1.77×10⁻³ | Age of onset of daily smoking (0.87), Age at first cigarette (0.71) |
Substance use 15 illicit drug dependence 16 metamphetamine dependence 17 |
||||
| 2p25.2- p25.1 |
RNF144A | NDSS sum score |
282 / 1 / 0 | 5.21×10⁻⁴ | FTND score (0.62), CPD (0.48) |
Smoking cessation 11 |
||||
| 2q14.3 | CNTNAP5 | NDSS sum score |
916 / 1 / 0 | 3.42×10⁻³ | Meta-analysis: Max CPD locus on 2q12.3- q22.3. |
Belongs to the neurexin family, members of which function in the vertebrate nervous system as cell adhesion molecules and receptors. |
||||
| 2q22.1 | THSD7B | First time sensations |
689 / 2 / 0 | 3.96×10⁻⁴ | Alcohol dependence 18 | Meta-analysis: Max CPD locus on 2q12.3- q22.3. |
||||
| 2q32.1 | FSIP2 | First time sensations |
105 / 5 / 0 | 3.90×10⁻⁵ | Alcohol withdrawal 19 | |||||
| 2q33.2 | CD28 | DSM-IV ND symptoms |
72 / 4 / 0 | 3.50×10⁻⁵ | Finnish sample: 2q33 smoker locus. |
|||||
| 2q33.3- q34 |
ERBB4 | DSM-IV ND diagnosis |
1349 / 17 / 0 |
9.94×10⁻³ | Association with DSM-IV ND in the NAG- OZALC Sample (P=10−4) |
DSM-IV ND symptoms (0.93) |
Alcohol dependence 20 | Finnish sample: 2q33 smoker locus. Meta- analysis: Max CPD locus on 2q34-q37.1. |
Member of the tyrosine protein kinase family and the epidermal growth factor receptor subfamily, acts as cell-surface receptor for neuregulins (NRG1,NRG2, NRG3, and NRG4). |
|
| 3q21.1 | KALRN | DSM-IV ND diagnosis |
679 / 1 / 0 | 3.11×10⁻³ | Protein kinase, involved in e.g. nerve growth factor receptor signaling pathway and nervous system development. |
|||||
| 4p14 | TMEM156 | DSM-IV ND symptoms |
146 / 2 / 0 | 6.19×10⁻⁴ | Meta-analysis: FTND locus on 4p15.32-p12. |
|||||
| 4q12 | LNX1 | Second cigarette |
233 / 1 / 0 | 6.56×10⁻³ | Smoking cessation 12 |
Direct interaction between ErbB2 and LNX1 (Young et al. Mol Cell Neurosci. 2005; 30(2): 238–248) |
||||
| 5q15 | POLD2D1 | NDSS tolerance factor |
50 / 5 / 0 | 3.00×10⁻⁵ | NDSS sum score (0.60) |
Meta-analysis: Smoking behavior and FTND locus on 5q14.1-q21.3. |
||||
| 7p15.1 | CHN2 | CPD | 578 / 1 / 0 | 1.50×10⁻³ | FTND score (0.71) | Smoking cessation 13 |
Member of the chimerin family, a role in the proliferation and migration of smooth muscle cells, mutations associated with schizophrenia in men. |
|||
| 7p21.2 | DGKB | NDSS stereotypy/ continuity factor |
887 / 2 / 0 | 2.74×10⁻⁴ | Smoking cessation 12 |
Alcohol dependence 18 | ||||
| 7q21.12 | ADAM22 | TTF | 146 / 1 / 0 | 5.80×10⁻² | Finnish sample: 7q21- q31 FTND locus. |
Belongs to the ADAM (a disintegrin and metalloprotease domain) family, members of which have been implicated in neurogenesis. |
||||
| 7q21.13 | GTPBP10 | FTND score | 243 / 5 / 0 | 3.50×10⁻⁵ | TTF (0.84), CPD (0.71) |
Finnish sample: 7q21- q31 FTND locus. |
||||
| 8q24.22 | ST3GAL1 | Age at first cigarette |
263 / 3 / 0 | 4.80×10⁻⁵ | Age of onset of weekly smoking (0.71), Age of onset of daily smoking (0.63), Age at first puff (0.77) |
Smoking cessation 12,13 |
||||
| 9p22.3- p22.2 |
BNC2 | FTND score | 641 / 54 / 0 | 3.80×10⁻⁵ | TTF (0.84) | Smoking cessation 13 |
||||
| 10p11.21 | PARD3 | NDSS drive/ priority factor |
612 / 4 / 1 | 2.18×10⁻⁴ | NDSS sum score (0.69) |
Smoking cessation 13 |
Involved in asymmetrical cell division and cell polarization processes, required for neuronal polarity and normal axon formation in cultured hippocampal neurons. |
|||
| 10p11.22 | NRP1 | Age at first cigarette |
350 / 4 / 0 | 5.10×10⁻⁵ | Age at first puff (0.77), max CPD (−0.33) |
A membrane-bound co- receptor to a tyrosine kinase receptor, role in neural development (axon guidance). |
||||
| 10p15.1 | ANKRD16 | NDSS drive/priority factor |
142 / 5 / 0 | 5.80×10⁻⁵ | NDSS sum score (0.69) |
Substance use 15 | ||||
| 10q21.1 | PRKG1 | TTF | 1426 / 1 / 0 | 1.81×10⁻² | FTND score (0.84), NDSS stereotypy/ continuity factor (0.43) |
Smoking cessation 13 nicotine dependence (FTND) 14 |
Substance use 15 metamphetamine dependence17 |
Protein kinase whose target proteins regulate e.g. processes involved in axon guidance. |
||
| 11q25 | NTM | DSM-IV ND symptoms |
1150 / 3 / 0 | 1.31×10⁻³ | FTND score (0.56) | Neural cell adhesion molecule |
||||
| 12q23.3 | CMKLR1 | FTND (≥4) | 124 / 1 / 0 | N/A | NDSS sum score (0.63) |
Alcohol dependence 21 | ||||
| 14q12 | STXBP6 | NDSS drive/ priority factor |
461 / 1 / 0 | 2.12×10⁻³ | NDSS sum score (0.69) |
Smoking cessation 12 |
||||
| 15q21.3 | UNC13C | NDSS drive/ priority factor |
711 / 5 / 0 | 2.34×10⁻⁴ | DSM-IV ND symptoms (0.45), NDSS sum score (0.69), FTND score (0.46), CPD (0.31), max CPD (0.29) |
Smoking cessation 13 |
Probably involved
in neurotransmitter release. |
|||
| NDSS sum score |
711 / 3 / 0 | 4.81×10⁻⁴ | NDSS drive/priority factor (0.69), CPD (0.48), max CPD (0.48), DSM-IV ND symptoms (0.52), FTND score (0.62) |
|||||||
| 15q22.2 | LACTB | TTF | 103 / 3 / 1 | 9.00×10⁻⁶ | NDSS sum score (0.53), NDSS drive/ priority factor (0.40), FTND score (0.84) |
|||||
| 15q23 | CORO2B | First time sensations |
188 / 4 / 0 | 1.16×10⁻⁴ | Alcohol dependence 20 | May play a role in the reorganization of neuronal actin structure. |
||||
| 16p12.3 | CLEC19A | CPD | 139 / 18 / 17 |
2.60×10⁻⁷ | Suggestive association with CPD in the NAG- OZALC sample (one SNP with P=10−4) |
max CPD (0.73), FTND score (0.71), TTF (0.54) |
Meta-analysis: Smoking behavior and FTND locus on 16p13.3-p12.3, and max CPD locus on 16p12.3-q12.2. |
|||
| Maximum CPD |
139 / 16 / 0 | 1.40×10⁻⁵ | CPD (0.73), FTND score (0.58), TTF (0.45) |
|||||||
| 19p13.11 | UNC13A | TTF | 85 / 1 / 0 | 8.38×10⁻³ | FTND score (0.84) | Involved in neurotransmitter release. |
||||
| 22q12.2 | EWSR1 | NDSS sum score |
72 / 1 / 0 | 4.20×10⁻⁵ | Finnish sample: 22q12 maximum CPD locus. Meta-analysis: Max CPD locus on 22pter- q12.3. |
|||||
| 22q12.2 | EMID1 | NDSS sum score |
98 / 1 / 0 | 4.50×10⁻⁵ | Finnish sample: 22q12 maximum CPD locus. Meta-analysis: Max CPD locus on 22pter- q12.3. |
|||||
| 22q12.2 | RHBDD3 | NDSS sum score |
63 / 3 / 0 | 2.60×10⁻⁵ | Illicit drug dependence 22 |
Finnish sample: 22q12 maximum CPD locus. Meta-analysis: Max CPD locus on 22pter- q12.3. |
||||
| 22q13.1 |
GRAP2 (GRID) |
Age of onset of daily smoking |
86 / 1 / 0 | 8.91×10⁻⁴ | DSM-IV ND symptoms (−0.20), Age of onset of weekly smoking (0.87) |
Meta-analysis: Smoking behavior and max CPD locus on 22q12.3-q13.32 |
Trait definitions are presented in Supplemental table 1.
SNPs with P<1×10⁻⁶ are bolded.
Gene-based p-values calculated by PLINK set-based analysis for quantitative traits and by VEGAS for qualitative traits; all SNPs within ±50 kb flanking of the gene were included. P≤10−6 are bolded.
Only attempted for SNPs with P<1×10⁻⁶ in the GWA analyses, and all SNPs in ERBB4 and CLEC19A (±50 kb flanking).
Trait correlations are presented in Supplemental table 2. Details for the pleiotropic signals are presented in Supplemental table 4.
All published GWA studies and meta analyses were considered.
PubMed (http://www.ncbi.nlm.nih.gov/pubmed/) searches were made with the gene name on Sep-18-2012
Saccone et al. Am J Hum Genet 2007; 80: 856–866; Loukola et al. Pharmacogenomics J 2008; 8: 209–219; Keskitalo-Vuokko et al. Nicotine Tob Res 2012; 14: 153–160.
Han et al. Biol Psychiatry 2010; 67: 12–19.
According to GeneCards (http://www.genecards.org/)
Uhl et al. Pharmacogenomics 2010; 11: 357–367.
Uhl et al. Mol Med 2010; 16: 513–526.
Uhl et al. Arch Gen Psychiatry 2008; 65: 683–693.
Uhl et al. BMC Genet 2007; 8: 10.
Johnson et al. BMC Med Genet. 2008; 9: 113–122.
Drgon et al. Am J Med Genet B Neuropsychiatr Genet. 2011; 156(2): 125–138.
Uhl et al. Arch Gen Psychiatry. 2008; 65(3): 345–355.
Wang et a. J Psychiatr Res. 2011; 45(11): 1419–1425.
Wang et al. J Neural Transm. 2012; 199: 425–433
Kendler et al. Alcohol Clin Exp Res. 2011; 35(5): 963–975.
Zuo et al. Neuropsychopharmacology 2012; 37(2): 557–566.
Drgon et al. PLoS One. 2010; 5(1): e8832.
N/A, not available: VEGAS reported no gene-based P-values for the SNPs within this gene
10p11.21 (PARD3) NDSS drive/priority locus
An intronic SNP in PARD3 (par-3 partitioning defective 3 homolog (C. elegans)) on 10p11.21 showed association with NDSS drive/priority factor (rs1946931, P=7.61×10⁻⁷) (Table 1). Four additional SNPs showed preliminary association (P<1×10⁻⁵). These five SNPs cluster within an 11-kb region, fall into three distinct LD blocks (Supplemental figure 2A), and are highly correlated (r2 range 0.93–1.00), representing only one independent signal. Modest effect sizes were obtained for the SNPs (beta range 0.68–0.71), implying that minor allele carriers score higher on the drive/priority factor (Table 1). Gene-based analysis yielded a P-value of 2.18×10⁻⁴ (Table 2). This finding did not replicate in the NAG-OZALC sample.
15q22.2 FTND time to first cigarette (TTF) locus
An intergenic SNP on 15q22.2 located 9 kb from LACTB (lactamase, beta) and 71 kb from TPM1 (tropomyosin 1) revealed association with TTF (rs2652813, P=2.54×10⁻⁷) (Table 1). Three additional nearby SNPs showed preliminary association (P<1×10⁻⁵). These four SNPs cluster within a 9kb-region, fall into a single LD block (Supplemental figure 2B), and are highly correlated (r2 range 0.97–1.00), representing only one independent signal. Modest effect size was obtained (beta −0.35), with the minor allele decreasing the time to first cigarette in the morning (shorter time to first cigarette indicates higher ND) (Table 1). A gene-based P-value for LACTB was 9.00×10⁻⁶ (Table 2). This finding did not replicate in the FT12 or NAG-OZALC sample.
2q21.2 age of onset of weekly smoking locus
Three intergenic SNPs on 2q21.2 located between NCKAP5 (NCK-associated protein 5) and MGAT5 (mannosyl (alpha-1,6-)-glycoprotein beta-1,6-N-acetyl-glucosaminyl-transferase) (264–277 kb and 408–422 kb from the genes, respectively) showed association with age of onset of weekly smoking (best rs4954080, P=5.35×10⁻⁷) (Table 1). Two additional nearby SNPs showed preliminary association (P<1×10⁻⁵). These five SNPs cluster within a 23kb-region, fall into three distinct LD blocks (Supplemental figure 2C), and are correlated (r2 range 0.62–1.00), representing two independent signals. Substantial effect sizes were obtained for SNPs in each of the blocks (beta range 0.88–0.93), roughly corresponding to a decrease of nearly a year in the age of onset of weekly smoking for each allele of the locus (Table 1). This finding did not replicate in the NAG-OZALC sample.
2q33 (ERBB4) DSM-IV nicotine dependence locus
Intriguing preliminary association was detected between DSM-IV ND diagnosis and a total of 17 SNPs in ERBB4 (v-erb-a erythroblastic leukemia viral oncogene homolog 4 (avian)) on 2q33 (eight SNPs located 3’ flanking, five SNPs in 3’UTR, and four SNPs intronic) (best rs7562566, P=1.68×10⁻⁶) (Table 1). These 17 SNPs cluster within a 53kb-region, fall into a single LD block (Figure 1B), and are highly correlated (r2 range 0.83–1.00), representing an estimated number of 1.5 independent SNPs. Significant effect sizes were obtained for the SNPs (OR=1.42) (Table 1). Gene-based analysis yielded a p-value of 9.94×10⁻³ (Table 2). The association between ERBB4 and DSM-IV ND diagnosis was replicated in the NAG-OZALC sample, with several SNPs showing P-values in the range of 10−4 (best rs7589512, P=2.14×10⁻⁴) some 739 kb from the region highlighted in the study sample (Supplemental table 6). FTND (≥4) showed no association in the FT12 replication sample. Due to previously reported ERBB4 associations, we utilized a variety of traits when attempting to replicate the association in the FT12 sample. We detected association between ERBB4 and verbal ability (P-values in the magnitude of 10−4), emerging some 568 kb from the highlighted region (Supplemental table 6). Schizotypy (SPQ-B) dimensions showed no significant association (Supplemental table 6).
A total of 55 genes harbored at least one SNP with P<1×10⁻⁵ (the threshold used as a starting point for the gene discovery process) within ±50kb flanking of the gene (Supplemental table 5). After collecting supporting evidence from gene-based analyses, in silico replication, pleiotropic signals across the studied traits, relevance of known function as well as replication in independent data sets, we disclose altogether 33 genes whose involvement in the etiology of smoking behavior is substantiated by at least one additional source of evidence (Table 2). Altogether 11 of the highlighted genes have previously been associated with smoking cessation. In our post hoc analyses only UNC13C showed P-values in the magnitude of 10−4 for the former smoker phenotype (data not shown).
DISCUSSION
The identification of the functional variant (rs16969968) in CHRNA512 has provided key insights into the mechanisms of nicotine addiction in men and mice 46, 47; however, we have only begun to comprehend the genetic underpinnings of ND. Patients with psychiatric disorders, especially depression, schizophrenia, and attention deficit disorders are clearly more frequently nicotine dependent 48. The identification of specific predisposing genes for smoking behavior will likely provide insights into the co-morbidity.
The identification of susceptibility genes for smoking behavior has suffered from small sample sizes and lack of replication, and due to the complexity of the phenotype, inadequate phenotypic definitions likely have substantially contributed to the scarcity of findings. Of the prior GWA studies of smoking behavior or ND (http://www.genome.gov/gwastudies), only four with sample sizes over 10 000 achieved associations considered to be genome-wide significant at the standard definition of P<5×10−849,50. The remaining studies disclose between a few hundred and several thousands of SNPs with P-values in the 10−6–10−7 range. More signals can be expected as sample sizes increase 51,52 and genetic information content is increased by imputation, halpotype construction 53 and sequencing. Scrutinizing a large number of interrelated and carefully characterized traits is another approach to better capture the effects of the variants on the underlying shared architecture. Shared risk loci can be detected in GWA analyses even for diseases with distinct clinical features 52, suggesting that unforeseen shared mechanisms are involved.
Here, we utilized a Finnish twin sample of adults (N=1114) with exceptionally detailed phenotype profiles and a homogenous genetic background. We scrutinized 17 phenotypes in order to comprehensively portray the complex dimensions of smoking behavior, clustered as smoking initiation, amount smoked, and ND, while looking for associations in a genome-wide analysis. In contrast to many previous GWA studies focusing on smoking quantity as a proxy for ND, we have included two smoking-quantity phenotypes as well as direct validated measures of ND which are also correlated with amount smoked. While a person can be substance dependent even with low consumption levels, in the population overall dependence is associated with substantially higher levels of consumptions as documented in the recent very large (N>43 000) US survey of substance use, abuse and dependence 54. The paper also demonstrates that of the studied licit and illicit substances, the liability to dependence is greatest for nicotine 54. While our study is underpowered in a conventional assessment, the sample was highly enriched for smoking by inviting all available heavy smoking concordant pairs (both MZ and DZ) from among the more than 14 000 twin pairs with smoking information in the cohort 55. Further, our main findings are supported by convergent data from multiple sources. To the best of our knowledge, none of our highlighted loci have yielded significant results in GWA meta-analyses for smoking related traits.
Compelling association with CPD was detected in the vicinity of CLEC19A on 16p12.3, supported by signals emerging from other traits encompassing smoking quantity (maximum CPD and FTND score) as well as TTF. In line with this, the 16p12.3 locus overlaps with nominally significant linkage loci for maximum CPD and FTND highlighted in a linkage meta-analysis which included subjects also from the current sample 56. Substantial effect sizes, roughly corresponding to an increment of five cigarettes per day for each allele of the locus, were detected. However, the associating SNPs are relatively rare (MAF 0.04–0.06) and thus the population level impact is less prominent that the effect of the established CHRNA5-CHRNA3-CHRNB4 smoking quantity locus with effect sizes corresponding merely to an increment of one CPD 12. The plausible function of CLEC19A is unknown but interestingly, it is located merely 44 kb from an ADHD linkage locus 57. The locus at 16p12.3–12.2 is in close proximity to previously reported ADHD linkage loci 58,59. ADHD and smoking are associated both in adolescents and adults 60,61. In the Finnish twin sample of adolescents (FT12) ADHD-related symptoms of inattentiveness, hyperactivity and impulsivity rated by parents and teachers consistently predicted daily smoking at ages 14 and 17.5 62. In the FT12 sample, no association was seen between CLEC19A SNPs and DSM-IV ADHD symptoms. However, this sample is not enriched for ADHD, the symptoms were assessed at age 14 from the adolescents, and the distribution of symptoms is skewed. Together they are likely to have reduced the power to detect an association. Further studies are warranted to clarify the role of CLEC19A or nearby genes on 16p12 in the etiology of ND and ADHD.
Association was detected between NDSS drive/priority factor and PARD3, coding for an adapter protein involved in neuronal polarity and axon formation 63; however, with relatively rare SNPs (MAF 0.02). PARD3 has previously been associated with smoking cessation 64. In line with this, NDSS drive reflects craving, withdrawal, and smoking compulsions, while priority reflects preference for smoking over other reinforces 15. Interestingly, another member of the gene family, PARD3B, located on the 2q33.3 linkage region previously detected in the current sample 31, has been associated with ND defined by the FTND 26.
Among the preliminary associations (P<1×10⁻⁵) the most notable is the association between DSM-IV ND diagnosis and ERBB4, coding for an ErbB4 receptor tyrosine kinase that acts as receptor for Neuregulins, with diverse functions in the development of the central nervous system 65. Convergent data supporting the involvement of ERBB4 in smoking behavior is provided by its location within the 2q33 linkage locus previously identified for a smoker phenotype (“smoked ≥100 cigarettes in lifetime”) in the current sample 31. Further, the 2q33 locus overlaps with a linkage locus for maximum CPD highlighted in a linkage meta-analysis 56. No association was detected in the FT12 replication sample with ND defined by the FTND (≥4). In the study sample FTND showed non-significant P-values, suggesting that the association signal may emerge from ND dimensions not adequately addressed by FTND. This is in line with previous studies suggesting that DSM-IV ND and FTND extract somewhat different aspects of ND 66,67. The association between ERBB4 and DSM-IV ND diagnosis was replicated in the Australian NAG-OZALC sample with SNPs located ∼739 kb from the association signal detected in the study sample. It is plausible that both regions harbour rare, functional variants, one specific for Finland and the other found in the mixed European population. Such rare, functional variants specific to Finns exist for behavioral traits 68. ERBB4 spans 1.1 Mb in the genomic sequence, with over 1000 SNPs included in the current study; thus, some association signal can be expected to emerge by chance. However, further support comes from the study by Turner et al. (companion manuscript) showing significant induction of ErbB4 and Nrg3 during nicotine withdrawal in a mouse model. In addition, Turner et al. (companion manuscript) report novel association of SNPs in NRG3 with smoking cessation success in a clinical trial. This paper together with the current study strongly implicates the Neuregulin/ErbB pathway in the molecular mechanisms underlying nicotine dependence.
Evidence from genetic 69–73, transgenic 74, and post-mortem 75 studies strongly supports the critical role of Neuregulin 1 (NRG1) and its ErbB4 receptor in the pathophysiology of schizophrenia. In healthy individuals, genetic variants in ERBB4 associate with reduced white matter integrity 76 and may influence cognitive functioning, as seen for verbal working memory 71. ERBB4 is located within the linkage locus for schizophrenia and visual working memory in a Finnish family sample 77,78 and the 2q33 locus has also been highlighted in a schizophrenia linkage meta-analysis 73. An association between ERBB4 and schizophrenia symptoms and impairment in executive functioning and verbal ability/attention has been detected in a Finnish schizophrenia sample (Wedenoja et al., unpublished data). Interestingly, we detected association between ERBB4 and verbal ability, although some 89 kb from the region highlighted for verbal ability in the Finnish schizophrenia sample (Wedenoja et al., unpublished data). However, schizotypy which is a psychological concept encompassing a set of behavioral traits and cognitions thought to represent the subclinical manifestation of schizophrenia in the general population, showed no significant association with ERBB4. The scrutiny of other members within the Neuregulin/ErbB pathway may further uncover shared genetic predisposition for ND and schizophrenia.
Our study sample comes from one of the best-characterized founder populations, the Finns. Unique LD patterns are observed in founder populations 79; thus, the lack of replication for other findings than ERBB4 may at least partly be due to the genetic heterogeneity between the Finnish and Australian populations. It has been shown that population isolates, especially those founded recently, such as Finland, have longer stretches of LD than outbred populations and may thus achieve better genome-wide coverage with equivalent numbers of markers 79,80. Furthermore, the significant age difference between the study sample (mean age 55.0 years) and the FT12 replication sample (mean 21.9 years) may partly explain the negative replication results, as many of the included phenotypes may became expressed only after extended exposure to smoking.
Due to the evident differences in genetic background between the CEPH subjects and the Finnish population, imputation based on HapMap data may not be optimal. It has been shown that even a relatively small population-specific reference set yields considerable benefits in SNP imputation and increases the power to detect associations in founder populations and population isolates in particular 81. However, at least for the top loci the LD blocks in the study sample were very similar to those in the HapMap CEPH data, and the somewhat stronger intermarker LD is in agreement with previous findings from the Finnish population 79.
It has been proven that the ability to achieve genome-wide significant P-values is dependent on sample size, with almost a linear relationship between sample size and the number of detected loci 52. In studies with relatively small sample sizes, such as ours, genome-wide significant P-values are unlikely to emerge. We have focused on collecting detailed phenotypic profiles, which may well turn out to be more beneficial than recruitment of increasing numbers of subjects with crude phenotypes 14. Support for the involvement of a particular locus thus must be collected from several sources in order to diminish the false positive discovery rate; the individual P-values merely serve as a starting point for the discovery process. We set a somewhat arbitrary P-value threshold at P<1×10⁻⁵, and looked for convergent, supportive evidence for all such findings. Genes with supporting evidence from at least one additional source were nominated as likely to be involved in the etiology of smoking behavior.
As a conclusion, by utilizing a comprehensive set of smoking behavior and ND traits we detected novel intriguing associations. Some of the detected associations were further supported by replication in independent data sets, pleiotropic signals across the traits, previously reported association, or location within previously identified linkage loci. Our results suggest that genetic variation in the 16p12.3 locus harboring CLEC19A may in part underlie the co-occurrence of smoking and ADHD. We disclose novel tentative evidence for the involvement of ERBB4 in ND, suggesting the involvement of the Neuregulin/ErbB signalling pathway in addictions and providing a plausible link between the high co-morbidity of schizophrenia and ND.
Supplementary Material
Genome-wide plots of P-values for all 17 traits.
Regional plots for (A) the 10p11.21 NDSS drive/priority factor locus, (B) the 15q22.2 FTND time to first cigarette (TTF) locus, and (C) the 2q21.2 age of onset of weekly smoking locus. The top panel shows the SNP association results including 20 kb flanking regions from the locus and/or the farthest end of the nearest gene. Arrow indicates the direction of the gene. The bottom panel shows the LD structure of the locus in the study sample (one individual per family, index twin prioritized), including the SNPs in Table 1 as well as all the intermediate SNPs. The boxes are shaded according to D’ values (darker shading indicated higher LD), and the numbers in the boxes are the r2 values (empty boxes represent full LD).
ACKNOWLEDGEMENTS
We warmly thank the participating twin pairs and their family members for their contribution. We would like to express our appreciation to the skilled study interviewers A-M Iivonen, K Karhu, H-M Kuha, U Kulmala-Gråhn, M Mantere, K Saanakorpi, M Saarinen, R Sipilä, L Viljanen, and E Voipio. E Hämäläinen and M Sauramo are acknowledged for their skilful technical assistance. Drs. E Vuoksimaa and A Latvala are thanked for collaboration in FT12 traits related to cognitive functions and schizotypy. Prof. A Palotie is acknowledged for his advice and expertise in whole-genome genotyping. We are ever grateful to the late Academician Leena Peltonen-Palotie for her indispensable contribution throughout the years of the study.
This work was supported for data collection by Academy of Finland grants (JK) and a NIH grant DA12854 (PAFM). Genome-wide genotyping in the Finnish sample was funded by Global Research Award for Nicotine Dependence / Pfizer Inc. (JK), and Wellcome Trust Sanger Institute, UK. Genome-wide genotyping in the Australian sample was funded by NIH grants AA013320, AA013321, AA013326, AA011998, and AA017688. This work was further supported by the Sigrid Juselius Foundation (JK), Doctoral Programs of Public Health (UB), the Yrjö Jahnsson Foundation (UB), the Jenny and Antti Wihuri Foundation (JK), the Juho Vainio Foundation for Post-Doctoral research (UB), Finnish Cultural Foundation (TK), a NIH grant DA019951 (MLP), and by the Academy of Finland Center of Excellence in Complex Disease Genetics (grant numbers: 213506, 129680, JK).
Footnotes
CONFLICT OF INTEREST
Dr. Kaprio has served as a consultant to Pfizer in 2008, 2011 and 2012. Dr. Broms has served as a consultant to Pfizer in 2008. Dr. Korhonen has served as a consultant to Pfizer in 2011 and 2012.
SUPPLEMENTARY INFORMATION IS AVAILABLE AT MOLECULAR PSYCHIATRY'S WEBSITE.
REFERENCES
- 1.Centers for Disease Control (CDC) Smoking-attributable mortality, years of potential life lost, and productivity losses--United States, 2000–2004. MMWR Morb Mortal Wkly Rep. 2008;57:1226–1228. [PubMed] [Google Scholar]
- 2.Steuber TL, Danner F. Adolescent smoking and depression: which comes first? Addict Behav. 2006;31:133–136. doi: 10.1016/j.addbeh.2005.04.010. [DOI] [PubMed] [Google Scholar]
- 3.Munafò MR, Hitsman B, Rende R, Metcalfe C, Niaura R. Effects of progression to cigarette smoking on depressed mood in adolescents: evidence from the National Longitudinal Study of Adolescent Health. Addiction. 2008;103:162–171. doi: 10.1111/j.1360-0443.2007.02052.x. [DOI] [PubMed] [Google Scholar]
- 4.Boden JM, Fergusson DM, Horwood LJ. Cigarette smoking and depression: tests of causal linkage using a longitudinal birth cohort. Br J Psychiatry. 2010;196:440–446. doi: 10.1192/bjp.bp.109.065912. [DOI] [PubMed] [Google Scholar]
- 5.Munafò MR, Araya R. Cigarette smoking and depression: a question of causation. Br J Psychiatry. 2010;196:425–426. doi: 10.1192/bjp.bp.109.074880. [DOI] [PubMed] [Google Scholar]
- 6.Benowitz NL. Nicotine addiction. N Engl J Med. 2010;362:2295–2303. doi: 10.1056/NEJMra0809890. [DOI] [PMC free article] [PubMed] [Google Scholar]
- 7.American Psychiatric Association. Diagnostic and statistical manual of mental disorders: DSM-IV. 4th edition. Washington DC, USA: American Psychiatric Association; 1994. [Google Scholar]
- 8.Heatherton TF, Kozlowski LT, Frecker RC, Fagerström KO. The Fagerström Test for Nicotine Dependence: a revision of the Fagerström Tolerance Questionnaire. Br J Addict. 1991;86:1119–1127. doi: 10.1111/j.1360-0443.1991.tb01879.x. [DOI] [PubMed] [Google Scholar]
- 9.Rose JE, Broms U, Korhonen T, Dick DM, Kaprio J. Genetics of smoking behavior. In: Kim YK, editor. Handbook of behavior genetics. Springer: New York, USA; 2009. pp. 411–432. [Google Scholar]
- 10.Hung RJ, McKay JD, Gaborieau V, Boffetta P, Hashibe M, Zaridze D, et al. A susceptibility locus for lung cancer maps to nicotinic acetylcholine receptor subunit genes on 15q25. Nature. 2008;452:633–637. doi: 10.1038/nature06885. [DOI] [PubMed] [Google Scholar]
- 11.Amos CI, Wu X, Broderick P, Gorlov IP, Gu J, Eisen T, et al. Genome-wide association scan of tag SNPs identifies a susceptibility locus for lung cancer at 15q25.1. Nat Genet. 2008;40:616–622. doi: 10.1038/ng.109. [DOI] [PMC free article] [PubMed] [Google Scholar]
- 12.Thorgeirsson TE, Geller F, Sulem P, Rafnar T, Wiste A, Magnusson KP, et al. A variant associated with nicotine dependence, lung cancer and peripheral arterial disease. Nature. 2008;452:638–642. doi: 10.1038/nature06846. [DOI] [PMC free article] [PubMed] [Google Scholar]
- 13.Keskitalo K, Broms U, Heliövaara M, Ripatti S, Surakka I, Perola M, et al. Association of serum cotinine level with a cluster of three nicotinic acetylcholine receptor genes (CHRNA3/CHRNA5/CHRNB4) on chromosome 15. Hum Mol Genet. 2009;18:4007–4012. doi: 10.1093/hmg/ddp322. [DOI] [PMC free article] [PubMed] [Google Scholar]
- 14.Munafò MR, Timofeeva MN, Morris RW, Prieto-Merino D, Sattar N, Brennan P, et al. Association Between Genetic Variants on Chromosome 15q25 Locus and Objective Measures of Tobacco Exposure. J Natl Cancer Inst. 2012;104(10):740–748. doi: 10.1093/jnci/djs191. [DOI] [PMC free article] [PubMed] [Google Scholar]
- 15.Shiffman S, Waters A, Hickcox M. The nicotine dependence syndrome scale: a multidimensional measure of nicotine dependence. Nicotine Tob Res. 2004;6:327–348. doi: 10.1080/1462220042000202481. [DOI] [PubMed] [Google Scholar]
- 16.Broms U, Wedenoja J, Largeau MR, Korhonen T, Pitkäniemi J, Keskitalo-Vuokko K, et al. Analysis of Detailed Phenotype Profiles Reveals CHRNA5-CHRNA3-CHRNB4 Gene Cluster Association With Several Nicotine Dependence Traits. Nicotine Tob Res. 2012;14(6):720–733. doi: 10.1093/ntr/ntr283. [DOI] [PMC free article] [PubMed] [Google Scholar]
- 17.Uhl GR, Liu QR, Drgon T, Johnson C, Walther D, Rose JE. Molecular genetics of nicotine dependence and abstinence: whole genome association using 520,000 SNPs. BMC Genet. 2007;8:10. doi: 10.1186/1471-2156-8-10. [DOI] [PMC free article] [PubMed] [Google Scholar]
- 18.Bierut LJ, Madden PA, Breslau N, Johnson EO, Hatsukami D, Pomerleau OF, et al. Novel genes identified in a high-density genome wide association study for nicotine dependence. Hum Mol Genet. 2007;16:24–35. doi: 10.1093/hmg/ddl441. [DOI] [PMC free article] [PubMed] [Google Scholar]
- 19.Liu JZ, Tozzi F, Waterworth DM, Pillai SG, Muglia P, Middleton L, et al. Meta-analysis and imputation refines the association of 15q25 with smoking quantity. Nat Genet. 2010;42:436–440. doi: 10.1038/ng.572. [DOI] [PMC free article] [PubMed] [Google Scholar]
- 20.Tobacco and Genetics Consortium. Genome-wide meta-analyses identify multiple loci associated with smoking behavior. Nat Genet. 2010;42:441–447. doi: 10.1038/ng.571. [DOI] [PMC free article] [PubMed] [Google Scholar]
- 21.Thorgeirsson TE, Gudbjartsson DF, Surakka I, Vink JM, Amin N, Geller F, et al. Sequence variants at CHRNB3-CHRNA6 and CYP2A6 affect smoking behavior. Nat Genet. 2010;42:448–453. doi: 10.1038/ng.573. [DOI] [PMC free article] [PubMed] [Google Scholar]
- 22.Vink JM, Smit AB, de Geus EJ, Sullivan P, Willemsen G, Hottenga JJ, et al. Genome-wide association study of smoking initiation and current smoking. Am J Hum Genet. 2009;84:367–379. doi: 10.1016/j.ajhg.2009.02.001. [DOI] [PMC free article] [PubMed] [Google Scholar]
- 23.Liu YZ, Pei YF, Guo YF, Wang L, Liu XG, Yan H, et al. Genome-wide association analyses suggested a novel mechanism for smoking behavior regulated by IL15. Mol Psychiatry. 2009;14:668–680. doi: 10.1038/mp.2009.3. [DOI] [PMC free article] [PubMed] [Google Scholar]
- 24.Lind PA, Macgregor S, Vink JM, Pergadia ML, Hansell NK, de Moor MH, et al. A genomewide association study of nicotine and alcohol dependence in Australian and Dutch populations. Twin Res Hum Genet. 2010;13:10–29. doi: 10.1375/twin.13.1.10. [DOI] [PMC free article] [PubMed] [Google Scholar]
- 25.Yoon D, Kim YJ, Cui WY, Van der Vaart A, Cho YS, Lee JY, et al. Large-scale genome-wide association study of Asian population reveals genetic factors in FRMD4A and other loci influencing smoking initiation and nicotine dependence. Hum Genet. 2011;131(6):1009–1021. doi: 10.1007/s00439-011-1102-x. [DOI] [PMC free article] [PubMed] [Google Scholar]
- 26.Drgon T, Montoya I, Johnson C, Liu QR, Walther D, Hamer D, et al. Genome-wide association for nicotine dependence and smoking cessation success in NIH research volunteers. Mol Med. 2009;15:21–27. doi: 10.2119/molmed.2008.00096. [DOI] [PMC free article] [PubMed] [Google Scholar]
- 27.Caporaso N, Gu F, Chatterjee N, Sheng-Chih J, Yu K, Yeager M, et al. Genome-wide and candidate gene association study of cigarette smoking behaviors. PLoS One. 2009;4:e4653. doi: 10.1371/journal.pone.0004653. [DOI] [PMC free article] [PubMed] [Google Scholar]
- 28.Siedlinski M, Cho MH, Bakke P, Gulsvik A, Lomas DA, Anderson W, et al. Genome-wide association study of smoking behaviors in patients with COPD. Thorax. 2011;66:894–902. doi: 10.1136/thoraxjnl-2011-200154. [DOI] [PMC free article] [PubMed] [Google Scholar]
- 29.Saccone NL, Culverhouse RC, Schwantes-An TH, Cannon DS, Chen X, Cichon S, et al. Multiple independent loci at chromosome 15q25.1 affect smoking quantity: a meta-analysis and comparison with lung cancer and COPD. PLoS Genet. 2010;6 doi: 10.1371/journal.pgen.1001053. e1001053. [DOI] [PMC free article] [PubMed] [Google Scholar]
- 30.Broms U, Madden PA, Heath AC, Pergadia ML, Shiffman S, Kaprio J. The Nicotine Dependence Syndrome Scale in Finnish smokers. Drug Alcohol Depend. 2007;89:42–51. doi: 10.1016/j.drugalcdep.2006.11.017. [DOI] [PMC free article] [PubMed] [Google Scholar]
- 31.Loukola A, Broms U, Maunu H, Widén E, Heikkilä K, Siivola M, et al. Linkage of nicotine dependence and smoking behavior on 10q, 7q and 11p in twins with homogeneous genetic background. Pharmacogenomics J. 2008;8:209–219. doi: 10.1038/sj.tpj.6500464. [DOI] [PubMed] [Google Scholar]
- 32.Saccone SF, Pergadia ML, Loukola A, Broms U, Montgomery GW, Wang JC, et al. Genetic linkage to chromosome 22q12 for a heavy-smoking quantitative trait in two independent samples. Am J Hum Genet. 2007;80:856–866. doi: 10.1086/513703. [DOI] [PMC free article] [PubMed] [Google Scholar]
- 33.Hartz SM, Short SE, Saccone NL, Culverhouse R, Chen L, Schwantes-An TH, et al. Increased Genetic Vulnerability to Smoking at CHRNA5 in Early-Onset Smokers. Arch Gen Psychiatry. 2012;69(8):854–860. doi: 10.1001/archgenpsychiatry.2012.124. [DOI] [PMC free article] [PubMed] [Google Scholar]
- 34.Knaapila A, Silventoinen K, Broms U, Rose RJ, Perola M, Kaprio J, et al. Food neophobia in young adults: genetic architecture and relation to personality, pleasantness and use frequency of foods, and body mass index--a twin study. Behav Genet. 2011;41:512–521. doi: 10.1007/s10519-010-9403-8. [DOI] [PubMed] [Google Scholar]
- 35.Heath AC, Whitfield JB, Martin NG, Pergadia ML, Goate AM, Lind PA, et al. A quantitative-trait genome-wide association study of alcoholism risk in the community: Findings and implications. Biol Psychiatry. 2011;70:513–518. doi: 10.1016/j.biopsych.2011.02.028. [DOI] [PMC free article] [PubMed] [Google Scholar]
- 36.Bucholz KK, Cadoret R, Cloninger CR, Dinwiddie SH, Hesselbrock VM, Nurnberger JI, Jr, et al. A new, semi-structured psychiatric interview for use in genetic linkage studies: a report on the reliability of the SSAGA. J Stud Alcohol. 1994;55:149–158. doi: 10.15288/jsa.1994.55.149. [DOI] [PubMed] [Google Scholar]
- 37.Cottler LB, Robins LN, Grant BF, Blaine J, Towle LH, Wittchen HU, et al. The CIDI-core substance abuse and dependence questions: cross-cultural and nosological issues. The WHO/ADAMHA Field Trial. Br J Psychiatry. 1991;159:653–658. doi: 10.1192/bjp.159.5.653. [DOI] [PubMed] [Google Scholar]
- 38.Nyholt DR. A simple correction for multiple testing for single-nucleotide polymorphisms in linkage disequilibrium with each other. Am J Hum Genet. 2004;74:765–769. doi: 10.1086/383251. [DOI] [PMC free article] [PubMed] [Google Scholar]
- 39.Raine A, Benishay D. The SPQ-B: a brief screening instrument for schizotypal personality disorder. J Pers Disord. 1995;9:346–355. [Google Scholar]
- 40.Raine A, Reynolds C, Lencz T, Scerbo A, Triphon N, Kim D. Cognitive-perceptual, interpersonal, and disorganized features of schizotypal personality. Schizophr Bull. 1994;20:191–201. doi: 10.1093/schbul/20.1.191. [DOI] [PubMed] [Google Scholar]
- 41.Howie BN, Donnelly P, Marchini J. A flexible and accurate genotype imputation method for the next generation of genome-wide association studies. PLoS Genet. 2009;5 doi: 10.1371/journal.pgen.1000529. e1000529. [DOI] [PMC free article] [PubMed] [Google Scholar]
- 42.Purcell S, Neale B, Todd-Brown K, Thomas L, Ferreira MA, Bender D, et al. PLINK: a tool set for whole-genome association and population-based linkage analyses. Am J Hum Genet. 2007;81:559–575. doi: 10.1086/519795. [DOI] [PMC free article] [PubMed] [Google Scholar]
- 43.Barrett JC, Fry B, Maller J, Daly MJ. Haploview: analysis and visualization of LD and haplotype maps. Bioinformatics. 2005;21:263–265. doi: 10.1093/bioinformatics/bth457. [DOI] [PubMed] [Google Scholar]
- 44.Liu JZ, McRae AF, Nyholt DR, Medland SE, Wray NR, Brown KM, et al. A Versatile Gene-Based Test for Genome-wide Association Studies. Am J Hum Genet. 2010;87:139–145. doi: 10.1016/j.ajhg.2010.06.009. [DOI] [PMC free article] [PubMed] [Google Scholar]
- 45.StataCorp. Stata statistical software. 2009 release 11.1. [Google Scholar]
- 46.Bierut LJ, Stitzel JA, Wang JC, Hinrichs AL, Grucza RA, Xuei X, et al. Variants in nicotinic receptors and risk for nicotine dependence. Am J Psychiatry. 2008;165:1163–1171. doi: 10.1176/appi.ajp.2008.07111711. [DOI] [PMC free article] [PubMed] [Google Scholar]
- 47.Fowler CD, Lu Q, Johnson PM, Marks MJ, Kenny PJ. Habenular α5 nicotinic receptor subunit signalling controls nicotine intake. Nature. 2011;471:597–601. doi: 10.1038/nature09797. [DOI] [PMC free article] [PubMed] [Google Scholar]
- 48.Dani JA, Harris RA. Nicotine addiction and comorbidity with alcohol abuse and mental illness. Nat Neurosci. 2005;8:1465–1470. doi: 10.1038/nn1580. [DOI] [PubMed] [Google Scholar]
- 49.Dudbridge F, Gusnanto A. Estimation of significance thresholds for genomewide association scans. Genet Epidemiol. 2008;32(3):227–234. doi: 10.1002/gepi.20297. [DOI] [PMC free article] [PubMed] [Google Scholar]
- 50.Pe’er I, Yelensky R, Altshuler D, Daly MJ. Estimation of the multiple testing burden for genomewide association studies of nearly all common variants. Genet Epidemiol. 2008;32(4):381–385. doi: 10.1002/gepi.20303. [DOI] [PubMed] [Google Scholar]
- 51.Sullivan P. 96 Psychiatric Genetics Investigators. Don't give up on GWAS. Mol Psychiatry. 2012;17:2–3. [Google Scholar]
- 52.Visscher PM, Brown MA, McCarthy MI, Yang J. Five years of GWAS discovery. Am J Hum Genet. 2012;90:7–24. doi: 10.1016/j.ajhg.2011.11.029. [DOI] [PMC free article] [PubMed] [Google Scholar]
- 53.Browning SR, Browning BL. Haplotype phasing: existing methods and new developments. Nat Rev Genet. 2011;12:703–714. doi: 10.1038/nrg3054. [DOI] [PMC free article] [PubMed] [Google Scholar]
- 54.Moss HB, Chen CM, Yi HY. Measures of Substance Consumption Among Substance Users, DSM-IV Abusers, and Those With DSM-IV Dependence Disorders in a Nationally Representative Sample. J Stud Alcohol Drugs. 2012;73(5):820–828. doi: 10.15288/jsad.2012.73.820. [DOI] [PMC free article] [PubMed] [Google Scholar]
- 55.Kaprio J, Koskenvuo M. Genetic and environmental factors in complex diseases: the older Finnish Twin Cohort. Twin Res. 2002;5:358–365. doi: 10.1375/136905202320906093. [DOI] [PubMed] [Google Scholar]
- 56.Han S, Gelernter J, Luo X, Yang BZ. Meta-analysis of 15 genome-wide linkage scans of smoking behavior. Biol Psychiatry. 2010;67:12–19. doi: 10.1016/j.biopsych.2009.08.028. [DOI] [PMC free article] [PubMed] [Google Scholar]
- 57.Romanos M, Freitag C, Jacob C, Craig DW, Dempfle A, Nguyen TT, et al. Genome-wide linkage analysis of ADHD using high-density SNP arrays: novel loci at 5q13.1 and 14q12. Mol Psychiatry. 2008;13:522–530. doi: 10.1038/mp.2008.12. [DOI] [PubMed] [Google Scholar]
- 58.Ogdie MN, Macphie IL, Minassian SL, Yang M, Fisher SE, Francks C, et al. A genomewide scan for attention-deficit/hyperactivity disorder in an extended sample: suggestive linkage on 17p11. Am J Hum Genet. 2003;72:1268–1279. doi: 10.1086/375139. [DOI] [PMC free article] [PubMed] [Google Scholar]
- 59.Fisher SE, Francks C, McCracken JT, McGough JJ, Marlow AJ, MacPhie IL, et al. A genomewide scan for loci involved in attention-deficit/hyperactivity disorder. Am J Hum Genet. 2002;70:1183–1196. doi: 10.1086/340112. [DOI] [PMC free article] [PubMed] [Google Scholar]
- 60.Lerman C, Audrain J, Tercyak K, Hawk LW, Jr, Bush A, Crystal-Mansour S, et al. Attention-Deficit Hyperactivity Disorder (ADHD) symptoms and smoking patterns among participants in a smoking-cessation program. Nicotine Tob Res. 2001;3:353–359. doi: 10.1080/14622200110072156. [DOI] [PubMed] [Google Scholar]
- 61.Pomerleau CS, Downey KK, Snedecor SM, Mehringer AM, Marks JL, Pomerleau OF. Smoking patterns and abstinence effects in smokers with no ADHD, childhood ADHD, and adult ADHD symptomatology. Addict Behav. 2003;28:1149–1157. doi: 10.1016/s0306-4603(02)00223-x. [DOI] [PubMed] [Google Scholar]
- 62.Sihvola E, Rose RJ, Dick DM, Korhonen T, Pulkkinen L, Raevuori A, et al. Prospective relationships of ADHD symptoms with developing substance use in a population-derived sample. Psychol Med. 2011;20:1–9. doi: 10.1017/S0033291711000791. [DOI] [PMC free article] [PubMed] [Google Scholar]
- 63.Shi SH, Jan LY, Jan YN. Hippocampal neuronal polarity specified by spatially localized mPar3/mPar6 and PI 3-kinase activity. Cell. 2003;112:63–75. doi: 10.1016/s0092-8674(02)01249-7. [DOI] [PubMed] [Google Scholar]
- 64.Uhl GR, Liu QR, Drgon T, Johnson C, Walther D, Rose JE, et al. Molecular genetics of successful smoking cessation: convergent genome-wide association study results. Arch Gen Psychiatry. 2008;65:683–693. doi: 10.1001/archpsyc.65.6.683. [DOI] [PMC free article] [PubMed] [Google Scholar]
- 65.Burden S, Yarden Y. Neuregulins and their receptors: a versatile signaling module in organogenesis and oncogenesis. Neuron. 1997;18(6):847–855. doi: 10.1016/s0896-6273(00)80324-4. [DOI] [PubMed] [Google Scholar]
- 66.Moolchan ET, Radzius A, Epstein DH, Uhl G, Gorelick DA, Cadet JL, et al. The Fagerstrom Test for Nicotine Dependence and the Diagnostic Interview Schedule: do they diagnose the same smokers? Addict Behav. 2002;27:101–113. doi: 10.1016/s0306-4603(00)00171-4. [DOI] [PubMed] [Google Scholar]
- 67.Piper ME, McCarthy DE, Baker TB. Assessing tobacco dependence: a guide to measure evaluation and selection. Nicotine Tob Res. 2006;8:339–351. doi: 10.1080/14622200600672765. [DOI] [PubMed] [Google Scholar]
- 68.Bevilacqua L, Doly S, Kaprio J, Yuan Q, Tikkanen R, Paunio T, et al. A population-specific HTR2B stop codon predisposes to severe impulsivity. Nature. 2010;468:1061–1066. doi: 10.1038/nature09629. [DOI] [PMC free article] [PubMed] [Google Scholar]
- 69.Norton N, Moskvina V, Morris DW, Bray NJ, Zammit S, Williams NM, et al. Evidence that interaction between neuregulin 1 and its receptor erbB4 increases susceptibility to schizophrenia. Am J Med Genet B Neuropsychiatr Genet. 2006;141B:96–101. doi: 10.1002/ajmg.b.30236. [DOI] [PubMed] [Google Scholar]
- 70.Silberberg G, Darvasi A, Pinkas-Kramarski R, Navon R. The involvement of ErbB4 with schizophrenia: association and expression studies. Am J Med Genet B Neuropsychiatr Genet. 2006;141B:142–148. doi: 10.1002/ajmg.b.30275. [DOI] [PubMed] [Google Scholar]
- 71.Nicodemus KK, Luna A, Vakkalanka R, Goldberg T, Egan M, Straub RE, et al. Further evidence for association between ErbB4 and schizophrenia and influence on cognitive intermediate phenotypes in healthy controls. Mol Psychiatry. 2006;11:1062–1065. doi: 10.1038/sj.mp.4001878. [DOI] [PubMed] [Google Scholar]
- 72.Law AJ, Kleinman JE, Weinberger DR, Weickert CS. Disease-associated intronic variants in the ErbB4 gene are related to altered ErbB4 splice-variant expression in the brain in schizophrenia. Hum Mol Genet. 2007;16:129–141. doi: 10.1093/hmg/ddl449. [DOI] [PubMed] [Google Scholar]
- 73.Ng MY, Levinson DF, Faraone SV, Suarez BK, DeLisi LE, Arinami T, et al. Meta-analysis of 32 genome-wide linkage studies of schizophrenia. Mol Psychiatry. 2009;14:774–785. doi: 10.1038/mp.2008.135. [DOI] [PMC free article] [PubMed] [Google Scholar]
- 74.Golub MS, Germann SL, Lloyd KC. Behavioral characteristics of a nervous system-specific erbB4 knock-out mouse. Behav Brain Res. 2004;153:159–170. doi: 10.1016/j.bbr.2003.11.010. [DOI] [PubMed] [Google Scholar]
- 75.Hahn CG, Wang HY, Cho DS, Talbot K, Gur RE, Berrettini WH, et al. Altered neuregulin 1-erbB4 signaling contributes to NMDA receptor hypofunction in schizophrenia. Nat Med. 2006;12:824–828. doi: 10.1038/nm1418. [DOI] [PubMed] [Google Scholar]
- 76.Zuliani R, Moorhead TW, Bastin ME, Johnstone EC, Lawrie SM, Brambilla P, et al. Genetic variants in the ErbB4 gene are associated with white matter integrity. Psychiatry Res. 2011;191:133–137. doi: 10.1016/j.pscychresns.2010.11.001. [DOI] [PMC free article] [PubMed] [Google Scholar]
- 77.Paunio T, Ekelund J, Varilo T, Parker A, Hovatta I, Turunen JA, et al. Genome-wide scan in a nationwide study sample of schizophrenia families in Finland reveals susceptibility loci on chromosomes 2q and 5q. Hum Mol Genet. 2001;10:3037–3048. doi: 10.1093/hmg/10.26.3037. [DOI] [PubMed] [Google Scholar]
- 78.Paunio T, Tuulio-Henriksson A, Hiekkalinna T, Perola M, Varilo T, Partonen T, et al. Search for cognitive trait components of schizophrenia reveals a locus for verbal learning and memory on 4q and for visual working memory on 2q. Hum Mol Genet. 2004;13:1693–1702. doi: 10.1093/hmg/ddh184. [DOI] [PubMed] [Google Scholar]
- 79.Service S, DeYoung J, Karayiorgou M, Roos JL, Pretorious H, Bedoya G, et al. Magnitude and distribution of linkage disequilibrium in population isolates and implications for genome-wide association studies. Nat Genet. 2006;38(5):556–560. doi: 10.1038/ng1770. [DOI] [PubMed] [Google Scholar]
- 80.Peltonen L, Palotie A, Lange K. Use of population isolates for mapping complex traits. Nat Rev Genet. 2000;1(3):182–190. doi: 10.1038/35042049. [DOI] [PubMed] [Google Scholar]
- 81.Surakka I, Kristiansson K, Anttila V, Inouye M, Barnes C, Moutsianas L, et al. Founder population-specific HapMap panel increases power in GWA studies through improved imputation accuracy and CNV tagging. Genome Res. 2010;20(10):1344–1351. doi: 10.1101/gr.106534.110. [DOI] [PMC free article] [PubMed] [Google Scholar]
Associated Data
This section collects any data citations, data availability statements, or supplementary materials included in this article.
Supplementary Materials
Genome-wide plots of P-values for all 17 traits.
Regional plots for (A) the 10p11.21 NDSS drive/priority factor locus, (B) the 15q22.2 FTND time to first cigarette (TTF) locus, and (C) the 2q21.2 age of onset of weekly smoking locus. The top panel shows the SNP association results including 20 kb flanking regions from the locus and/or the farthest end of the nearest gene. Arrow indicates the direction of the gene. The bottom panel shows the LD structure of the locus in the study sample (one individual per family, index twin prioritized), including the SNPs in Table 1 as well as all the intermediate SNPs. The boxes are shaded according to D’ values (darker shading indicated higher LD), and the numbers in the boxes are the r2 values (empty boxes represent full LD).