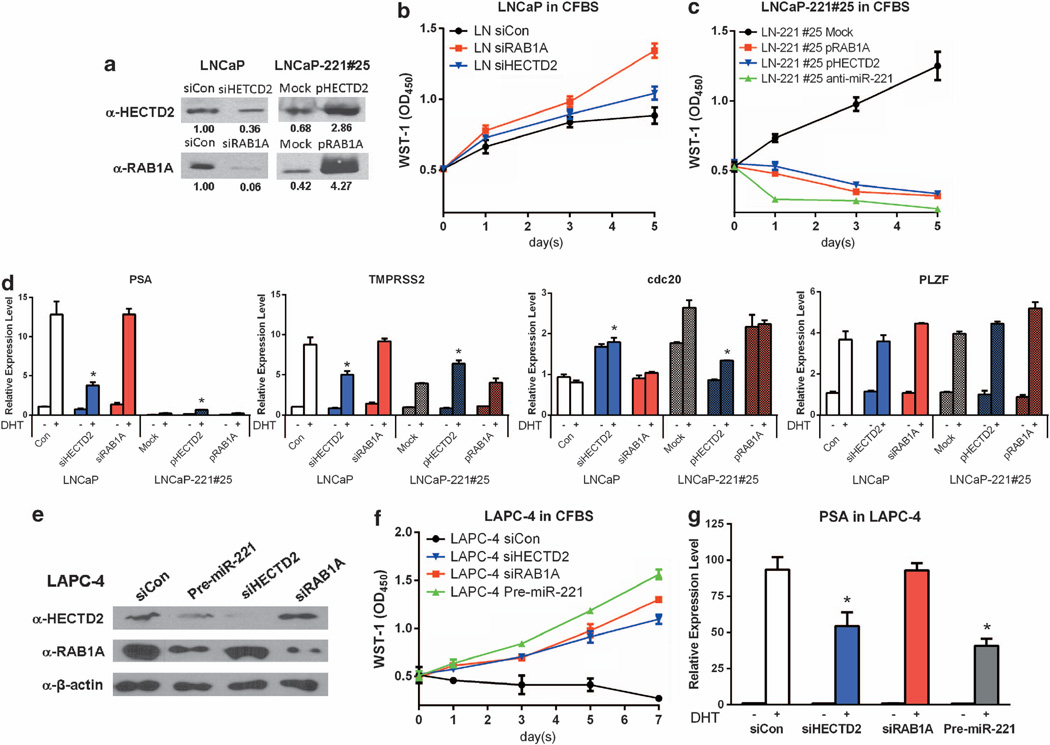
Figure 6. The impact of HECTD2 and RAB1A on androgen independent growth and DHT-induced transcription.
(a) Expression levels of HECTD2 and RAB1A measured by western blots after knocking down by siRNAs in LNCaP or overexpressing in LNCaP-221#25. Relative expression levels were indicated under individual gel images. All protein expression levels were normalized with that of β-actin, and compared with LNCaP transfected with the control siRNA. (b, c) Growth Curve of LNCaP (b) or LNCaP-221#25 (c) in androgen-free medium (CFBS), after knocking down by siRNA or overexpressing RAB1A (red lines), HECTD2 (blue lines), or transfected with the transfection control (black lines) over a 5-day time course. MiR-221 was also knocked down in LNCaP-221#25 (right panel, green line). Each dot with a bar represents the mean of triplicates±s.e.m.. (d) The impact of expression levels of HECTD2 and RAB1A on the expression of androgen-responsive signature genes, PSA, TMPRSS2, cdc20 and PLZF in LNCaP or LNCaP-221#25. Twenty-four hours after transfection with siRNA or with expressing-constructs, LNCaP or LNCaP-221#25 were treated with or without DHT for additional 24 h. (e) Expression levels of HECTD2 and RAB1A were measured by western blots after knocking down by siRNAs or overexpressing miR-221 in LAPC-4. β-actin level was used as a loading control. (f) Growth Curve of LAPC-4 in CFBS medium after knocking down RAB1A (red line), HECTD2 (blue line), or overexpressing miR-221 (green line) or transfected with siRNA control (siCon, black lines). (g) The impact of expression levels of HECTD2 and RAB1A on the expression of PSA in LAPC-4. Twenty-four hours after transfection with siRNA or with miR-221 precursors, LAPC-4 cells were treated with or without DHT for additional 24 h. The mRNA levels of different genes in each cell lines were analyzed by TaqMan quantitative real-time–PCR. The relative expression level of each gene was normalized with that of glyceraldehyde 3-phosphate dehydrogenase, and compared with cells transfected the negative control siRNA, which was arbitrarily set as 1.0 (mean (N = 3) ±s.d.). *P-value of one-way ANOVA < 0.05.

