

Abstract
Based on their higher risk of type 2 diabetes, non-Hispanic blacks (NHBs) would be expected to have higher gestational diabetes mellitus (GDM) risk compared to non-Hispanic whites (NHWs). However, previous studies have reported lower GDM risk in NHBs versus NHWs. We examined whether GDM risk was lower in NHBs and NHWs, and whether this disparity differed by age group. The cohort consisted of 462,296 live singleton births linked by birth certificate and hospital discharge data from 2004 to 2007 in Florida. Using multivariable regression models, we examined GDM risk stratified by age and adjusted for body mass index (BMI) and other covariates. Overall, NHBs had a lower prevalence of GDM (2.5 vs. 3.1 %, p < 0.01) and a higher proportion of preconception DM births (0.5 vs. 0.3 %, p ≤ 0.01) than NHWs. Among women in their teens (risk ratio 0.56, p < 0.01) and 20–29 years of age (risk ratio 0.85, p < 0.01), GDM risk was lower in NHBs than NHWs. These patterns did not change with adjustment for BMI and other covariates. Among women 30–39 years (risk ratio 1.18, p < 0.01) and ≥40 years (risk ratio 1.22, p < 0.01), GDM risk was higher in NHBs than NHWs, but risk was higher in NHWs after adjustment for BMI. Associations between BMI and GDM risk did not vary by race/ethnicity or age group. NHBs have lower risk of GDM than NHWs at younger ages, regardless of BMI. NHBs had higher risk than NHWs at older ages, largely due to racial/ethnic disparities in overweight/obesity at older ages.
Keywords: Race, Ethnicity, Birth certificates, Prenatal, Gestational diabetes, Diabetes mellitus, Type 2 diabetes mellitus
Introduction
Both type 2 diabetes and gestational diabetes mellitus (GDM) represent a defect in pancreatic β-cell response, or insulin secretion, in response to either central (hepatic) insulin resistance or peripheral (muscular and adipose tissue) insulin resistance, or both [1, 2]. While the relatively impaired insulin secretion during pregnancy resolves after delivery with the resolution of pregnancy-related insulin resistance, women with GDM still have greater insulin resistance and greater impairments in insulin secretion than otherwise healthy women [1]. Thus, women are at greater risk for developing future diabetes [3]. Based on their relatively higher risk of diabetes [4], non-Hispanic black women (NHBs) would be expected to have GDM more often than non-Hispanic white women (NHWs). However, studies conflict regarding racial/ethnic disparities [5–7]. There are several possible explanations. At younger ages, NHBs may actually have lower risk than NHWs. Such age and race interactions have been observed for other birth outcomes, such as stillbirth [8]. Since NHBs give birth at younger ages than NHWs, this might lead to a lower estimate of GDM prevalence in NHBs compared to NHWs overall and would mask higher risk in NHBs at older ages. Another possibility is that cases of preconception diabetes (DM) are misclassified as GDM [9], which could increase glucose-intolerance estimates particularly in young NHWs due to type 1 diabetes and to a lesser extent, type 2 diabetes [10]. Finally, body mass index (BMI) is a well-recognized predictor of glucose-intolerance during pregnancy, and overweight/obesity is more common in NHBs than NHWs [11]. However, the association between GDM and BMI may differ by race/ethnicity [5, 12], and it possible that observed NHB/NHW differences could vary by BMI category as well.
Florida is the fourth most populous US state and has a large number of NHW and NHB births [13]. Its birth certificate distinguishes between GDM and preconception DM and has been linked with hospital discharge data. Using this dataset, we tested the following hypotheses: (1) the prevalence of GDM in NHBs compared to NHWs would increase with increasing age, after consideration of preconception DM, and (2) this pattern would persist after adjustment for BMI.
Methods
The cohort consisted of women who delivered live singleton infants in Florida between March 2004 and December 2007. This cohort has been described previously [13]. On Florida’s revised live birth certificate, women’s diabetes status at delivery is indicated as GDM (diagnosis during pregnancy), preconception DM (diagnosis prior to pregnancy), or no diabetes. Birth certificates on which both preconception DM and GDM are indicated are sent back to the birth facility so that only a single classification is indicated on each birth certificate. In the hospital discharge records, GDM and preconception DM were identified using the International Classification of Diseases, 9th Revision code 648.8 for GDM and codes 648.0, 250.0–250.9 for preconception DM. The University of South Florida in partnership with the Florida Department of Health linked birth certificates to hospital discharge records using a multistage, stepwise approach with maternal social security number being the primary linkage variable. Ninety-eight percent of unique singleton deliveries with maternal social security numbers were successfully linked [13]. The Florida State Health Department transferred de-identified data to Centers for Disease Control and Prevention (CDC) for analysis, and this report was deemed to be institutional review board exempt in accordance CDC’s Guidelines for Defining Public Health Research and Public Health Non-Research.
In order to determine the best rules for classifying births as consistent with GDM or preconception DM, we estimated misclassification of several strategies using a previously conducted medical record review of 862 births as the reference (“Appendix”). We used the rules that resulted in the lowest misclassification, which required that the birth certificate and discharge data be concordant for GDM, preconception DM, and no DM (“Appendix”). Maternal characteristics were obtained from the birth certificate and included race/ethnicity, age, education, marital status, enrollment in the Women, Infants and Children program (WIC), insurance status, birth country, parity, any history of cigarette use, and preconception height and weight, which were used to calculate BMI. We included women who self-reported as NHB or NHW; women with missing information on race/ethnicity, with more than one race/ethnicity, or who were Hispanic were excluded from this analysis. There were 508,048 live singleton deliveries to NHB and NHW women. We excluded women who were missing data on age (n = 5), had conflicting diabetes status on the birth certificate and discharge records (n = 16,122), or who were missing diabetes status on either source (n = 1,895). We also excluded women with height <50 inches (n = 6,513) or greater than 77 inches or a preconception weight <75 pounds (n = 21,217) [14]. Our final dataset included 462,296 deliveries (91 %).
Statistical Analyses
The demographic and health characteristics of NHB versus NHW women and the prevalence of GDM and preconception DM within age group by race/ethnicity were compared using Chi square tests. Next, we calculated the unadjusted and adjusted risk ratios of GDM for NHBs compared to NHWs for each age category, excluding women with preconception DM [15]. To determine whether disparities in GDM between NHBs and NHWs varied by age, we compared the risk ratios for NHBs versus NHWs in successive age categories. In screening covariates to be included in adjusted models, we considered which covariates had the most impact upon age differences in racial/ethnic disparities. We selected BMI, nativity and WIC status by this method and included parity due to its associations with age, race/ethnicity, GDM, and BMI in other reports [16–18]. BMI was classified in categories of kg/m2 (≤18.5, 18.5–24.9, 25–29.9, 30–34.9, 35–39.9, ≥40.0). Due to the possibility that BMI had different associations with GDM risk by race/ethnicity [5], we next calculated the unadjusted and adjusted risk ratio of GDM associated with overweight and obesity in all age groups separately for NHBs and NHWs. To determine the proportion of GDM births associated with overweight and obesity, we estimated the population attributable fraction (PAF) of GDM and preconception DM pregnancies due to overweight and obesity by racial/ethnic group and age. The PAF is the reduction in GDM or preconception DM prevalence that would be expected to occur if all women in the overweight or obese categories had a GDM risk equal to that of women in the normal BMI category [19, 20]. Finally, we calculated the prevalence of GDM by race/ethnicity, age group, and BMI category in order to examine whether NHB and NHW differences were present across different categories of BMI. The SAS analysis system (version 9.2) was used for all analyses (SAS Institute, Cary, NC).
Results
Characteristics of women by race/ethnicity are shown in Table 1. While the majority of both NHBs and NHWs gave birth in their twenties, a higher proportion of NHBs gave birth at <30 years of age than NHWs. NHWs more frequently reported completing high school, being married, having private insurance, birth in the US (nativity), primaparity, and having ever smoked compared to NHBs. NHBs were more often overweight or obese and more frequently enrolled in WIC than NHWs; 13.5 % of NHBs were Haitian.
Table 1.
Demographic and behavioral characteristics of Florida women with live, singleton deliveries from March 2004 through December 2007 by race/ethnicity, n (%)
| Characteristic | Non-Hispanic black (N = 137,201) |
Non-Hispanic white (N = 325,095) |
p value |
|---|---|---|---|
| Age (years) | <0.001 | ||
| <20 | 23,827 (17.4) | 28,318 (8.7) | |
| 20–29 | 80,495 (58.7) | 169,633 (52.2) | |
| 30–39 | 30,220 (22.0) | 117,811 (36.2) | |
| ≥40 | 2,659 (1.9) | 9,333 (2.9) | |
| Education (years) | <0.001 | ||
| <12 | 32,736 (24.1) | 42,586 (13.1) | |
| 12 | 55,408 (40.7) | 93,832 (28.9) | |
| >12 | 47,885 (35.2) | 187,960 (57.9) | |
| Married | 40,283 (29.4) | 218,774 (67.3) | <0.001 |
| Enrolled in women, infant, and children program | 88,409 (65.3) | 103,610 (32.2) | <0.001 |
| Insurance status | <0.001 | ||
| Medicaid | 91,069 (66.6) | 118,900 (36.7) | |
| Private | 38,612 (28.2) | 190,513 (58.7) | |
| None | 5,521 (4.0) | 10,609 (3.3) | |
| Other | 1,501 (1.1) | 4,285 (1.3) | |
| Born in the United States (nativity) | 108,091 (78.8) | 305,377 (94.0) | <0.001 |
| Parity | <0.001 | ||
| 0 | 51,736 (38.2) | 145,721 (44.9) | |
| 1–2 | 62,668 (46.3) | 155,667 (48.0) | |
| >2 | 20,974 (15.5) | 23,100 (7.1) | |
| Cigarette use, ever | 5,175 (3.8) | 43,299 (13.7) | <0.001 |
| Preconception body mass index (kg/m2) | <0.001 | ||
| <18.5 | 5,995 (4.4) | 19,698 (6.1) | |
| 18.5–24.9 | 56,949 (41.5) | 179,180 (55.1) | |
| 25–29.9 | 36,464 (26.6) | 70,316 (21.6) | |
| 30–34.9 | 20,466 (14.9) | 32,865 (10.1) | |
| 35–39.9 | 9,858 (7.2) | 14,298 (4.4) | |
| ≥40 | 7,469 (5.4) | 8,738 (2.7) |
The unadjusted prevalence of GDM by age category and race/ethnicity are shown in Fig. 1. Overall, there was a lower proportion of GDM births in NHBs than NHWs: among NHBs, there were 3,482 GDM births (2.5 %) and among NHWs, there were 10,026 GDM births (3.1 %, p < 0.01). Among women <30 years of age, NHBs had a lower prevalence of GDM than NHWs. However, this pattern reversed among women ≥30 years of age, at which ages NHBs had a higher prevalence of GDM than NHWs.
Fig. 1.
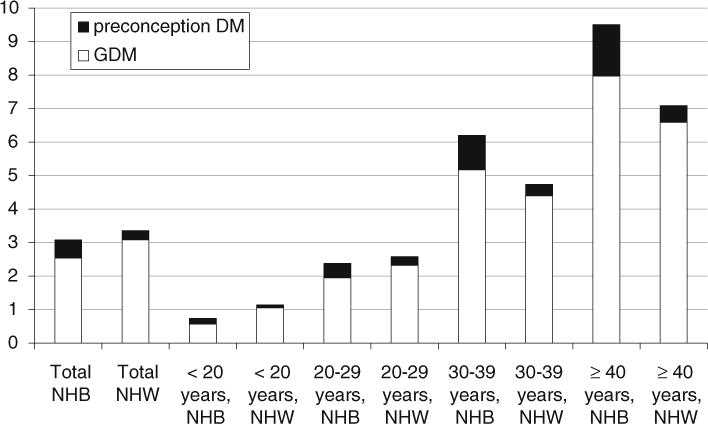
Prevalence (%) of GDM and DM among NHB and NHW by age-group. All NHB versus NHW comparisons were significant at a two tailed p ≤ 0.01
Overall, there was a higher proportion of preconception DM births in NHBs than NHWs: among NHBs, there were 741 preconception DM births (0.5 %) and among NHWs, there were 912 preconception DM births (0.3 %, p < 0.01) (Fig. 1). NHBs had a higher proportion of preconception DM births than NHWs in all age categories. However, among women <30 years of age, the proportion of all glucose-intolerant pregnancies (GDM combined with preconception DM) was still lower in NHBs than in NHWs. Thus, the higher proportion of preconception DM in NHBs versus NHWs did not entirely account for the lower proportion of glucose-intolerant pregnancies in younger NHBs versus younger NHWs.
Among women aged 20–29 years, overweight (unadjusted risk ratio 2.09, 95 % CI 1.80, 2.42) and obese NHBs (unadjusted risk ratio 3.89, 95 % CI 3.42, 4.43) had increased risks for GDM compared to normal weight NHBs. These estimates were similar to the increased risk for GDM in overweight (unadjusted risk ratio 1.87, 95 % CI 1.72, 2.04) and obese NHWs (unadjusted risk ratio 3.90, 95 % CI 3.62, 4.19) compared to normal weight NHWs. These patterns were similar after additional adjustment for nativity, WIC, and parity (results not shown). Therefore, the lower GDM risk in younger NHBs versus NHWs among women in their teens and twenties was not due to different strengths of association between BMI and GDM by race/ethnicity. Among women in other age groups, overweight and obese NHBs had increased risk for GDM compared to normal weight NHBs, and risk ratios were similar to the increased risk for GDM in overweight and obese NHWs compared to normal weight NHWs (results not shown).
Table 2 shows the prevalence of overweight and obesity by age group and race/ethnicity and the proportion of GDM pregnancies and preconception DM pregnancies attributable to overweight and obesity in NHBs versus NHWs by age group. In all age groups, NHBs were more often overweight or obese compared to NHWs. As a result, the PAF of GDM for overweight/obesity was greater in NHBs than NHWs in all age categories. However, the racial/ethnic disparity in overweight/obesity increased with age. The difference in the proportions of overweight/obese NHB and NHW women was approximately 7 % points among women <20 years, 14 % points among women aged 20–29 years, 26 % points among women aged 30–39 years, and 30 % points among women aged 40 years and older (Table 2).
Table 2.
Proportion of overweight or obese women by age group and population attributable fraction (95 % CI) of GDM and DM births due to overweight and obesity by age group, unadjusted
| Non-Hispanic black | Non-Hispanic white | p value | |
|---|---|---|---|
| Proportion of overweight and obese women (body mass index ≥25 kg/m2, years) | |||
| <20 | 37.1 % | 29.6 % | <0.001 |
| 20–29 | 54.4 % | 40.0 % | <0.001 |
| 30–39 | 65.3 % | 39.3 % | <0.001 |
| ≥40 | 69.5 % | 39.3 % | <0.001 |
| Population attributable fraction for GDM (years) | |||
| <20 | 46.7 | 33.0 | 0.075 |
| 20–29 | 53.1 | 41.9 | <0.001 |
| 30–39 | 52.8 | 45.0 | <0.001 |
| ≥40 | 58.7 | 49.3 | 0.24 |
| Population attributable fraction for preconception DM (years) | |||
| <20 | 41.7 | 21.6 | 0.30 |
| 20–29 | 52.2 | 34.0 | <0.001 |
| 30–39 | 74.9 | 53.8 | <0.001 |
| ≥40 | 67.1 | 58.5 | 0.64 |
These data suggest that the risk of GDM increases more rapidly in NHBs compared to NHWs as women age largely (although not entirely) because of the greater prevalence of overweight and obesity in NHBs versus NHWs at older ages.
Table 3 presents the prevalence of GDM by race/ethnicity, age group, and BMI category. This table shows that among teenagers and women in their 20s, GDM is more common in NHWs than NHBs within and across all categories of BMI. Therefore, the higher prevalence of GDM among NHWs is not entirely explained by a different BMI distributionin NHWs and NHBs. Among women intheir 30s and women in their 40s, this table shows that NHBs have a higher overall prevalence of GDM than NHWs. Within each BMI category, NHWs paradoxically have a higher prevalence of GDM than NHBs. However, the prevalence of GDM increases withincreasing BMI, and NHBs have higher BMIs than NHWs. Thus, among women in their 30s or 40s, NHBs have an overall higher prevalence of GDM.
Table 3.
Prevalence of gestational diabetes mellitus in NHW and NHB by age and BMI and differences in prevalence (95 % CI)
| BMI (kg/m2) | Mother’s age ≤20 years
|
Mother’s age 20–29 years
|
Mother’s age 30–39 years
|
Mother’s age ≥40 years
|
||||||||
|---|---|---|---|---|---|---|---|---|---|---|---|---|
| NHW | NHB | Difference (95 % CI) | NHW | NHB | Difference (95 % CI) | NHW | NHB | Difference (95 % CI) | NHW | NHB | Difference (95 % CI) | |
| 18.5–24.9 | 0.66 | 0.32 | 0.34 (0.19, 0.50) | 1.35 | 0.94 | 0.41 (0.28, 0.54) | 2.46 | 2.45 | 0.00 (−0.32, 0.33) | 3.36 | 3.35 | 0.01 (−1.35, 1.36) |
| 25–29.9 | 1.22 | 0.66 | 0.57 (0.20, 0.94) | 2.53 | 1.96 | 0.57 (0.32, 0.82) | 5.13 | 5.13 | 0.00 (−0.52, 0.52) | 8.96 | 8.06 | 0.90 (−1.25, 3.04) |
| 30–34.9 | 2.37 | 1.3 | 1.07 (0.27, 1.87) | 4.16 | 3.02 | 1.14 (0.72, 1.56) | 8.94 | 7.07 | 1.87 (1.02, 2.72) | 12.78 | 10.78 | 2.00 (−1.30, 5.31) |
| 35–39.9 | 3.21 | 2.15 | 1.07 (−0.54, 2.67) | 6.01 | 3.49 | 2.52 (1.82, 3.21) | 12.14 | 9.4 | 2.74 (1.30, 4.18) | 19.95 | 14.71 | 5.24 (−1.14, 11.62) |
| ≥40 | 4.63 | 2.39 | 2.24 (−0.48, 4.97) | 8.16 | 5.53 | 2.63 (1.63, 3.63) | 15.05 | 9.78 | 5.27 (3.46, 7.09) | 21.55 | 17.07 | 4.47 (−4.55, 13.49) |
| For all women | 1.05 | 0.61 | 0.45 (0.28, 0.61) | 2.4 | 2.03 | 0.36 (0.24, 0.49) | 4.52 | 5.29 | −0.76 (−1.05, −0.48) | 6.74 | 8.19 | −1.46 (−2.64, −0.28) |
Among women aged less than 30 years, NHBs had lower risk of GDM than NHWs both before and after adjustment (Fig. 2). Therefore, the lower GDM risk in NHBs versus NHWs at younger ages was not due to BMI or other factors in NHBs versus NHWs. Among women aged 30 years or older, NHBs had a higher risk of GDM than NHWs before adjustment for BMI, but a lower risk after adjustment for BMI. This suggests that the greater frequency of overweight/obesity in NHBs contributed to racial/ethnic differences in GDM risk at older ages.
Fig. 2.
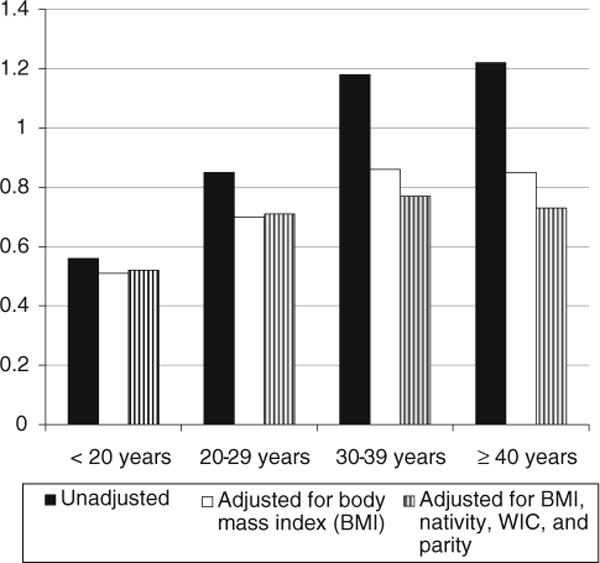
Risk ratio for gestational diabetes mellitus in NHBs versus NHWs; a risk ratio < 1 indicates lower risk in NHBs. All NHB versus NHW comparisons are significant at a two-tailed p < 0.01. Model 1 is unadjusted; Model 2 (solid white bars) is adjusted for body mass index (BMI) categories in Table 1; model 3 (striped bars) is adjusted for BMI, nativity, WIC enrollment, and parity
Figure 2 also shows the risk ratio for GDM in NHBs versus NHWs by age category, before and after adjustment for BMI, nativity, WIC, and parity. In unadjusted models, the risk ratio of GDM in NHBs versus NHWs increased between women aged <20 years versus 20–29 years (p < 0.01) and between women aged 20–29 years versus 30–39 years (p < 0.01), although the increase was not significant between women aged 30–39 years versus women aged 40 years and older (p = 0.35). After adjustment for BMI, this difference in risk ratios was less marked due to greater prevalence of overweight and obesity in NHBs compared to NHWs.
We conducted several sensitivity analyses. When we changed the classification rules, that is, when we defined GDM to be births for which the hospital discharge record showed GDM and the birth certificate record showed either GDM or no diabetes, and defining preconception DM to be births for which the hospital discharge record showed preconception DM and the birth certificate record showed either preconception DM or no diabetes, the patterns in disparities persisted. In addition, for women younger than 20 years, we used 2,000 CDC Growth Charts to calculate BMI-for-age percentile scores [21]. Using the alternative BMI categories did not change the pattern of results (data not shown). In order to address the possibility of residual confounding by age, we also created models that adjusted for age. These models did not alter the pattern of effects (results not shown). Finally, we created tables that stratified by nativity as well as BMI and age-group, and did not find significant associations between GDM and nativity, suggesting that this factor did not contribute to NHB/NHW GDM differences.
Discussion
In an examination of data from over 450,000 deliveries, we found that NHBs had a lower prevalence of GDM than NHWs. This was due to lower GDM risk in NHBs versus NHWs at younger ages, combined with the fact that the majority of women gave birth at less than 30 years of age. This lower risk in NHBs persisted after adjustment for BMI. Among women aged 30 years and older, NHBs had a higher risk of GDM than NHWs which was largely due to the increased proportion of NHBs versus NHWs who were overweight and obese. Although we found that NHBs more often had preconception DM than NHWs, the total proportion of glucose-intolerant pregnancies was still lower in NHBs than NHWs.
Our report is unique in that we examined the prevalence of GDM by age group and by race/ethnicity, before and after adjustment for such factors as BMI and nativity. The higher prevalence of GDM in older NHBs versus NHWs and the lower prevalence of GDM in younger NHBs versus NHWs, combined with variation in age distribution between studies, could potentially explain the differences in age-adjusted prevalence of GDM across previous studies.
In addition to reports noting a lower prevalence of GDM in NHBs compared to NHWs [5–7], other reports note a similar [16, 22–24] or higher age-adjusted prevalence [9, 17, 25, 26] of GDM in NHBs compared to NHWs. Reports from large managed care organizations have found that NHBs are less often [5], similarly [16], or more frequently [9, 25] affected with GDM than NHWs. Our inclusion of teenagers and women 20–29 years of age, who tend to be underinsured, may have resulted in the inclusion of more NHBs at low risk for GDM, resulting in our findings of greater differences in NHBs versus NHWs in this study as compared to studies that found prevalences in NHBs ranging from 2.8 versus 6.3 % [9, 16]. These studies were based in large managed care organizations in California conducted in the 1990s and early 2000s and thus may have captured a more affluent population as well as women at different risk. Almost two-thirds of NHBs and 1/3 of NHWs in our study were enrolled in WIC, suggesting that the population in this study was probably less affluent than in those reports.
Studies may also have reported varying NHB versus NHW disparities due to different classification rules for GDM and preconception DM. Using classification rules where the diagnosis of GDM could be made based on either the birth certificate or hospital discharge data, where 52 % of women had agreement on both sources of data Savitz et al. [17], found a higher prevalence of GDM in NHBs than in NHWs. Using hospital discharge data, Getahun et al. [26] and Cabacungan et al. [24] also found a higher prevalence of GDM among NHBs versus NHWs. Using self-reported GDM, Hunsberger et al. [23] found a similar prevalence of GDM in NHBs and NHWs in Oregon. When we performed sensitivity analysis exploring the impact of using different rules to classify GDM and preconception DM, we did not find a significant change in the NHW versus NHB it is possible that NHBs were more likely to have misclassification of preconception DM and GDM than NHWs; type 2 DM is easier to misclassify as GDM and is more common among NHBs. However, we note that this would have exaggerated the pattern of effects we observed, i.e. the lower prevalence of glucose-intolerance in younger NHBs versus NHWs and the higher prevalence of glucose-intolerance in older NHBs versus NHWs.disparities.
Studies may have reported varying NHB versus NHW disparities due to regional variations in these communities. In Hawaii, Pedula et al. [7] found that NHBs had the lowest prevalence of GDM and the lowest plasma glucose levels compared to other racial/ethnic groups, and it is possible that NHBs in Hawaii and Florida represent a different population than NHBs in other regions of the country; for example, Florida’s NHB community includes Haitians, who are not necessarily present in other NHB communities. Of note, Pedula et al. and our current report both noted lower prevalences of age-adjusted GDM than other reports, suggesting that the NHB communities in Florida and Hawaii could possibly be healthier than in New York [17] or nationally [24, 26].
Body mass index is a well-recognized risk factor for GDM as well as preconception DM and also varies by age and race/ethnicity [12]. When we investigated whether BMI explained the lower risk of GDM in younger NHBs, we found that NHBs were more often overweight than NHWs in all age categories, that NHBs and NHWs aged 20–29 years had similar associations between overweight and obesity and risk of GDM, and that NHBs aged 20–29 years actually had a higher population attributable fraction of GDM due to overweight or obesity than NHW. Thus, BMI was not the reason that NHBs had lower risk for GDM than NHWs at younger ages. Adjustment for BMI decreased the risk among NHBs versus NHWs in older age groups. Therefore, the greater risk for GDM among older NHB versus older NHW women was largely due to the greater proportions of NHB women who were overweight and obese at these ages. The weight gain associated with pregnancy can accumulate with successive pregnancies for both NHBs and NHWs [27, 28], and it is possible that this cumulative weight gain negatively impacts glucose tolerance. Foreign nativity is also a risk factor for GDM, and in particular NHBs born outside the US have been reported to have GDM more often than NHBs born in the US [16, 29] However, in our report, adjustment for nativity did not reduce the racial/ethnic differences in GDM by age group, nor was nativity itself associated with significant GDM risk.
Strengths of our report include its population-based sample, large number of deliveries, examination of preconception DM as well as GDM, use of medical records to determine the best rules for classifying GDM and preconception DM diagnosis from birth certificates and hospital discharge data, and adjustment for key variables. Weaknesses include lack of glucose levels to confirm the diagnosis of GDM, although such a restriction currently precludes a population-based assessment. We could not distinguish between type 1 and type 2 diabetes and this may have confounded relationships between preconception DM and BMI. Also, our data may not be generalizable to women in states other than Florida or to women whose pregnancies did not result in singleton live births.
In conclusion, we found a lower prevalence of GDM overall in NHBs versus NHW, due to the greater proportion of births at less than 30 years of age to women who were NHB and the lower prevalence of GDM at these younger ages. The lower prevalence of glucose-intolerant pregnancies in younger NHBs versus NHWs was not explained by the more frequent preconception DM in NHBs or by BMI. The higher prevalence of GDM in older NHBs versus NHWs was largely due to the greater frequency of overweight and obesity in NHBs versus NHWs in this age group. Our results suggest identification of high-risk groups to target for GDM prevention and perhaps for GDM screening should consider risk-stratification based on age by race/ethnicity categories. Younger normal weight NHB women may be at lowest risk, while overweight or older NHB women may be at highest risk. Finally, it is unknown why age-specific risk of preconception DM and GDM differs for NHBs compared to NHWs. Further investigation is needed to determine if these disparities are due to differential rates in screening or differences in the progression of GDM and preconception DM between NHBs and NHWs.
Appendix: Alternative Rules for Assigning Diabetes Status Based On birth certificate and hospital discharge diabetes status
For each birth, we had diabetes status classified by both the birth certificate (BC) record and the hospital discharge (HD) record as one of the following:
Gestational diabetes (GDM)
Preconception diabetes (PDM)
No diabetes (NDM)
Using the data presented from a medical record review, women who had GDM on both BC and HD were classified as having GDM, women who had PDM on both sources were classified as having PDM, and women who had NDM on both sources were classified as having NDM. The following paragraphs describe the rationale for that decision.
We used the following results of a review of medical records from a random sample of births to judge the likely diabetes status of each BC-HD combination (Table 4).
Table 4.
Results of medical records review of a sample of births
| Birth certificate | Hospital discharge | Diabetes status per medical records review
|
Total | |||
|---|---|---|---|---|---|---|
| GDM | PDM | Both GDM and PDM | NDM | |||
| PDM | PDM | 4 | 18 | 4 | 0 | 26 |
| PDM | GDM | 3 | 3 | 0 | 0 | 6 |
| PDM | NDM | 2 | 0 | 0 | 2 | 4 |
| GDM | PDM | 3 | 5 | 1 | 0 | 9 |
| GDM | GDM | 41 | 1 | 0 | 1 | 43 |
| GDM | NDM | 3 | 0 | 0 | 8 | 11 |
| NDM | PDM | 3 | 8 | 1 | 0 | 12 |
| NDM | GDM | 27 | 2 | 1 | 1 | 31 |
| NDM | NDM | 25 | 4 | 1 | 656 | 686 |
| Total | 111 | 41 | 8 | 668 | 828 | |
For example, we projected births with the PDM–PDM combination to be 4/26 GDM, 18/26 PDM, and 4/26 Both GDM and PDM; we assigned the ‘Both GDM and PDM’ category a final status of PDM.
Table 5 shows the diabetes status of 477,453 births to NHB and NHW mothers projected based on the medical records sample.
Table 5.
Diabetes status of births to NHB and NHW mothers projected from birth certificate and hospital discharge diabetes status based on proportions in the medical records sample
| Birth certificate | Hospital discharge | No. of records (column %) | Projected per medical records sample
|
||
|---|---|---|---|---|---|
| GDM (row %) | PDM (row %) | NDM (row %) | |||
| PDM | PDM | 1,653 (0.35) | 254 (15.4) | 1,399 (84.6) | 0 (0.0) |
| PDM | GDM | 1,404 (0.29) | 702 (50.0) | 702 (50.0) | 0 (0.0) |
| PDM | NDM | 533 (0.11) | 267 (50.0) | 0 (0.0) | 267 (50.0) |
| GDM | PDM | 853 (853) | 284 (33.3) | 569 (66.7) | 0 (0.0) |
| GDM | GDM | 13,508 (2.83) | 12,879 (95.3) | 314 (2.3) | 314 (2.3) |
| GDM | NDM | 3,834 (0.80) | 1,046 (27.3) | 0 (0.0) | 2,788 (72.7) |
| NDM | PDM | 1,148 (0.24) | 287 (25.0) | 861 (75.0) | 0 (0.0) |
| NDM | GDM | 7,385 (1.55) | 6,432 (87.1) | 715 (9.7) | 238 (3.2) |
| NDM | NDM | 447,135 (93.65) | 16,295 (3.6) | 3,259 (0.7) | 427,581 (95.6) |
| Totals | 477,453 | 38,447 (8.1) | 7,818 (1.6) | 431,188 (90.3) | |
From Table 5, the projected GDM prevalence is 8.1 % and the projected PDM prevalence is 1.6 %.
To evaluate which BC-HD combinations from Table 5 to classify as GDM, which to classify as PDM, and which to classify as NDM, we computed the sensitivity, specificity, misclassification rates, and apparent prevalence for both GDM and PDM for a variety of combinations. For all the rules, we classified births with NDM in both the BC and HD record as NDM. Tables 6 and 7 show the evaluation measures for alternative rules for classifying GDM and PDM, respectively.
Table 6.
Sensitivity, specificity, apparent prevalence, and misclassification rates for alternative rules for classifying GDM cases
| BC-HD categories | N births classified GDM | N births projected GDM | Sensitivity percent | Specificity percent | Percent GDM misclassified | Apparent GDM prevalence percent |
|---|---|---|---|---|---|---|
| GDM–GDM | 13,508 | 12,880 | 44.1 | 99.9 | 4.6 | 2.9 |
| GDM–GDM | 20,893 | 19,312 | 54.2 | 99.9 | 7.6 | 4.5 |
| NDM-GDM | ||||||
| PDM-GDM | 22,297 | 20,014 | 55.1 | 99.9 | 10.2 | 4.7 |
| GDM–GDM | ||||||
| NDM-GDM | ||||||
| GDM–GDM | 24,727 | 20,357 | 55.5 | 99.2 | 17.7 | 5.2 |
| GDM-NDM | ||||||
| NDM-GDM |
Table 7.
Sensitivity, specificity, apparent prevalence, and misclassification rates for alternative rules for classifying PDM cases
| BC-HD categories | N births classified PDM | N births projected PDM | Sensitivity percent | Specificity percent | Percent PDM misclassified | Apparent PDM prevalence percent |
|---|---|---|---|---|---|---|
| PDM–PDM | 1,653 | 254 | 30.0 | 100.0 | 15.4 | 0.4 |
| PDM–PDM | 2,801 | 541 | 40.9 | 100.0 | 19.3 | 0.6 |
| NDM-PDM | ||||||
| PDM–PDM | 3,654 | 826 | 46.5 | 100.0 | 22.6 | 0.8 |
| GDM-PDM | ||||||
| NDM-PDM | ||||||
| PDM–PDM | 5,058 | 1,527 | 52.0 | 100.0 | 30.2 | 1.1 |
| PDM-GDM | ||||||
| GDM-PDM | ||||||
| NDM-PDM |
We chose to use the classification rules with the lowest misclassification rates, which not surprisingly turned out to be using the BC-HD combinations for which the BC and HD records were consistent: the GDM–GDM category for classifying births as GDM (Table 6) and the PDM–PDM category for classifying births as PDM (Table 7). Because our key analyses were based on relative risks, we judged low misclassification rates to be the most desirable feature of our analysis dataset.
Low sensitivities and underestimation of prevalence resulted from two features of the data: [1] The BC-HD categories we excluded because of high misclassification rates included a substantial number of GDM and PDM cases [2]. The percentages of GDM and PDM cases in the group we classified as NDM were small, but those cases represented a substantial portion of the GDM and PDM cases in the dataset because 94 % of the births in the dataset were in the NDM category (Table 5).
Contributor Information
Catherine Kim, Email: cathkim@umich.edu, Departments of Medicine and Obstetrics and Gynecology, University of Michigan, 2800 Plymouth Road, Building 16, Room 430W, Ann Arbor, MI 48109-2800, USA.
Shin Y. Kim, Division of Reproductive Health, National Center for Chronic Disease Prevention and Health Promotion, Centers for Disease Control and Prevention, Atlanta, GA, USA
William Sappenfield, Department of Public Health and College of Medicine, University of South Florida, Tampa, FL, USA.
Hoyt G. Wilson, Division of Reproductive Health, National Center for Chronic Disease Prevention and Health Promotion, Centers for Disease Control and Prevention, Atlanta, GA, USA
Hamisu M. Salihu, Department of Public Health and College of Medicine, University of South Florida, Tampa, FL, USA
Andrea J. Sharma, Division of Reproductive Health, National Center for Chronic Disease Prevention and Health Promotion, Centers for Disease Control and Prevention, Atlanta, GA, USA
References
- 1.Buchanan T, Xiang A, Peters R, et al. Response of pancreatic beta-cells to improved insulin sensitivity in women at high risk for type 2 diabetes. Diabetes. 2000;49(5):782–788. doi: 10.2337/diabetes.49.5.782. [DOI] [PubMed] [Google Scholar]
- 2.Buchanan T. Pancreatic beta-cell loss and preservation in type 2 diabetes. Clinical Therapeutics. 2003;25:B32–B46. doi: 10.1016/s0149-2918(03)80241-2. [DOI] [PubMed] [Google Scholar]
- 3.Kim C, Newton K, Knopp R. Gestational diabetes and incidence of type 2 diabetes mellitus: A systematic review. Diabetes Care. 2002;25(10):1862–1868. doi: 10.2337/diacare.25.10.1862. [DOI] [PubMed] [Google Scholar]
- 4.Harris M, Flegal K, Cowie C, et al. Prevalence of diabetes, impaired fasting glucose and impaired glucose tolerance in US adults: The third national health and nutrition examination survey. Diabetes Care. 1998;21:518–524. doi: 10.2337/diacare.21.4.518. [DOI] [PubMed] [Google Scholar]
- 5.Hedderson M, Ehrlich S, Sridhar S, et al. Racial/ethnic disparities in the prevalence of gestational diabetes mellitus by BMI. Diabetes Care. 2012;35:1492–1498. doi: 10.2337/dc11-2267. [DOI] [PMC free article] [PubMed] [Google Scholar]
- 6.Wang Y, Chen L, Xiao K, et al. Increasing incidence of gestational diabetes mellitus in Louisiana, 1997–2009. Journal of Women’s Health. 2012;21(3):319–325. doi: 10.1089/jwh.2011.2838. [DOI] [PubMed] [Google Scholar]
- 7.Pedula K, Hillier T, Schmidt M. Ethnic differences in gestational oral glucose screening in a large US population. Ethnicity and Disease. 2009;19(4):414–419. [PubMed] [Google Scholar]
- 8.Geronimus A. Understanding and eliminating racial inequalities in women’s health in the United States: The role of the weathering conceptual framework. Journal of the American Medical Women’s Association. 2001;56(4):133–136. [PubMed] [Google Scholar]
- 9.Lawrence J, Contreras R, Chen W, et al. Trends in the prevalence of pre-existing diabetes and gestational diabetes mellitus among a racially/ethnically diverse population of pregnant women, 1999–2005. Diabetes Care. 2010;33(3):569–576. doi: 10.2337/dc07-2345. [DOI] [PubMed] [Google Scholar]
- 10.Dabelea D, Bell R, D’Agostino R, Jr, et al. Incidence of diabetes in youth in the United States. JAMA The Journal of The American Medical Association. 2007;297(24):2716–2724. doi: 10.1001/jama.297.24.2716. [DOI] [PubMed] [Google Scholar]
- 11.Kim S, England L, Wilson H, et al. Percentage of gestational diabetes mellitus attributable to overweight and obesity. American Journal of Public Health. 2010;100(6):1047–1052. doi: 10.2105/AJPH.2009.172890. [DOI] [PMC free article] [PubMed] [Google Scholar]
- 12.Shah A, Stotland N, Cheng Y, et al. The association between body mass index and gestational diabetes mellitus varied by race/ethnicity. American Journal of Perinatology. 2011;28:515–520. doi: 10.1055/s-0031-1272968. [DOI] [PMC free article] [PubMed] [Google Scholar]
- 13.Kim S, England L, Sappenfield W, et al. Racial/ethnic differences in the percentage of gestational diabetes mellitus cases attributable to overweight and obesity, Florida, 2004–2007. Preventing Chronic Disease. 2012 doi: 10.5888/pcd9.110249. (in press) (epub). [DOI] [PMC free article] [PubMed] [Google Scholar]
- 14.Park S, Sappenfield W, Bish C, et al. Reliability and validity of birth certificate prepregnancy weight and height among women enrolled in prenatal WIC program: Florida, 2005. Maternal and Child Health Journal. 2011;15(7):851–859. doi: 10.1007/s10995-009-0544-4. [DOI] [PubMed] [Google Scholar]
- 15.Flanders W, Rhodes P. Large sample confidence intervals for regression standardized risks, risk ratios, and risk differences. Journal of Chronic Diseases. 1987;40(7):697–704. doi: 10.1016/0021-9681(87)90106-8. [DOI] [PubMed] [Google Scholar]
- 16.Hedderson M, Darbinian J, Ferrara A. Disparities in the risk of gestational diabetes by race-ethnicity and country of birth. Paediatric and Perinatal Epidemiology. 2010;24(5):441–448. doi: 10.1111/j.1365-3016.2010.01140.x. [DOI] [PMC free article] [PubMed] [Google Scholar]
- 17.Savitz D, Janevic T, Engel S, et al. Ethnicity and gestational diabetes in New York City, 1995–2003. BJOG. 2008;115:969–978. doi: 10.1111/j.1471-0528.2008.01763.x. [DOI] [PubMed] [Google Scholar]
- 18.Clinical guidelines on the identification, evaluation, and treatment of overweight and obesity in adults: the evidence report. Bethesda, MD: National Heart, Lung, Blood Institute in cooperation with the National Institute of Diabetes and Digestive and Kidney Disease 1998; Contract No.: 98-4083. [Google Scholar]
- 19.Levine B. The other causality question: Estimating attributable fractions for obesity as a cause of mortality. International Journal of Obesity. 2008;32(Suppl 3):S4–S7. doi: 10.1038/ijo.2008.81. [DOI] [PubMed] [Google Scholar]
- 20.Graubard B, Koren E. Predictive margins with survey data. Biometrics. 1999;55:652–699. doi: 10.1111/j.0006-341x.1999.00652.x. [DOI] [PubMed] [Google Scholar]
- 21.Fernandez I, Olson C, De Ver Dye T. Discordance in the assessment of prepregnancy weight status of adolescents: A comparison between the centers for disease control and prevention sex- and age-specific body mass index classification and the institute of medicine-based classification used for maternal weight guidelines. Journal of the American Dietetic Association. 2008;108(6):998–1002. doi: 10.1016/j.jada.2008.03.012. [DOI] [PMC free article] [PubMed] [Google Scholar]
- 22.Hunt K, Marlow N, Gebregziabher M. Impact of maternal diabetes on birthweight is greater in non-Hispanic blacks than in non-Hispanic whites. Diabetologia. 2012;55(4):971–980. doi: 10.1007/s00125-011-2430-z. [DOI] [PMC free article] [PubMed] [Google Scholar]
- 23.Hunsberger M, Rosenberg K, Donatelle R. Racial/ethnic disparities in gestational diabetes mellitus: Findings from a population-based survey. Women’s Health Issues. 2010;20(5):323–328. doi: 10.1016/j.whi.2010.06.003. [DOI] [PubMed] [Google Scholar]
- 24.Cabacungan E, Ngui E, McGinley E. Racial/ethnic disparities in maternal morbidities: A statewide study of labor and delivery hospitalizations in Wisconsin. Maternal and Child Health Journal. 2011;16(7):1455–1467. doi: 10.1007/s10995-011-0914-6. [DOI] [PubMed] [Google Scholar]
- 25.Dabelea D, Snell-Bergeon J, Hartsfield C, et al. Increasing prevalence of gestational diabetes mellitus (GDM) over time and by birth cohort. Kaiser permanente of colorado GDM screening program. Diabetes Care. 2005;28:579–584. doi: 10.2337/diacare.28.3.579. [DOI] [PubMed] [Google Scholar]
- 26.Getahun D, Nath C, Ananth C, et al. Gestational diabetes in the United States: Temporal trends 1989 through 2004. American Journal of Obstetrics and Gynecology. 2008;198:525. doi: 10.1016/j.ajog.2007.11.017. [DOI] [PubMed] [Google Scholar]
- 27.Gunderson E, Murtagh M, Lewis C, et al. Excess gains in weight and waist circumference associated with child-bearing: The CARDIA study. International Journal of Obesity. 2004;28:525–535. doi: 10.1038/sj.ijo.0802551. [DOI] [PMC free article] [PubMed] [Google Scholar]
- 28.Gore S, Brown D, West D. The role of postpartum weight retention in obesity among women: A review of the evidence. Annals of Behavioral Medicine. 2003;26(2):146–159. doi: 10.1207/S15324796ABM2602_07. [DOI] [PubMed] [Google Scholar]
- 29.Kieffer E, Martin J, Herman W. The impact of nativity on the prevalence of diabetes during pregnancy among US ethnic groups. Diabetes Care. 1999;22(5):729–735. doi: 10.2337/diacare.22.5.729. [DOI] [PubMed] [Google Scholar]