

Abstract
Whole chromosome instability (CIN) is a common feature of cancer cells and has been linked to increased tumor evolution and metastasis. Several studies have shown that the loss of the pRB tumor suppressor causes mitotic defects and chromosome missegregation. pRB is inactivated in many types of cancer and this raises rhe possibility that the ;loss of pRB may be ageneral cause of ICN in tumors. Paradoxically, retinoblastoma tumor cells have a relatively stable karyotype and currently the circumstances in which pRB inactivation causes CIN in human cancers are unclear. Here we utilize a FISH-based approach to score numerical heterogenity in chromosome copy number as a readout of CIN. Using this technique, we show that combined high levels of CIN correlate with the combined inactivation of pRB and p53 and that this association is evident in two independent panels of cancer cell lines. Retinoblastoma cell lines characteristically retain a wild-type p53 gene, providing an opportunity to test the relevance of this functional relationship. We show that retinoblastoma cell lines display the mitotic defects seen when pRB is depleted from non-transformed cells but that the presence of wild type p53 suppresses the accumulation of aneuploid cells. A similar synergy between pRB and p53 inactivation was observed in HCT116 cells. These results suggest that the loss of pRB promotes segregation errors while loss of p53 allows tolerance and continued proliferation of the resulting, genomically unstable cancer cells. Hence it is the cooperative effect of inactivation both pRB and p53 tumor suppressor pathways that promotes CIN.
Keywords: heterogeneity, aneuploidy, CIN, retinoblastoma, TP53
Introduction
Genomic instability is a feature of most tumor cells (1). This change often includes a high frequency of whole chromosome gains and losses termed chromosome instability(2–6) (CIN). CIN, and the aneuploidy that results from CIN, have long been linked to advanced tumor grade, poor response to chemotherapeutics, and tumor evolution(3, 7–13).
Numerous regulators of mitotic fidelity contribute to genome stability. Mutations affecting proteins that are directly involved in chromosome segregation and mitotic checkpoints have been associated with hereditary cancers, and are observed in a subset of specific types of cancers (14–17). However, efforts to identify a mitotic protein that is commonly inactivated in sporadic tumors have been unsuccessful(3, 18, 19) and the genetic (or epigenetic) changes that cause CIN in the majority of cancers are not known. One of the confounding issues is that CIN is a complex phenotype(20). For changes in chromosome number to be common in a population of tumor cells, these cells have to develop the persistent mitotic errors that promote whole chromosome mis-segregation, and they have to acquire an ability to tolerate an aneuploid genome. It is likely therefore that CIN is the compound effect of several changes, rather than the result of a single mutation.
Multiple studies have shown that the presence of wild-type p53 limits the proliferation of cells that experience chromosome segregation errors (20–22). Although the p53 tumor suppressor is frequently inactivated in tumors (23) and the ability of p53 to suppress the proliferation of aneuploid and polyploid cells is well established in both tissue culture cells and tumor models (24), attempts to demonstrate a significant statistical association between p53 status and CIN in panels of human tumor samples have been unsuccessful (25).
A second tumor suppressor gene that has been liked to CIN is the retinoblastoma susceptibility gene (RB1). Inactivation of RB1 is an initiating event in retinoblastoma and patients that inherit a mutant allele of RB1 are predisposed to other cancers later in life (26–28). Numerous studies have demonstrated that inactivation of the pRB pathway increases chromosome mis-segregation and promotes aneuploidy (reviewed in (29) and (30–32)). However, a recent study has shown that retinoblastomas, paradoxically, have a relatively stable genome(33). If pRB inactivation does indeed cause CIN and aneuploidy in tumor cells, then it is important to explain why retinoblastoma, a cancer that is triggered by homozygous mutation of RB1, apparently lacks these features.
Retinoblastomas are unusual: they are one of only a few types of tumors that routinely preserve wild type p53. It has been argued that p53 is functionally compromised in retinoblastomas by increased expression of MDMX(34–36). Nevertheless, the fact that retinoblastoma retain an intact p53 gene led us to hypothesize that this protein might have sufficient activity to suppress aneuploidy. We speculated that it is the synergistic effects of pRB pathway defects (that undermine mitotic fidelity) and p53 inactivation (that allow aneuploid cells to proliferate) that promote CIN in other types of tumors.
Here we present several lines of evidence in support of this idea. Using two independent panels of tumor cell lines, we show that a high level of CIN correlates with the combined loss of p53 and pRB function. We show that retinoblastoma cells do indeed exhibit the mitotic defects and segregation errors that are seen following the depletion of pRB from primary cells and that are evident in CIN tumor cells. As evidence that the endogenous p53 protein is functional in retinoblastoma cells, we demonstrate that it is stabilized in response to DNA damage, and that it limits the accumulation of aneuploid cells. Together these results indicate that the presence of an intact p53 gene likely explains the stable karyotype of retinoblastoma cells. Moreover, we propose that the synergistic effects of pRB and p53 inactivation could provide a general mechanism to promote CIN in human tumors.
Results
Combined p53 and pRB functional status is an indicator of CIN
In a previously published characterization of the karyotype complexity of a subset of NCI lines, Roschke et al used chromosome copy number heterogeneity (numerical heterogeneity (NH)) to give a measure of whole chromosome instability(25). Although p53 mutation is known to suppress the proliferation of aneuploid and polyploid cells, the authors noted that any potential link between p53 status and CIN failed to reach statistical significance. We reexamined this data using information from (Sanger database: www.sanger.ac.uk) on the status of p53, RB1 and CDKN2A (p16INK4A/p14ARF) in this collection of cell lines. As previously described, p53 status was not significantly associated with CIN, and this was true whether we considered p53 status alone, or p53 together with p14Arf. Similarly, the inactivation of pRB did not show a statistically significant association with CIN. For this, we assumed that pRB function is compromised in cell lines that are either homozygous mutant for RB1 or deleted for p16INK4A. However, a significant association was observed between CIN and the lines that had both homozygous mutation of p53 and inactivation of the pRB pathway (Supplemental Figure 1; Fisher test: p=0.0359). Almost half of the lines with lesions in both p53 and the pRB pathway exhibited high CIN. In contrast, only ~16% of lines with lesions in only one of these tumor suppressor pathways were characterized as high CIN.
To test whether this association is evident in a second, independent panel of cell lines we examined a collection of non-small cell lung cancer (NSCLC) cells. As described by Roschke and others (37, 38), we used numerical heterogeneity (NH) within a population as a marker of CIN. In these experiments we quantified chromosome copy number in the NSCLC cell lines using centromeric FISH probes for at least two different chromosomes. The degree of numerical heterogeneity was scored for each probe as the percent of cells differing for the modal chromosome copy number for a given chromosome in that population. Variation in chromosome copy number was similar for each chromosome scored in a single cell line, indicating that it is unlikely to be caused by stable subclonal populations. The value of NH did not directly correspond to the ploidy of the cells, supporting the idea that it provides a measure of CIN-induced heterogeneity rather than a representation of the overall degree of ploidy (Supplemental Figure 2).
To assess the status of the pRB or p53 pathways we identified the cell lines with mutations or deletions of TP53, RB1, and p16/CDKN2A. None of the NSCLC lines showed copy gains in CCND1, but several had copy gains in CDK6 and/or CDK4 (greater than 8 focal gains of the respective gene) that are linked to the functional inactivation of pRB (Sanger database; www.sanger.ac.uk and Genomics of Drug Sensitivity in Cancer; www.cancerRxgene.org). As seen in the NCI panel of cell lines, we observed a correlation between NH and the combined inactivation of pRB and p53 in the NSCLC lines. Approximately 52% of cell lines with both pRB and p53 pathway lesions exhibited high NH, compared to only 21% of the lines with lesions in only one of these pathways (Figure 1; Fisher test: p=0.0455).
Figure 1. Combined p53 and pRB functional status is an indicator of CIN.

A) Interphase FISH analysis using probes specific for the centromeric regions of chromosomes 2, 6 and 8 of a panel of NSCLC lines revealed varying degrees of chromosome copy number heterogeneity (NH) within each population of cells. B) The percent of cells exhibiting a chromosome copy number for a given chromosome different from the mean copy number for that cell population is represented as the NH. Cell lines with the top third of NH are highlighted in red and considered High CIN, those in the middle third are highlighted yellow and considered Moderate CIN, those in the bottom third are highlighted in green and considered Low CIN/stable. C) Cell lines exhibiting lesions in the pRB pathway (RB1/CDKN2A mutations/deletions and/or CDK4/6 amplifications), together with TP53 mutations are correlated with high NH/CIN (p<0.05).
In summary, in two independent panels of tumor cells the level of CIN (as measured by the degree of numerical heterogeneity in the population of cells) correlated most strongly with the functional inactivation of both pRB and p53.
Retinoblastoma cell lines show evidence of chromosome segregation errors
To directly test whether the inactivation of pRB and p53 synergistically promotes CIN we took advantage of the fact that retinoblastoma cell lines characteristically carry loss of function mutations in RB1 but rarely mutate TP53. These cell lines provide an ideal experimental context to test whether p53 limits CIN following the loss of pRB.
Previously, we demonstrated that depletion of pRB from chromosomally stable, diploid cells induces high rates of chromosome mis-segregation and a marked increase in the heterogeneity of chromosome copy number (numerical heterogeneity) within the population for any given chromosome (39). This frequent, high rate of chromosome mis-segregation is consistent with that seen in chromosomally unstable cell lines (40). Recently, we confirmed that xenografts of retinoblastomas display similar mitotic defects (41). Surprisingly, however, these tumors were found exhibit a relatively stable genome. To better understand this apparent contradiction, we analyzed a series of retinoblastoma cell lines for mitotic defects. All of the retinoblastoma lines analyzed displayed evidence of mitotic defects that included decreased sister chromatid cohesion during mitosis and increased frequency of lagging chromosomes, compared to control cells (Figure 2A and (41)). Y79 and Weri cells exhibited lagging chromosomes in 31 +/−6% and 35 +/− 9% of all anaphase cells, respectively. However, interphase FISH analysis with probes specific for chromosomes 6, 8 and 16 showed only a moderate level of numerical heterogeneity within the population for several retinoblastoma cell lines (Figure 2B). While measures of NH are increased over that seen in non-transformed, genomically stable control cells, they are significantly lower than that commonly seen in CIN lines that display a similar frequency of lagging chromosomes during anaphase (42). Indeed, the level of NH measured in retinoblastoma lines is more consistent with that seen in control cells acutely depleted of pRB (Figure 2B).
Figure 2. Retinoblastoma cells are resistant to CIN.

A) Retinoblastoma cells exhibit evidence of chromosome segregation errors, including defective anaphases with lagging chromosomes (arrows) and chromatin bridges (data not shown). Y79 and Weri cells exhibited lagging chromosomes in 31 +/−6% and 35 +/− 9% of all anaphase cells, respectively B) Measures of NH were performed as described in Figure 1. Comparison of Numerical Heterogeneity (NH) between chromosomally stable (RPE and HCT116) cell lines, Retinoblastoma cell lines (Y79, Weri and RB355), a stable line depleted of pRB (siRB) and a well characterized CIN cell line (U2OS). C) Monastrol-washout (mon w/o) induced chromosome segregation errors initially increase NH in stable, CIN, and Retinoblastoma cell lines (one day following drug treatment: mon w/o D1). However, newly aneuploid cells are only maintained in the population of CIN cells and are quickly depleted from populations of Retinoblastoma cell lines (Day 3 and Day 6 following drug treatment: mon w/o D3 and D6).
Retinoblastoma cells are resistant to generation of aneuploidy
Normal diploid cells have a very strong response to changes in ploidy and this restricts the proliferation of aneuploid cells that arise spontaneously in a population. Because of this, the induction of segregation errors, even at very high rates, is insufficient to illicit a corresponding increase in aneuploidy variation within a population (20, 21). To determine how retinoblastoma cells respond to changes in aneuploidy, we induced a high rate of chromosome mis-segregation and assayed numerical heterogeneity within the population over time. To induce mis-segregation we used monastrol, a small molecule inhibitor of the mitotic motor Eg5, that compromises mitotic spindle structure and promotes improper kinetochore-microtubule attachments (43, 44). Upon drug washout, spindle structure is restored, but many chromosomes maintain merotelic kinetochore attachments which promote mis-segregation.
This monastrol treatment and washout scheme promotes segregation errors in otherwise diploid cells. The induction of segregation errors, and the appearance of aneuploid cells was monitored using interphase FISH. In control cells (RPE1) the numerical heterogeneity in the population (Figure 2C) increased initially following monastrol treatment but these newly generated aneuploid cells were rapidly depleted from the population. Chromosome segregation errors were also enhanced in U2OS and MCF7 cells, cell lines that display a high level of CIN. However, in contrast to the diploid non-CIN RPE1 cells, U2OS and MCF7 cells were tolerant of this increased aneuploidy and the subsequent increase in numerical heterogeneity was maintained for several days. This is consistent with published work showing differential responses of CIN and non-CIN cancer lines to generation of aneuploidy (40). As with both the CIN (U2OS, MCF7) and non-CIN (RPE1) controls, the monastrol drug/washout scheme increased chromosome segregation errors in retinoblastoma Y79 cells. Y79 cells resembled the non-CIN (RPE1) control cells in that the newly generated aneuploid cells were not proficient for continued proliferation and the level of aneuploidy rapidly fell back to the basal level for the population. Similar results were observed with an additional retinoblastoma cell line (WERI1) and indicate that retinoblastoma cells are relatively resistant to aneuploidy.
Such intolerance of changes in chromosome number has been shown by several groups to depend on p53, such that the presence of p53 limits the proliferative capability of aneuploid and polyploid cells (20, 21). Retinoblastomas retain wild type p53 but p53-dependent cell death has been proposed to be tempered by MDMX amplification in these tumors(34–36). It is not known if the response of the p53 pathway to all types of stimuli is compromised in retinoblastoma cells and we therefore asked whether the p53 pathway is functional in retinoblastoma cell lines and whether it limits the accumulation of aneuploid cells.
First, to determine whether the p53 pathway can be activated in retinoblastoma cells lines, we examined the response of these cells to doxorubucin induced DNA damage. Similarly to control diploid cells, p53 was stabilized in response to experimentally induced DNA damage in Retinoblastoma cell lines (Figure 3A). This stabilization of p53 was sufficient to induce expression of the p53 target p21 (Figure 3B) Interestingly, unlike diploid cells, retinoblastoma cell lines exhibit a low level of detectable p53 even when not treated with damaging agents. This suggests that the retinoblastoma cells may be experiencing consistent activation of a p53-dependent response (Figure 3A and C), an observation that would be consistent with persistent errors in chromosome segregation in the population of cells.
Figure 3. p53 limits CIN in Retinoblastoma cells.
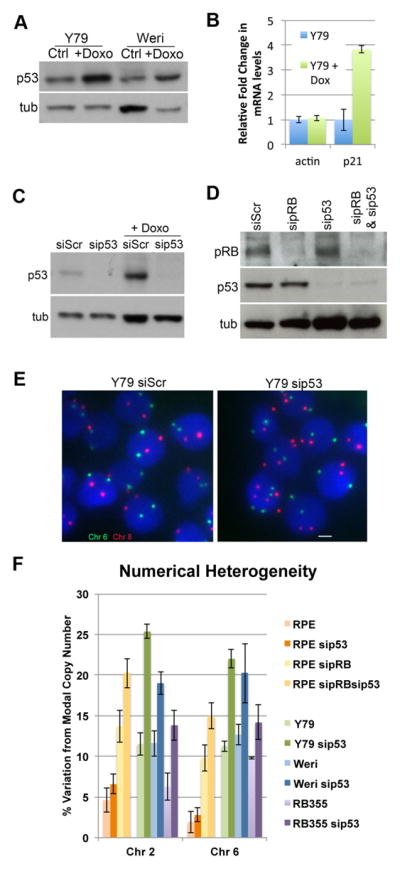
A) Retinoblastoma cells maintain wild-type p53, which is present at low levels and can be stabilized in response to DNA damage. B) Consistent with the stabilization of p53, following doxorubicin treatment expression of p21 mRNA is induced in Y79 cells. C) Y79 Retinoblastoma cells and D) hTERT-RPE cells were transfected with siRNA targeting pRB and/or p53 as indicated and treated with 100 ng/mL of the DNA damaging agent doxorubicin for 5 hours. Western blot analysis of cell extracts confirm efficient depletion the respective targets. E and F) FISH analysis with centromeric probes specific chromosome 6 (green) and 8 (red) was performed and changes in chromsome copy number (Numerical Heterogeneity: NH) were scored following depletion of p53 in retinoblastoma cells and RPE cells depleted of pRB. Depletion of p53 from these cells permits increased levels of NH/CIN.
Second, to test directly whether p53 limits aneuploidy in retinoblastoma cells, p53 was depleted from three retinoblastoma lines (Y79, Weril, RB355) and numerical heterogeneity was scored using FISH (Figure 3C, E, F). For comparison, we also we assayed the effects of p53 depletion on the diploid RPE-1 cell line, when co-depleted with pRB (Figure 3D & F). In each cell line, p53 depletion significantly increased the level of numerical heterogeneity over the level observed prior to depletion (retinoblastoma cells) or in cells depleted of pRB alone (RPE line) (Figure 3E; supplemental Figure 3). We conclude that p53 is capable of limiting numerical heterogeneity in retinoblastomas.
p53 limits increased aneuploidy following pRB loss
Among the potential interpretations of this data was the possibility that p53 status might increase the frequency or severity of mitotic defects resulting from the loss of pRB. To assess this and to determine whether functional synergy between pRB loss and p53 inactivation could be demonstrated using alternative experimental approaches in non-retinal cells, we measured the effects of p53 depletion on the mitotic defects that have previously been described in pRB-depleted cells. The depletion of pRB from genomically stable RPE-1 cells compromised sister chromatid cohesion and centromeric structure (Figure 4A–C), as previously shown (39). Neither of these defects were seen when p53 was depleted, and we observed no change in the appearance or severity of these defects when p53 was co-depleted with pRB. This indicates that the effects of p53 loss are either downstream of, or independent of, the effects of pRB loss on mitotic chromosome structure.
Figure 4. p53 loss does not contribute to chromosome segregation errors.

A) Mitotic chromosome spreads were labelled using FISH probes specific for individual loci on the two arms of chormosome 16 (16p13: green; 16q22: red). Measurements of the distance between replicated foci were performed as a readout of chromatin arm cohesion. B–D) Cells were fixed and stained for the kinetcohore marker ACA/CREST (Kinet: red), tubulin (green), and DAPI(blue). B & C) Measures of the distance between sister kinetochores in metaphase cells were performed as a readout of centromeric cohesion. C) Anaphase cells were scored for the presence of lagging chormosomes (indicated by white arrow heads). E) Measures of Numerical Heterogenetity were performed as described in Figure 1. A–C) Depletion of pRB from chromosomally stable hTERT-RPE-1 cells induces mitotic defects, including decreased sister-chromosome arm cohesion (A), increased sister kinetochore distance (B) and defective anaphases (C). Depletion of p53 alone does not induce similar defects and co-depletion of pRB and p53 does not enhance defects seen following depletion of pRB alone. D & E) Similarly, isogenically matched p53 +/+ and p53 −/− HCT116 cells do not show evidence of mitotic defects or high NH. While depletion of pRB results in increased interkinetochore distances in both lines, a striking increase in NH/CIN is seen only in the p53 null line. *: p< 0.05; **: p<0.001; ***: p<0.0001.
Next, we examined a matched pair of HCT116 cells lines that either retain p53 (p53+/+), or from which the endogenous p53 gene has been removed by gene targeting (p53−/−) (45). Depletion of pRB altered kinetochore structure to a similar degree in p53+/+ and p53−/− cells, as expected (Figure 4D). Consistent with work showing that loss of p53 alone is not sufficient for the generation of aneuploidy (46), interphase FISH experiments demonstrated that p53+/+ and p53−/− HCT116 cells exhibit a similar, low level of numerical heterogeneity (Figure 4E). The depletion of pRB from p53−/− cells gave a dramatic increase in numerical heterogeneity. In contrast, depletion of pRB from p53+/+ cells gave only a moderate increase in chromosome copy number changes. Collectively, these data support a model in which the loss of pRB causes changes in mitotic structures that promote chromosome mis-segregation, while p53 limits pRB-induced CIN by preventing the accumulation of aneuploid and polyploid cells.
Discussion
Dual loss of pRB and p53 function promotes tumorigenesis in many tumor model systems (34, 36, 47–49). p53 and pRB both regulate transcriptional programs that allow important cell fate decisions, and mutations in the pRb and p53 pathways have been shown to cooperate in a number of cellular processes. For example, both pRb and p53 contribute to cellular proliferation, including the regulation of cell cycle arrest, senescence, and cell death in response to a myriad of cellular assaults (50–55). In addition, a consequence of pRB loss of function and E2F misregulation is the stabilization and activation of p53, such that, although the pRB pathway has been corrupted, cell cycle arrest and apoptotic programming can be initiated in a p53-dependent manner (56, 57). This is thought to be a major reason why both pRB and p53 pathways are commonly found mutated together in cancer. Here we describe an additional level of cooperation between pRB and p53. We show that these tumor suppressors collaborate to promote genome stability and that the combined inhibition of both pathways promotes CIN. Data presented her, along with work from others (20–22, 29, 30, 58, 59) suggests that this cooperation is likely due to a role for pRB loss in corrupting mitotic fidelity, and a separate role for p53 loss in allowing tolerance and proliferation of aneuploid cells. This interpretation is consistent with data presented here and by others showing that loss of p53 alone is not sufficient to induce segregation defects (20–22). This relationship between pRB and p53 in generating CIN is not unique, and instead, this model is consistent with numerous lines of evidence that show loss of p53 allows for the generation of CIN when chromosome segregation is induced by various mechanisms (reviewed in (24, 60)). This cooperativity provides a simple explanation for several mysterious oberservations: it explains why mutation of p53 alone is not a good predictor of CIN, why loss of pRB in Retinoblastoma is associated with a genomically stable karyotype, and finally, as described below, this also provides an explanation as to why the described CIN expression signature contains many RB-regulated gene products.
A unique gene expression signature has been derived for CIN cell lines(61), however, it has been noted that many of the genes contained in this expression signature are E2F targets whose expression is deregulated following pRB loss. This may be interpreted as evidence that RB1 loss is fundamental to the generation of CIN, or given that many of these are cell cycle genes, simply that CIN cells are also highly proliferative. Indeed, comparison of CIN gene expression signature with that derived for pRB loss (62) shows that >40% of the CIN signature genes are shared with the RB loss expression signature, with five of the top 10 most highly mis-expressed CIN signature genes also present in the RB-loss signature. Consistent with this significant overlap, independent analyses have shown that both the RB-loss expression signature, as well as the CIN expression signature are similarly predictive of outcome in various cancers (38, 62). Here we have shown that numerical heterogeneity, an independent read-out of CIN, similarly correlates with pRB loss of function, suggesting that the overlap in expression signatures is more than just a cooincindence of proliferative capacity and is instead an indication of a close relationship between pRB loss of function and CIN.
In our sample set, over 70% (10/14) of the NSCLC lines with high NH have obvious genomic lesions in both p53 and the pRB pathways. A potential caveat is that pRB may be functionally inactivated by changes that act upstream of the classical components. Hence, by considering only the cell lines that have mutation of RB1, CDKN2A or copy gains in CCND1 or CDK4/6, we might overlook cell lines that have compromised pRB function. Consistent with this possibility, three of the cell lines in this study, including two of the four lines with a high degree of numerical heterogeneity, but without obvious changes in core components of the pRB pathway machinery, have mutations in the SMARCA4/BRG1 locus, the protein product of which has been shown to impact pRB function (63). Similarly, it is likely that many different binding partners impinge on RB’s regulation of chromosome stability. In the absence of a functional readout of pRB activity and given that it is currently unclear which other gene mutations may temper pRB function, it remains to be seen how pRB activity is regulated with regards to it’s role in genome stability.
Recent work has demonstrated that tumors with high levels of CIN are more likely to relapse following seemingly effective chemotherapeutics (3, 7–13) suggesting that increased levels of CIN promotes tumor evolution. Two major limitations to applying our knowledge of the functional implications of CIN in tumors to patient treatment lie in the ability to identify which tumors exhibit CIN, and the ability to manipulate CIN in a therapeutically relevant manner. Limitations in characterizing CIN in patient samples stem from the fact that chromosome instability is not a static state, and instead represents a rate of segregation errors. As such, many tools used in tissue culture to analyze such changes that occur over time are not amenable to fixed patient samples. Indeed, methods for scoring CIN in tumor samples are limited to techniques that include analysis of structural and numerical heterogeneity by karyotype analysis and the presence of the CIN gene expression signature. However, gene expression data is not readily available for all patient samples and not all samples are amenable to cytogenetic analysis. Data presented here show that combined pRB and p53 mutational status is predictive of high CIN and may therefore serve as useful criteria in identifying tumors likely to be resistant to traditional treatments.
Given that loss of pRB function is widespread in cancer, changes in chromatid cohesion that corrupt mitotic fidelity following pRB loss are likely to be a major contributing factor to CIN in cancer. However, numerous other mitotic defects have similarly been described to compromise genome integrity (revirewed in (24, 60). It remains to be seen to what degree changes that result from pRB loss contribute to or cooperate with other mitotic defects in the genesis and degree of CIN seen in various cancer contexts. In addition to contexts where pRB loss may cooperate with other defects that promote CIN, it is likley that contexts similarly exist where pRB’s contribution to CIN may be minimized. We have demonstrated that one such context is when p53 functions to limit the proliferation of cells that experience segregation errors as a result of pRB loss. While it is clear that increased genetic diversity that results from CIN may benefit tumor survival, on a cellular level, the presence of aneuploidy has been shown to impose metabolic challenges and be detrimental to cell proliferation (60). As such, in cancer contexts where loss of RB1 is an initiating event, as it is in retinoblastoma, it may be necessary to limit CIN such that the benefit of RB1 loss in tumor initiation is not outweighed by the limits to proliferation imposed by aneuploidy.
Increased CIN has been shown to promote drug resistance and tumor relapse. In addition, while moderate levels of CIN correlate with poor patient response, both low levels of CIN, and surprisingly, high levels of CIN have been shown to correlate with improved patient outcome, suggesting that manipulation of CIN will be of therapeutic value. Enhancing CIN may promote mitotic catastrophe and sensitize cells to death. However, in the ansence of a mechanism to specifically target cancer cells, increased CIN may have detrimental and even cancer promoting effects in normal, proliferating cells. An alternative approach would be to promote genome stability by suppressing CIN, thereby relieving cancer cells of a major adaptive mechanism and rendering them more sensitive to therapeutic treatments. To address the feasability of this approach, we have examined the effects of re-introducing pRB into human or mouse osteosarcoma cells that are deficient for both pRB and p53. In these experiments, we observed that the re-expression of pRB was sufficient to suppress mitotic defects, even in the absence of p53 (Supplemental Figure 4A, B). This suggests changes that contribute to CIN in RB-deficeint cells can be suppressed. However, to fully understand the functional relevance of pRB’s role in regulating genome stability, and to identify novel therapeutic targets, it will be necessary to separate pRB’s multifaceted roles in regulating cellular proliferation from those that regulate mititic chromosome segregation. Together, these experiments raise the tantalizing prospect that drugable targets may be identified to specifically and efficiently stabilize the genome of CIN cancer cells, thereby rendering them more sensitive to traditional therapeutics. This is an important avenue for future exploration and will likely elucidate not only the functional relevance of pRB’s contribution to CIN, but also the therapeutic value of manipulating CIN in tumors.
Materials and Methods
Cell Culture and RNAi
Cells were grown in Dulbecco’s Modified Essential Medium (hTERT-RPE-1, mouse DKO osteosarcoma lines, a kind gift from Jackie Lees), RPMI-1640 (Weril, Y79 and RB355, a generous gift from Michael Dyer) or McCoy’s (HCT116) supplemented with 10% fetal bovine serum (FBS) and 1% penicillin/streptomycin and maintained at 37C with 5% CO2.
For experiments in which the short-term depletion of targets was achieved using siRNAs, cells were transfected with RNAi MAX (Invitrogen, Grand Island, NY) according to the manufacturer’s directions, with 50 nM pool of four non-targeting siRNA contructs (ON-TARGETplus Non-targeting Pool), four pRB-specific siRNA constructs (CGAAAUCAGUGUCCAUAAA; GAGUUGACCUAGAUGAGAU; AAACUACGCUUUGAUAUUG; and GAAUCUGCUUGUCCUCUUA), or four p53-specific siRNA constructs (GGAGAAUAUUUCACCCUUC; GCAGUCAUCCUAGCGUC; GUGCAGCUGUGGGUUGAUU; and GAAAUUUGCGUGUGGAGUA), (Dharmacon, Chicago, IL) as indicated. Protein knockdown and p53 induction was confirmed by western blot analysis of protein extracts using antibodies specific for pRB (4H1: Cell Signaling), p53 (DO-1: Santa Cruz), with alpha-tubulin (dm1α: Sigma) as a loading control. To assess p21 mRNA expression following p53 induction, RNA extraction was performed using Qiagen’s RNeasy kit, and qRT PCR with Roche’s FastStart SYBR green Universal Master mix according to the respective manufacturer’s instruction. Primers used for amplification of actin and p21 were 5′-ACACCTTCTACAATGAGC-3′ & ACGTCACACTTCATGATG-3′ and 5′-GCAGACCAGCATGACAGATTT-3′ & 5′-GGATTAGGGCTTCCTCTTGGA-3′ respectively.
FISH, drug treatment, and Immunofluorescence
Cells were prepared and fixed, and α-satellite-specific probes for chromosomes 2, 6 and 8 or probes specific to the p and q arms of chromosome 16 (see Figure 4) (Cytocell) were hybridized as described previously (39). Numerical Heterogeneity (NH) was determined by scoring 100–500 cells per population for copy number of each of 2 to four individual chromosome probes for each of three independent experiments. The percent that a particular probe varied from the modal copy number of that probe in that sample was calculated. To minimize the risk of incorrectly characterizing stable subclones as random heterogeneity, variations greater than 20% for any particular copy number were not scored as part of the numerical heterogeneity used as a readout of CIN. Chromosome segregation events were induced via addition of 100uM monastrol (Sigma, Saint Louis, MI) for 16 hours. Cells were then collected, washed thrice with PBS, and re-plated for1, 3 or 6 days as indicated prior to preparation for FISH and analysis of numerical heterogeneity. DNA damage was induced in hTERT-RPE-1 and Retinoblastoma lines by the addition of 100ng/mL of Doxorubicin (Sigma, Saint Louis, MI) for 5 hour, at which point whole cell lysates were collected for analysis of p53 levels. For analysis of mitotic sister chromosome arm cohesion, human or mouse tissue culture cells were treated with 100 ng/mL nocodazole for 30min prior to swelling in hypotonic buffer. To ensure similar mitotic timing of all spreads analyzed, samples were prepared in paralell, hypotonic treatments preceding fixation were brief (10 min), and no prior mitotic enrichment/arrest was additionally performed. For analysis of human cells, cells were prepared for FISH analysis as described above and slidebook software was used to measure interchromosomal distances, defined as the distance between the centers of replicated FISH foci. Measurements of inter-kinetochore distances were done as previously described (39) on methanol fixed mitotic cells. 50–100 measurements were made for each sample in each replicate. All measurements were performed for three independent experiments. All error bars represent standard errors (SEM).
Whole cell lysates and/or fixed cell samples were collected at 24, 36 and/or 48 hours post transfection unless otherwise indicated. For immunofluorescence cells were cultured and transfected on glass coverlsips, washed briefly with PBS and fixed for 10 min in ice-cold methanol without additional pre-extraction. Subsequent antibody incubations and washes were done in TBS-BSA (10 mM Tris at pH 7.5, 150 mM NaCl, 1% bovine serum albumin). DNA was detected with 0.2 μg/mL DAPI (Sigma-Aldrich). Coverslips were mounted with ProLong Antifade mounting medium (Molecular Probes). Fluorescent images of fixed and live cells were captured with a Hamamatsu Orca AG cooled CCD camera mounted on a Nikon TI/Yokagawa CSU-10 spinning-disk confocal microscope with a 100×, 1.4 NA objective or a Hamamatsu EM CCD camera mounted on an Olympus IX81 microscope with a 100×, 1.4 NA objective. A series of 0.25-μm optical sections were collected in the Z-axis for each channel (DAPI, fluorescein, Cy5, and/or Texas red). Selected planes from the Z-series were then overlaid to generate the final image. Antibodies used include: tubulin/dm1a (Sigma, Saint Louis, MI), Ndc80 (Novus Biologicals, Littleton CO), p53/DO-1 (Santa Cruz Biotechnology, Santa Cruz, CA) and ACA (Antibodies Incorporated, Davis CA). The Student’s t-test or Fisher exact test was used to calculate the significance of differences between samples as indicated.
Supplementary Material
Previously described measures of numerical heterogeneity (NH) for the NCI-60 panel of cell lines (25) are used as an indication of whole chromosome instability, where the third of cells in this panel exhibiting high NH/CIN are highlighted in red and given a score of 3, those in the middle third are highlighted in yellow and given a NH score of 2, and the third with low heterogeneity are highlighted in green and given a NH score of 1. Analysis of TP53 mutational status shows no correlation with degree of NH/CIN (p>0.5), nor does mutational status of RB1 and/or it’s regulator CDKN2A/p16 (p>0.1). Mutation/loss of function of both pRB and p53 together significantly correlates with high NH/CIN in this panel of cell lines (p<0.05)
A) Numerical Heterogeneity scores for probes specific for chromosomes 6 and 8 show similar distributions of copy number heterogeneity within each cell line, indicating that the average variation used as a readout of CIN is not due to stable subclonal populations. B) Although polyploidy has been suggested to promote CIN, ploidy levels vary within this panel of cell lines and across groups of cells with High, Mid, and Low NH, suggesting that measures of NH are not simply an indirect readout of aneuploidy.
Measures of numerical heterogeneity within a population are similar for various chromosomes, indicating these measures represent an increase in random mis-segregation events, not selection of specific, stable subclones. Distributions of copy number for each chromosome are shown for Y79 cells (blue) and Y79 cells depleted of p53 (red). Overall Numerical Heterogeneity of each chromosome in each population is represented as the percent of cells exhibiting a copy number for a given chromosome other than the modal copy number (mode is 3 for chromosome 2, and 2 for chromosomes 6 and 8). The fold change in NH for each chromosome is represented as the NH in p53-depleted cells normalized to the NH in control cells.
A &B) Measures of the distance between sister kinetochores in metaphase cells were performed as a readout of centromeric cohesion (Kinetochore: Hec1 in green; Centromere: ACA in red). Re-expression of pRB via a tet-inducible promoter is sufficient to suppress defects in interkinetochore distances in U2OS cells normally lacking pRB activity C) Mitotic chromosome spreads were prepared following a 30 min nocodazole treatment to induce microtubule depolymerization. Chromatin was stained with DAPI and sisters were assessed for chromosome arm cohesion. Consistent with results in SAOS cells, re-expression of pRB in p53 KO mouse osteosarcoma cells suppresses sister chromatid cohesion defects.
Acknowledgments
The authors would like to thank the Lees, Dyer and Pellman labs for sharing cell lines, and Neil Ganem for critical reading of the manuscript. This work was supported by a American Cancer Society Fellowship (A.L.M.) and funding from NIH grant R01 CA155202 (to N.J.D). N.J.D. is the James and Shirley Curvey MGH Research Scholar.
Footnotes
Conflict of Interest
The authors declare that they have no competing financial interests in relation to the work herein described.
References
- 1.Hanahan D, Weinberg RA. Hallmarks of cancer: the next generation. Cell. 2011 Mar 4;144(5):646–74. doi: 10.1016/j.cell.2011.02.013. Research Support, N.I.H., Extramural Review. [DOI] [PubMed] [Google Scholar]
- 2.Lengauer C, Kinzler KW, Vogelstein B. Genetic instability in colorectal cancers. Nature. 1997 Apr 10;386(6625):623–7. doi: 10.1038/386623a0. [DOI] [PubMed] [Google Scholar]
- 3.Rajagopalan H, Lengauer C. Aneuploidy and cancer. Nature. 2004 Nov 18;432(7015):338–41. doi: 10.1038/nature03099. [DOI] [PubMed] [Google Scholar]
- 4.Albertson DG, Collins C, McCormick F, Gray JW. Chromosome aberrations in solid tumors. Nat Genet. 2003 Aug;34(4):369–76. doi: 10.1038/ng1215. [DOI] [PubMed] [Google Scholar]
- 5.Beroukhim R, Mermel CH, Porter D, Wei G, Raychaudhuri S, Donovan J, et al. The landscape of somatic copy-number alteration across human cancers. Nature. 2000 Feb 18;463(7283):899–905. doi: 10.1038/nature08822. [DOI] [PMC free article] [PubMed] [Google Scholar]
- 6.Hanahan D, Weinberg RA. The hallmarks of cancer. Cell. 2000 Jan 7;100(1):57–70. doi: 10.1016/s0092-8674(00)81683-9. [DOI] [PubMed] [Google Scholar]
- 7.Choi CM, Seo KW, Jang SJ, Oh YM, Shim TS, Kim WS, et al. Chromosomal instability is a risk factor for poor prognosis of adenocarcinoma of the lung: Fluorescence in situ hybridization analysis of paraffin-embedded tissue from Korean patients. Lung Cancer. 2009 Apr;64(1):66–70. doi: 10.1016/j.lungcan.2008.07.016. [DOI] [PubMed] [Google Scholar]
- 8.Gao C, Furge K, Koeman J, Dykema K, Su Y, Cutler ML, et al. Chromosome instability, chromosome transcriptome, and clonal evolution of tumor cell populations. Proc Natl Acad Sci U S A. 2007 May 22;104(21):8995–9000. doi: 10.1073/pnas.0700631104. [DOI] [PMC free article] [PubMed] [Google Scholar]
- 9.Heilig CE, Loffler H, Mahlknecht U, Janssen JW, Ho AD, Jauch A, et al. Chromosomal instability correlates with poor outcome in patients with myelodysplastic syndromes irrespectively of the cytogenetic risk group. J Cell Mol Med. 2010 Apr;14(4):895–902. doi: 10.1111/j.1582-4934.2009.00905.x. [DOI] [PMC free article] [PubMed] [Google Scholar]
- 10.Kuukasjarvi T, Karhu R, Tanner M, Kahkonen M, Schaffer A, Nupponen N, et al. Genetic heterogeneity and clonal evolution underlying development of asynchronous metastasis in human breast cancer. Cancer Res. 1997 Apr 15;57(8):1597–604. [PubMed] [Google Scholar]
- 11.McClelland SE, Burrell RA, Swanton C. Chromosomal instability: a composite phenotype that influences sensitivity to chemotherapy. Cell Cycle. 2009 Oct 15;8(20):3262–6. doi: 10.4161/cc.8.20.9690. [DOI] [PubMed] [Google Scholar]
- 12.Nowell PC. The clonal evolution of tumor cell populations. Science. 1976 Oct 1;194(4260):23–8. doi: 10.1126/science.959840. [DOI] [PubMed] [Google Scholar]
- 13.Swanton C, Nicke B, Schuett M, Eklund AC, Ng C, Li Q, et al. Chromosomal instability determines taxane response. Proc Natl Acad Sci U S A. 2009 May 26;106(21):8671–6. doi: 10.1073/pnas.0811835106. [DOI] [PMC free article] [PubMed] [Google Scholar]
- 14.Kim MS, Kim SS, Je EM, Yoo NJ, Lee SH. Mutational and expressional analyses of STAG2 gene in solid cancers. Neoplasma. 2012;59(5):524–9. doi: 10.4149/neo_2012_067. [DOI] [PubMed] [Google Scholar]
- 15.Chung NG, Kim MS, Yoo NJ, Lee SH. Somatic mutation of STAG2, an aneuploidy-related gene, is rare in acute leukemias. Leuk Lymphoma. 2012 Jun;53(6):1234–5. doi: 10.3109/10428194.2011.645819. Letter. [DOI] [PubMed] [Google Scholar]
- 16.Cahill DP, Lengauer C, Yu J, Riggins GJ, Willson JK, Markowitz SD, et al. Mutations of mitotic checkpoint genes in human cancers. Nature. 1998 Mar 19;392(6673):300–3. doi: 10.1038/32688. Research Support, Non-U.S. Gov’t Research Support, U.S. Gov’t, P.H.S. [DOI] [PubMed] [Google Scholar]
- 17.Cahill DP, da Costa LT, Carson-Walter EB, Kinzler KW, Vogelstein B, Lengauer C. Characterization of MAD2B and other mitotic spindle checkpoint genes. Genomics. 1999 Jun 1;58(2):181–7. doi: 10.1006/geno.1999.5831. Research Support, Non-U.S. Gov’t Research Support, U.S. Gov’t, P.H.S. [DOI] [PubMed] [Google Scholar]
- 18.Wang Z, Cummins JM, Shen D, Cahill DP, Jallepalli PV, Wang TL, et al. Three classes of genes mutated in colorectal cancers with chromosomal instability. Cancer research. 2004 May 1;64(9):2998–3001. doi: 10.1158/0008-5472.can-04-0587. Research Support, Non-U.S. Gov’t Research Support, U.S. Gov’t, P.H.S. [DOI] [PubMed] [Google Scholar]
- 19.Negrini S, Gorgoulis VG, Halazonetis TD. Genomic instability--an evolving hallmark of cancer. Nat Rev Mol Cell Biol. 2010 Mar;11(3):220–8. doi: 10.1038/nrm2858. Research Support, N.I.H., Extramural Research Support, Non-U.S. Gov’t Review. [DOI] [PubMed] [Google Scholar]
- 20.Thompson SL, Compton DA. Proliferation of aneuploid human cells is limited by a p53-dependent mechanism. J Cell Biol. 2010 Feb 8;188(3):369–81. doi: 10.1083/jcb.200905057. [DOI] [PMC free article] [PubMed] [Google Scholar]
- 21.Janssen A, van der Burg M, Szuhai K, Kops GJ, Medema RH. Chromosome segregation errors as a cause of DNA damage and structural chromosome aberrations. Science. 2011 Sep 30;333(6051):1895–8. doi: 10.1126/science.1210214. Research Support, Non-U.S. Gov’t. [DOI] [PubMed] [Google Scholar]
- 22.Li M, Fang X, Baker DJ, Guo L, Gao X, Wei Z, et al. The ATM-p53 pathway suppresses aneuploidy-induced tumorigenesis. Proceedings of the National Academy of Sciences of the United States of America. 2010 Aug 10;107(32):14188–93. doi: 10.1073/pnas.1005960107. Research Support, N.I.H., Extramural. [DOI] [PMC free article] [PubMed] [Google Scholar]
- 23.Hollstein M, Sidransky D, Vogelstein B, Harris CC. p53 mutations in human cancers. Science. 1991 Jul 5;253(5015):49–53. doi: 10.1126/science.1905840. Comparative Study Research Support, U.S. Gov’t, P.H.S. Review. [DOI] [PubMed] [Google Scholar]
- 24.Holland AJ, Cleveland DW. Losing balance: the origin and impact of aneuploidy in cancer. EMBO Rep. 2012 Jun;13(6):501–14. doi: 10.1038/embor.2012.55. Research Support, N.I.H., Extramural Research Support, Non-U.S. Gov’t Review. [DOI] [PMC free article] [PubMed] [Google Scholar]
- 25.Roschke AV, Tonon G, Gehlhaus KS, McTyre N, Bussey KJ, Lababidi S, et al. Karyotypic complexity of the NCI-60 drug-screening panel. Cancer research. 2003 Dec 15;63(24):8634–47. [PubMed] [Google Scholar]
- 26.Knudson AG., Jr Genetic predisposition to cancer. Cancer Detect Prev. 1984;7(1):1–8. [PubMed] [Google Scholar]
- 27.Corson TW, Gallie BL. One hit, two hits, three hits, more? Genomic changes in the development of retinoblastoma. Genes Chromosomes Cancer. 2007 Jul;46(7):617–34. doi: 10.1002/gcc.20457. [DOI] [PubMed] [Google Scholar]
- 28.Dimaras H, Khetan V, Halliday W, Orlic M, Prigoda NL, Piovesan B, et al. Loss of RB1 induces non-proliferative retinoma: increasing genomic instability correlates with progression to retinoblastoma. Hum Mol Genet. 2008 May 15;17(10):1363–72. doi: 10.1093/hmg/ddn024. [DOI] [PubMed] [Google Scholar]
- 29.Manning AL, Dyson NJ. pRB, a tumor suppressor with a stabilizing presence. Trends Cell Biol. 2011 Aug;21(8):433–41. doi: 10.1016/j.tcb.2011.05.003. [DOI] [PMC free article] [PubMed] [Google Scholar]
- 30.Manning AL, Dyson NJ. RB: mitotic implications of a tumour suppressor. Nature reviews Cancer. 2012 Mar;12(3):220–6. doi: 10.1038/nrc3216. Research Support, N.I.H., Extramural Research Support, Non-U.S. Gov’t Review. [DOI] [PMC free article] [PubMed] [Google Scholar]
- 31.Manning AL, Dyson NJ. pRB, a tumor suppressor with a stabilizing presence. Trends in cell biology. 2011 Aug;21(8):433–41. doi: 10.1016/j.tcb.2011.05.003. Research Support, N.I.H., Extramural Research Support, Non-U.S. Gov’t Review. [DOI] [PMC free article] [PubMed] [Google Scholar]
- 32.Coschi CH, Dick FA. Chromosome instability and deregulated proliferation: an unavoidable duo. Cell Mol Life Sci. 2012 Jun;69(12):2009–24. doi: 10.1007/s00018-011-0910-4. Research Support, Non-U.S. Gov’t Review. [DOI] [PMC free article] [PubMed] [Google Scholar]
- 33.Zhang J, Beneavente CA, Justina M, FLores-Otero J, LDXC, et al. A Novel Retinoblastoma Therapy from Genomic and Epigenitic Analyses. Nature. 2012 doi: 10.1038/nature10733. in press. [DOI] [PMC free article] [PubMed] [Google Scholar]
- 34.Laurie NA, Donovan SL, Shih CS, Zhang J, Mills N, Fuller C, et al. Inactivation of the p53 pathway in retinoblastoma. Nature. 2006 Nov 2;444(7115):61–6. doi: 10.1038/nature05194. Research Support, N.I.H., Extramural Research Support, Non-U.S. Gov’t. [DOI] [PubMed] [Google Scholar]
- 35.Xu XL, Fang Y, Lee TC, Forrest D, Gregory-Evans C, Almeida D, et al. Retinoblastoma has properties of a cone precursor tumor and depends upon cone-specific MDM2 signaling. Cell. 2009 Jun 12;137(6):1018–31. doi: 10.1016/j.cell.2009.03.051. Research Support, Non-U.S. Gov’t. [DOI] [PMC free article] [PubMed] [Google Scholar]
- 36.Conkrite K, Sundby M, Mu D, Mukai S, MacPherson D. Cooperation between Rb and Arf in suppressing mouse retinoblastoma. J Clin Invest. 2012 May 1;122(5):1726–33. doi: 10.1172/JCI61403. Research Support, N.I.H., Extramural Research Support, Non-U.S. Gov’t. [DOI] [PMC free article] [PubMed] [Google Scholar]
- 37.Chin K, de Solorzano CO, Knowles D, Jones A, Chou W, Rodriguez EG, et al. In situ analyses of genome instability in breast cancer. Nature genetics. 2004 Sep;36(9):984–8. doi: 10.1038/ng1409. Research Support, Non-U.S. Gov’t Research Support, U.S. Gov’t, Non-P.H.S. Research Support, U.S. Gov’t, P.H.S. [DOI] [PubMed] [Google Scholar]
- 38.Roylance R, Endesfelder D, Gorman P, Burrell RA, Sander J, Tomlinson I, et al. Relationship of extreme chromosomal instability with long-term survival in a retrospective analysis of primary breast cancer. Cancer Epidemiol Biomarkers Prev. 2011 Oct;20(10):2183–94. doi: 10.1158/1055-9965.EPI-11-0343. Research Support, N.I.H., Extramural Research Support, Non-U.S. Gov’t. [DOI] [PMC free article] [PubMed] [Google Scholar]
- 39.Manning AL, Longworth MS, Dyson NJ. Loss of pRB causes centromere dysfunction and chromosomal instability. Genes & development. 2010 Jul 1;24(13):1364–76. doi: 10.1101/gad.1917310. Research Support, N.I.H., Extramural Research Support, Non-U.S. Gov’t. [DOI] [PMC free article] [PubMed] [Google Scholar]
- 40.Thompson SL, Compton DA. Examining the link between chromosomal instability and aneuploidy in human cells. J Cell Biol. 2008 Feb 25;180(4):665–72. doi: 10.1083/jcb.200712029. [DOI] [PMC free article] [PubMed] [Google Scholar]
- 41.Zhang J, Benavente CA, McEvoy J, Flores-Otero J, Ding L, Chen X, et al. A novel retinoblastoma therapy from genomic and epigenetic analyses. Nature. 2012 Jan 19;481(7381):329–34. doi: 10.1038/nature10733. Research Support, N.I.H., Extramural Research Support, Non-U.S. Gov’t. [DOI] [PMC free article] [PubMed] [Google Scholar]
- 42.Manning AL, Bakhoum SF, Maffini S, Correia-Melo C, Maiato H, Compton DA. CLASP1, astrin and Kif2b form a molecular switch that regulates kinetochore-microtubule dynamics to promote mitotic progression and fidelity. The EMBO journal. 2010 Oct 20;29(20):3531–43. doi: 10.1038/emboj.2010.230. Research Support, N.I.H., Extramural Research Support, Non-U.S. Gov’t. [DOI] [PMC free article] [PubMed] [Google Scholar]
- 43.Cimini D, Howell B, Maddox P, Khodjakov A, Degrassi F, Salmon ED. Merotelic kinetochore orientation is a major mechanism of aneuploidy in mitotic mammalian tissue cells. J Cell Biol. 2001 Apr 30;153(3):517–27. doi: 10.1083/jcb.153.3.517. [DOI] [PMC free article] [PubMed] [Google Scholar]
- 44.Knowlton AL, Lan W, Stukenberg PT. Aurora B is enriched at merotelic attachment sites, where it regulates MCAK. Current biology : CB. 2006 Sep 5;16(17):1705–10. doi: 10.1016/j.cub.2006.07.057. Research Support, N.I.H., Extramural Research Support, Non-U.S. Gov’t. [DOI] [PubMed] [Google Scholar]
- 45.Bunz F, Dutriaux A, Lengauer C, Waldman T, Zhou S, Brown JP, et al. Requirement for p53 and p21 to sustain G2 arrest after DNA damage. Science. 1998 Nov 20;282(5393):1497–501. doi: 10.1126/science.282.5393.1497. Research Support, U.S. Gov’t, P.H.S. [DOI] [PubMed] [Google Scholar]
- 46.Bunz F, Fauth C, Speicher MR, Dutriaux A, Sedivy JM, Kinzler KW, et al. Targeted inactivation of p53 in human cells does not result in aneuploidy. Cancer research. 2002 Feb 15;62(4):1129–33. Research Support, Non-U.S. Gov’t Research Support, U.S. Gov’t, P.H.S. [PubMed] [Google Scholar]
- 47.Holland EC, Hively WP, Gallo V, Varmus HE. Modeling mutations in the G1 arrest pathway in human gliomas: overexpression of CDK4 but not loss of INK4a-ARF induces hyperploidy in cultured mouse astrocytes. Genes & development. 1998 Dec 1;12(23):3644–9. doi: 10.1101/gad.12.23.3644. Research Support, Non-U.S. Gov’t. [DOI] [PMC free article] [PubMed] [Google Scholar]
- 48.Randle DH, Zindy F, Sherr CJ, Roussel MF. Differential effects of p19(Arf) and p16(Ink4a) loss on senescence of murine bone marrow-derived preB cells and macrophages. Proceedings of the National Academy of Sciences of the United States of America. 2001 Aug 14;98(17):9654–9. doi: 10.1073/pnas.171217498. Research Support, Non-U.S. Gov’t Research Support, U.S. Gov’t, P.H.S. [DOI] [PMC free article] [PubMed] [Google Scholar]
- 49.Burkhart DL, Sage J. Cellular mechanisms of tumour suppression by the retinoblastoma gene. Nature reviews Cancer. 2008 Sep;8(9):671–82. doi: 10.1038/nrc2399. Review. [DOI] [PMC free article] [PubMed] [Google Scholar]
- 50.Gordon GM, Du W. Conserved RB functions in development and tumor suppression. Protein Cell. 2011 Nov;2(11):864–78. doi: 10.1007/s13238-011-1117-z. Research Support, N.I.H., Extramural Research Support, U.S. Gov’t, Non-P.H.S. Review. [DOI] [PMC free article] [PubMed] [Google Scholar]
- 51.Herrera RE, Sah VP, Williams BO, Makela TP, Weinberg RA, Jacks T. Altered cell cycle kinetics, gene expression, and G1 restriction point regulation in Rb-deficient fibroblasts. Molecular and cellular biology. 1996 May;16(5):2402–7. doi: 10.1128/mcb.16.5.2402. Comparative Study Research Support, Non-U.S. Gov’t Research Support, U.S. Gov’t, P.H.S. [DOI] [PMC free article] [PubMed] [Google Scholar]
- 52.Di Leonardo A, Khan SH, Linke SP, Greco V, Seidita G, Wahl GM. DNA rereplication in the presence of mitotic spindle inhibitors in human and mouse fibroblasts lacking either p53 or pRb function. Cancer research. 1997 Mar 15;57(6):1013–9. Research Support, Non-U.S. Gov’t. [PubMed] [Google Scholar]
- 53.Khan SH, Wahl GM. p53 and pRb prevent rereplication in response to microtubule inhibitors by mediating a reversible G1 arrest. Cancer research. 1998 Feb 1;58(3):396–401. [PubMed] [Google Scholar]
- 54.Fuster JJ, Sanz-Gonzalez SM, Moll UM, Andres V. Classic and novel roles of p53: prospects for anticancer therapy. Trends Mol Med. 2007 May;13(5):192–9. doi: 10.1016/j.molmed.2007.03.002. Research Support, N.I.H., Extramural Research Support, Non-U.S. Gov’t Review. [DOI] [PubMed] [Google Scholar]
- 55.van den Heuvel S, Dyson NJ. Conserved functions of the pRB and E2F families. Nat Rev Mol Cell Biol. 2008 Sep;9(9):713–24. doi: 10.1038/nrm2469. Research Support, N.I.H., Extramural Review. [DOI] [PubMed] [Google Scholar]
- 56.Wu X, Levine AJ. p53 and E2F-1 cooperate to mediate apoptosis. Proceedings of the National Academy of Sciences of the United States of America. 1994 Apr 26;91(9):3602–6. doi: 10.1073/pnas.91.9.3602. Research Support, Non-U.S. Gov’t Research Support, U.S. Gov’t, P.H.S. [DOI] [PMC free article] [PubMed] [Google Scholar]
- 57.DeGregori J, Leone G, Miron A, Jakoi L, Nevins JR. Distinct roles for E2F proteins in cell growth control and apoptosis. Proceedings of the National Academy of Sciences of the United States of America. 1997 Jul 8;94(14):7245–50. doi: 10.1073/pnas.94.14.7245. Research Support, Non-U.S. Gov’t Research Support, U.S. Gov’t, P.H.S. [DOI] [PMC free article] [PubMed] [Google Scholar]
- 58.Conklin JF, Baker J, Sage J. The RB family is required for the self-renewal and survival of human embryonic stem cells. Nat Commun. 2012 Dec 4;3:1244. doi: 10.1038/ncomms2254. [DOI] [PubMed] [Google Scholar]
- 59.Schvartzman JM, Duijf PH, Sotillo R, Coker C, Benezra R. Mad2 Is a Critical Mediator of the Chromosome Instability Observed upon Rb and p53 Pathway Inhibition. Cancer Cell. 2011 Jun 14;19(6):701–14. doi: 10.1016/j.ccr.2011.04.017. [DOI] [PMC free article] [PubMed] [Google Scholar]
- 60.Pfau SJ, Amon A. Chromosomal instability and aneuploidy in cancer: from yeast to man. EMBO Rep. 2012 Jun;13(6):515–27. doi: 10.1038/embor.2012.65. Research Support, Non-U.S. Gov’t Review. [DOI] [PMC free article] [PubMed] [Google Scholar]
- 61.Carter SL, Eklund AC, Kohane IS, Harris LN, Szallasi Z. A signature of chromosomal instability inferred from gene expression profiles predicts clinical outcome in multiple human cancers. Nature genetics. 2006 Sep;38(9):1043–8. doi: 10.1038/ng1861. Comparative Study Research Support, N.I.H., Extramural Research Support, U.S. Gov’t, Non-P.H.S. [DOI] [PubMed] [Google Scholar]
- 62.Ertel A, Dean JL, Rui H, Liu C, Witkiewicz AK, Knudsen KE, et al. RB-pathway disruption in breast cancer: differential association with disease subtypes, disease-specific prognosis and therapeutic response. Cell Cycle. 2010 Oct 15;9(20):4153–63. doi: 10.4161/cc.9.20.13454. Research Support, N.I.H., Extramural Research Support, Non-U.S. Gov’t. [DOI] [PMC free article] [PubMed] [Google Scholar]
- 63.Kang H, Cui K, Zhao K. BRG1 controls the activity of the retinoblastoma protein via regulation of p21CIP1/WAF1/SDI. Molecular and cellular biology. 2004 Feb;24(3):1188–99. doi: 10.1128/MCB.24.3.1188-1199.2004. Research Support, U.S. Gov’t, P.H.S. [DOI] [PMC free article] [PubMed] [Google Scholar]
- 64.Weglarz L, Molin I, Orchel A, Parfiniewicz B, Dzierzewicz Z. Quantitative analysis of the level of p53 and p21(WAF1) mRNA in human colon cancer HT-29 cells treated with inositol hexaphosphate. Acta Biochim Pol. 2006;53(2):349–56. [PubMed] [Google Scholar]
Associated Data
This section collects any data citations, data availability statements, or supplementary materials included in this article.
Supplementary Materials
Previously described measures of numerical heterogeneity (NH) for the NCI-60 panel of cell lines (25) are used as an indication of whole chromosome instability, where the third of cells in this panel exhibiting high NH/CIN are highlighted in red and given a score of 3, those in the middle third are highlighted in yellow and given a NH score of 2, and the third with low heterogeneity are highlighted in green and given a NH score of 1. Analysis of TP53 mutational status shows no correlation with degree of NH/CIN (p>0.5), nor does mutational status of RB1 and/or it’s regulator CDKN2A/p16 (p>0.1). Mutation/loss of function of both pRB and p53 together significantly correlates with high NH/CIN in this panel of cell lines (p<0.05)
A) Numerical Heterogeneity scores for probes specific for chromosomes 6 and 8 show similar distributions of copy number heterogeneity within each cell line, indicating that the average variation used as a readout of CIN is not due to stable subclonal populations. B) Although polyploidy has been suggested to promote CIN, ploidy levels vary within this panel of cell lines and across groups of cells with High, Mid, and Low NH, suggesting that measures of NH are not simply an indirect readout of aneuploidy.
Measures of numerical heterogeneity within a population are similar for various chromosomes, indicating these measures represent an increase in random mis-segregation events, not selection of specific, stable subclones. Distributions of copy number for each chromosome are shown for Y79 cells (blue) and Y79 cells depleted of p53 (red). Overall Numerical Heterogeneity of each chromosome in each population is represented as the percent of cells exhibiting a copy number for a given chromosome other than the modal copy number (mode is 3 for chromosome 2, and 2 for chromosomes 6 and 8). The fold change in NH for each chromosome is represented as the NH in p53-depleted cells normalized to the NH in control cells.
A &B) Measures of the distance between sister kinetochores in metaphase cells were performed as a readout of centromeric cohesion (Kinetochore: Hec1 in green; Centromere: ACA in red). Re-expression of pRB via a tet-inducible promoter is sufficient to suppress defects in interkinetochore distances in U2OS cells normally lacking pRB activity C) Mitotic chromosome spreads were prepared following a 30 min nocodazole treatment to induce microtubule depolymerization. Chromatin was stained with DAPI and sisters were assessed for chromosome arm cohesion. Consistent with results in SAOS cells, re-expression of pRB in p53 KO mouse osteosarcoma cells suppresses sister chromatid cohesion defects.