Abstract
Three-dimensional fluid–structure interaction (FSI) involving large deformations of flexible bodies is common in biological systems, but accurate and efficient numerical approaches for modeling such systems are still scarce. In this work, we report a successful case of combining an existing immersed-boundary flow solver with a nonlinear finite-element solid-mechanics solver specifically for three-dimensional FSI simulations. This method represents a significant enhancement from the similar methods that are previously available. Based on the Cartesian grid, the viscous incompressible flow solver can handle boundaries of large displacements with simple mesh generation. The solid-mechanics solver has separate subroutines for analyzing general three-dimensional bodies and thin-walled structures composed of frames, membranes, and plates. Both geometric nonlinearity associated with large displacements and material nonlinearity associated with large strains are incorporated in the solver. The FSI is achieved through a strong coupling and partitioned approach. We perform several validation cases, and the results may be used to expand the currently limited database of FSI benchmark study. Finally, we demonstrate the versatility of the present method by applying it to the aerodynamics of elastic wings of insects and the flow-induced vocal fold vibration.
Keywords: Fluid-structure interaction, immersed-boundary method, finite-element method, large deformations, biological flows, insect flight, vocal fold
1. Introduction
Fluid–structure interaction (FSI) can be found for many biological tissues and organs. Among the examples are insect wings, fish fins, human heart valves, and human vocal folds. Although their anatomies, physiological components, and mechanical behaviors are quite different from one another, these deformable bodies share the kinematic features of large deformation in the three-dimensional (3D) space, and the time-varying deformations are critical for the bodies to perform their physiological functions. Because of the large deformation and also the intrinsic complexity of the accompanying flow, computational modeling of the 3D FSI for this type of problems is highly challenging and thus has not been extensively explored.
Conventional numerical approaches for FSI are usually based on a body-fitted grid. Examples include the arbitrary Lagrangian–Eulerian formulation (ALE) [1, 2] and the space-time finite-element method [3, 4]. The grid in these methods can be either structured or unstructured. Furthermore, the solid body and the flow are meshed separately. That is, a Lagrangian mesh following the material points is used to discretize the solid body, and another moving mesh is employed to discretize the flow and is generated to conform to the instantaneous shape of the solid body. With this body-conformal mesh, the boundary conditions of the flow can be imposed at the solid surface in a straightforward manner. In addition, the flow mesh near the solid surface may be refined locally to resolve the boundary layer. The disadvantage of these methods is that an algorithm is needed to move the mesh points in the bulk fluid along with the points at the boundary. For example, an elliptic partial differential equation can be solved numerically to generate an orthogonal mesh [5]. Alternatively, an elastic deformation problem can be solved for the pseudo material occupying the fluid region to displace its mesh points [4]. Whichever method of mesh generation is used, in the case of large deformations significant effort is usually required to prevent severe mesh distortion from happening. For example, mesh smoothing techniques [6] and overset grids [7] have been used to handle large displacements of solid bodies. In general, mesh generation is an expensive process. Especially when the solid body has a complex shape and experiences large deformations, extensive computations are needed to frequently update the mesh topology. In such cases, the methods that are based on fixed and non-body-conformal grids may provide more attractive alternatives.
There are several methods in computational fluid dynamics that have been designed for complex/moving boundaries but are based on fixed grids. The most notable among them is the immersed-boundary method which has gained popularity for a wide range of applications in recent years. The underlying ideas of the immersed-boundary method are very different depending on the specific implementations, for example, the continuous forcing approach originally developed by Peskin [8], the direct forcing approach based on local flow reconstruction [9, 10, 11], and the projection approach by Taira & Colonius [12]. Nevertheless, all of these versions of the method are able to treat the irregular and time-varying boundaries using a fixed, single-block Cartesian grid without the need to contend with the motion of the solid body. Therefore, they share the merits of simple grid generation, efficient computation on the structured grid, and easy partition based on domain decomposition [13]. On top of the fundamental ideas of the immersed-boundary method, many additional features have been developed to enhance the capability or improve the performance of the method, for example, multi-block and adaptive meshes to enable local refinement [14], curvilinear grids to adapt to the overall geometrical feature of the fluid domain [15, 16], and approaches to suppress the numerical oscillations associated with moving boundaries [17, 18, 19].
Thanks to its advantages, the immersed-boundary method is particularly suitable for simulation of the flows involved in the biological and biomedical FSI problems at the tissue and organ levels. Indeed, this method has been adopted previously in many cases. For example, Peskin [20] described a three-dimensional modeling approach for simulating the interaction of a viscous flow with an immersed elastic thin structure that is motivated by the fluid dynamics of the heart. De Tullio et al. [21] and Ge & Sotiropoulos [22] have performed three-dimensional simulations of mechanical heart valves by coupling an immersed-boundary method with the spring-connected leaflets. Luo et al. [23] presented an immersed-boundary approach for both the flow and the solid body and applied the method to the flow-induced vocal fold vibration that occurs during phonation. These examples have demonstrated the flexibility of the immersed-boundary method in the FSI applications. However, these previous FSI studies using the immersed-boundary method are usually limited to simple solid-body mechanics, i.e., 2D problems, rigid-body dynamics, or linear elasticity. There are few cases that have applied the immersed-boundary method for the FSI problems involving more complicated structural behaviors. For example, in Huang & Sung [24], a first-order accurate immersed-boundary method is coupled with a structural model to simulate a flapping flag. Their method is able to capture the large displacement and complex deformation of the flag. However, the structural model in their work is based on a finite-difference method and is only suitable for bodies with simple rest shapes. In solid mechanics, the finite-element method is the predominant approach for analyzing nonlinear structures of general shapes and complex material behaviors, but this method has not been often combined with the immersed-boundary method for the FSI applications that involve large deformations. A recent benchmark study by Bhardwaj and Mittal [25] describes such a combination but the discussion is limited to 2D and the linear material behavior. A preceding work of ours [26] discusses similar coupling with thin-walled structures, but the method needs to be further validated.
Since using the immersed-boundary method for general FSI simulations has not been well explored, a particular contribution of the current work is that we successfully combine an existing second-order immersed-boundary method with a finite-element program for modeling nonlinear biological structures whose large deformations can cause both geometric nonlinearity and material nonlinearity. Compared with the previous FSI methods that adopt a similar immersed-boundary flow solver and coupling approach [25, 26], the current method is not a conceptually new method but nevertheless represents a significant enhancement of those methods. Furthermore, an additional issue we would like to address in this work is there has been a lack of the numerical benchmark cases for the FSI problems involving deformable bodies [25]. One existing benchmark problem that consists of a laminar channel flow past a vibrating beam attached to the lee side of a circular cylinder was recently proposed by Turek and Hron [27], where the beam is modeled as a Saint Venant–Kirchhoff material, i.e., an extension of the linear elastic material model to the geometrically nonlinear regime. Several previous studies adopted this 2D problem for benchmarking their FSI solvers [25, 28]. Given that similar validation cases are scarce, the second contribution of the present work is that we enrich the current database of the FSI validation cases by performing simulations of both 2D and 3D flexible bodies.
The immersed-boundary method we adopt in the current work is previously developed by Mittal et al. [11] and later improved by Luo et al. [19]. These authors have demonstrated the versatility of the method by applying it to several problems including fish swimming and insect/bird flight. The structure solver is also an in-house program for nonlinear analysis of solids and structures [29, 30, 31], which has separate modules to handle thin-walled structures (e.g., frames, membranes, and plates) and general 3D elastic and hyperelastic bodies. To enhance the numerical stability, a partitioned iterative procedure is applied to combine the fluid and solid solvers in a strong coupling manner. In this work, we will focus on several FSI benchmark cases, all of which involve large-displacement deformations but have relatively simple setups. For each case, we will report details of the problem configuration to help readers who wish to use it in future studies.
The organization of the paper is as follows. The governing equations of the fluid and solid structures are described in Section 2; the numerical approach is introduced in Section 3; the validation and benchmark cases are presented in Section 4; two applications of the FSI method are described in Section 5; and final conclusions are provided in Section 6.
2. Governing equations
The flow considered here is governed by the three-dimensional viscous incompressible momentum equation and the continuity equation,
| (1) |
where ρf is the constant density, ν is the kinematic viscosity, vi is the velocity, p is the pressure.
The dynamics of the solid is governed by
| (2) |
where ui is the displacement, ρs is the density of the material, ηd is the damping coefficient, σij is the Cauchy stress tensor, and bi is the body force such as gravity. The time derivative, d/dt, in the equation is measured in the Langrangian framework. Two material behaviors are included here for the 3D solid bodies: (1) elastic materials that undergo large-strain deformations but still have a linear stress-strain relationship; (2) hyperelastic materials that experience large-strain deformations and have a nonlinear stress-strain relationship. For the first material, the constitutive relationship is the Saint Venant–Kirchhoff model expressed by
| (3) |
Here Dijmn is the elastic matrix with 12 non-zero elements that depend on Young’s modulus E and the Poisson’s ratio νs [32, 31]. Emn is the Lagrangian strain tensor defined by
| (4) |
where Xi refers to the material point in the initial configuration (undeformed state). is the second Piola–Kirchhoff stress tensor, which is related to σij by
| (5) |
with .
For the nonlinear material behavior, we consider rubber-like materials, which have been commonly used for modeling soft tissues with elastic moduli ranging from on the order of 100 Pa for the brain to 100000 Pa for soft cartilage [33]. The Mooney–Rivlin model describes the constitutive relationship for this type of materials,
| (6) |
where Cij is Cauchy-Green deformation tensor given by
| (7) |
K plays the role of a bulk modulus and is set at a large value to represent incompressibility, and the coefficients are given by
| (8) |
In Eqs. (6) and (8), α10 and α01 are free material parameters, and the invariants are given by
| (9) |
where λ1, λ2, and λ3 are the principal stretches.
For reinforced thin structures such as insect wings and fish fins, we approximate the spars with frames and the membranes with plates. For these structures, the local strain is assumed to be small so that the linear stress-strain relationship in Eq. (3) is used. Furthermore, the linear version of Eq. (4) can be used for the expression of the strain. However, since the structures may experience large-displacement and large-rotation deformations, geometric nonlinearity is thus incorporated in the formulation as discussed later in Section 3.2. Only 2D (for plates) or 1D (for frames) discretization is needed for these structural components. Their deformation under the resultant forces and moments on the cross sections can be derived using the classical theory of beams and plates. The mathematical formulations can be found in many textbooks of solid mechanics [29]. For example, the in-plane (stretching and drilling) behavior of the plate can be written as
| (10) |
and the out-of-plane (flexural) behavior of the plate can be written as
| (11) |
In these expressions, h is the thickness of the plate, I = h3/12 is the area moment of inertia of the cross section, ūi is the displacement measured in the local coordinate system for which ξ and η are the two tangential coordinates, Nij and Mij are respectively the resultant forces and moments acting on the cross section.
3. Numerical approach
3.1. The immersed-boundary method for the flow
An in-house FORTRAN 90 code is used to simulate the flow. Its numerical method is based on an immersed-boundary method initially developed by Mittal et al. [11] and later improved by Luo et al. [19]. A brief summary of the method is provided here.
The governing equations in (1) are discretized on a nonuniform Cartesian grid using a cell-centered, non-staggering arrangement of the primitive variables, v and p. The momentum equation is integrated in time using a variation of Chorin’s projection method which consists of three sub-steps. In the first substep, an advection-diffusion equation is solved in the absence of the pressure, and an intermediate velocity field, v*, is obtained. In this step, both the nonlinear advection term and the viscous term are discretized using the Crank–Nicolson scheme to improve the numerical stability. The discrete equation is written as
| (12) |
where vn is the velocity at the current time step, V is the face-centered velocity obtained by computing the linear average of v along the corresponding direction, and the spatial derivatives are discretized by a second-order central scheme. The algebraic system is solved by using the Gauss–Siedel line relaxation method for the linearized system and using successive substitution for nonlinear iteration. In the second substep, a projection function is solved as an approximation of the pressure,
| (13) |
and in the third substep, the velocity is updated as
| (14) |
The special treatment at the fluid–solid interface is the improved second-order sharp-interface immersed-boundary method [19]. In this method, the entire rectangular domain including the fluid and the immersed body is discretized by the volume mesh, i.e., the Cartesian grid, and the exposed surface of the solid body is represented by a set of Lagrangian marker points and linear triangular elements. The algorithm of determining the interior and exterior points is described in Mittal et al. [11]. To impose the velocity and pressure boundary conditions at the interface, ghost nodes and hybrid nodes are defined near the interface. Specifically, at the nodes immediately next to the interface, the finite-difference stencil involves some nodes that are located inside the solid body. These special nodes located in the fluid are termed hybrid nodes, and the corresponding nodes inside the solid body are termed ghost nodes. The variables at the ghost nodes are extrapolated from the interior flow field as described in Mittal et al. [11]. The variables at the hybrid nodes are weighted averages between the interpolated solution and the solution to the momentum equation (for the velocity) or the Poisson equation (for the pressure). Such a hybrid formulation helps to suppress the numerical oscillations caused by a moving body.
3.2. Finite-element formulation for the solid
The finite-element formulation in the structure solver is derived from the standard virtual work method. Let the displacement in a volume element be represented by
| (15) |
where hk(X, Y, Z) is the shape function associated with the kth node in the element and uk is the displacement u at this node. The second part of the equation is written in the compact form, where [H] is the matrix containing hk and {u} is the vector containing the three displacement components at all the nodes. Other variables can be expanded in a similar manner as in Eq. (15).
Using the virtual work of the inertial load, body force {b}, and surface traction {f} along with the expansion of the variables, the assembled equation system for the entire body can be written as
| (16) |
where [M] is the mass matrix, [C] is the mass-damping matrix, {P} is the force vector from the external load, and {F} is the body stress vector. These assembled terms are given by
| (17) |
| (18) |
| (19) |
| (20) |
where represents the original volume of the mth element and [BE] is the matrix containing the derivatives of the strain tensor Eij with respect to the displacement ui. The increment of the body-stress term can be further written as
| (21) |
where [KT ] is the total stiffness matrix given by
| (22) |
and [BD] is a matrix containing the spatial derivatives of the shape function hk. The formulations in Eqns. (16) to (22) can be used for both the rubber material and the elastic material with large deformations. The differences between the two materials are that the calculations of the matrices such as [BE], [BD], [σK], and depend on the material’s own constitutive law. For general 3D bodies, hexahedral (or brick-type) quadratic 20-node elements [34] (8 vertical nodes and 12 mid-edge nodes) are used in the finite-element formulation. The numerical integration over the volume of an element is done using the 27-point Gauss–Legendre quadrature.
The finite-element formulation of the thin-walled structures includes the three-node plate elements and two-node frame elements, where each node has six global degrees of freedom, including three displacement components, ui, and three angles of rotation, φi. The plate elements used are the discrete Kirchhoff triangular element, which has been widely researched and documented as being one of the most efficient flexural elements [35]. For such structures, the discrete equations can be written in the same forms as in Eq. (16) to Eq. (22), except that {u} represents the generalized displacement vector with φi included and [σK] represents the generalized stress with moments included. In addition, the large-displacement and small-strain deformation in the structure solver is handled using the corotational scheme. That is, a local coordinate system is envisioned as moving with each discrete element, and relative to this coordinate system, the element behaves linearly as described by the constitutive law. Consequently, the nonlinearities of the problem are due to large deflections and rotations.
For both thin-walled and general 3D structures, the time stepping is done using a case of Newmark scheme [29], which is described below along with Newton–Raphson iteration,
| (23) |
where {Δu} is the incremental displacement, s is the iteration counter, and the predictors are given by
γ = 0.5 and β = 0.25 are chosen in the scheme. Once {u}n+1 is obtained, the acceleration and velocity are updated according to
The in-house software is written in FORTRAN 90, and more details can be found in its documentation [30].
3.3. Fluid–structure coupling
The incompressible Navier–Stokes equation is combined with the structural dynamics through the boundary conditions, which include the no-slip, no-penetration, and traction conditions,
| (24) |
where Xb and vb are respectively the position and the velocity of the boundary, σ and f are respectively the stress tensor and the hydrodynamic traction on the boundary including the pressure and viscous components, and n is the surface normal. The flow and structure solvers share the triangular mesh on the exposed surface of the solid, and the pressure and the viscous stress are interpolated from the flow field onto the nodal points of the surface mesh. The most straightforward way of coupling the two solvers is an explicit coupled approach, i.e., weakly or loosely coupling [36]. That is, the flow and the structure are solved sequentially and only once in one time step. Thus, at the end of a time step, the boundary conditions between the flow and the solid body mismatch by one-half step. This approach is computationally efficient, but it can sometimes lead to numerical instability. In particular, when the solid-to-fluid density ratio is low enough, the explicit scheme becomes unstable. A theoretical analysis for this issue can be found in Zheng et al. [37]. In the present work, an implicit coupling, or strong-coupling [36], approach based on staggered sub-iteration is used to improve the stability of the FSI coupling, which can be summarized as follows:
At time level n, the hydrodynamic traction f(k) is interpolated onto the solid surface , where k is the iteration number and f(1) and take the values from time level n.
The solid dynamics, Eq. (16), with f(k) held constant, is solved for one full time step using the method described in Section 3.2; and are obtained in the end. This step may be further split into several substeps depending on the stiffness of the equation and the stability of the structure solver.
-
and are supplied to the flow solver, and Eqns. (12) to (14) are solved; v*k+1, pk+1, and vk+1 are then obtained. Note that the Crank–Nicolson scheme described in Eq. (12) utilizes the velocity vn that is saved throughout the fluid–structure iteration.
The hydrodynamic traction f(k+1) is obtained from the updated flow field, and the procedure is repeated over from Step 2.
To ensure the numerical stability of this staggered iteration, the velocity of the solid surface are updated in the flow solver in a gradual fashion according to
| (25) |
where is the predicted velocity by the structure solver and α is the relaxation factor between 0 and 1. The displacement Xb in the flow solver and the traction f in the structure solver can be updated in a similar manner if necessary. In most of our simulations, α = 0.6 is chosen for the velocity update, and α = 1 for the displacement and traction update. For some cases discussed later where numerical stability is difficult to achieve, α = 0.2 is also used along with the cost of more iterations. The residuals as measured by the maximum errors of the displacement, the velocity, and the traction at the solid surface are used to determine whether final convergence is reached. Typically, five fluid–structure iterations are sufficient in our simulations to guarantee convergence of the coupling. A flow chart describing more details of the entire solution process is given in Luo et al. [26].
The strong-coupling approach described here belongs to the partition method [36]. Although the computational cost of this approach is high as compared to the explicit approach, numerical stability can be achieved through the iteration, and the FSI algorithm is thus much more robust. The reason is that the iteration ensures that at the end of each time step, the displacement, velocity, and traction boundary conditions are matched (within specified tolerances) between the flow and the solid body, thus leading to implicit coupling [36]. Another advantage of this simple method is that it maintains the modular form of each solver and requires only a small amount of programming effort. For the applications considered in the present work, the cost of solving the flow is singularly dominant over the of cost of solving the structure. Therefore, the flow solver is parallelized for computation acceleration, and this has been done by using a sparse matrix package, Aztec, which was developed at the Sandia National Laboratories.
4. Validation of the numerical method
Six validation cases are considered in this section. The first three cases are designed for separate validation of the structure and flow solvers, which are included here to show the accuracy of the two in-house programs. The other three cases are designed specifically for the FSI validation.
4.1. Validation of the structure solver: free vibration of a cantilever beam
Numerous examples of the current structure solver can be found in related publications [29, 31], including thin-walled and general 3D bodies of elastic and hyperelastic materials. We describe only one validation case here to demonstrate the nonlinear solver’s accuracy. For this purpose, the dynamic vibration of a cantilever beam is considered. As shown in Fig. 1, a cantilever beam under uniformly distributed impulse load is analyzed using the finite-element method introduced in Section 3. The material of the cantilever is assumed to be isotropic and elastic with geometrical nonlinearity (i.e., large displacement) incorporated. The parameter values in the setup are chosen to be the same as those in Bathe & Wilson [38].
Figure 1.

A schematic of the cantilever beam under an impulse load, where L = 10 in., b = h = 1 in., E = 12000 lbf/in.2, νs = 0.2, ρs = 10−6 lbf·s2/in.4, and P = 2.85 lbf/in.2.
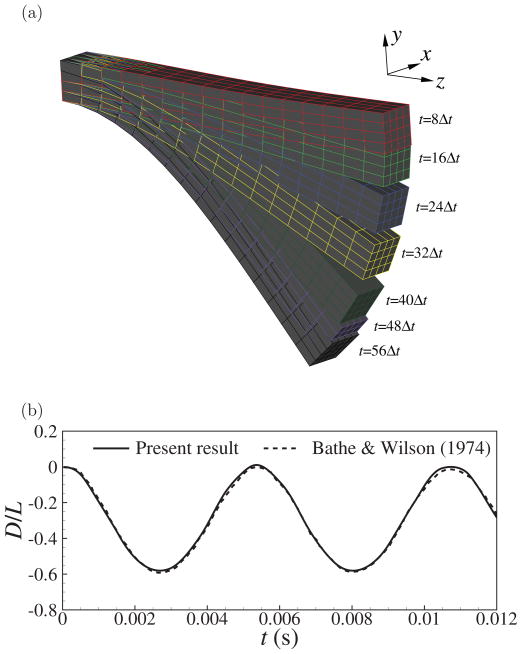
To study the dynamic vibration, an impulse transverse load is applied at t = 0 with a magnitude of 2.85 psi, which is distributed evenly on the top and bottom surfaces as shown in Fig. 1. For the simulation, 8 × 2 × 2 elements are used, and the time step is Δt = 0.45 × 10⁻⁴ s which corresponds to about 126 steps for a complete vibration cycle. Fig. 2(a) shows the sequence of the large-displacement deformation of the beam during onset of vibration. Note that every 8 blocks in this figure represent a 20-node hexahedral element. Fig. 2(b) shows the time-varying vertical displacement of the free end, D/L, calculated at point A as indicated in Fig. 1. The result from Bathe & Wilson [38] is included here for comparison. The figure shows that the current result is in very good agreement with the previously well-established data. It should be pointed out that in this case only two elements are sufficient in the transverse directions because the Hex20 element uses quadratic interpolation functions.
Figure 2.
(a) Deformation pattern of the cantilever beam during onset of vibration. (b) The vertical (y) displacement of point A as indicated in Fig. 1.
4.2. Validation for the flow solver: an oscillating sphere in a quiescent fluid
The flow solver in the present work is the same as that in Luo et al. [19], where most of the moving-boundary cases are for 2D flows. Thus, an additional case is provided here to strengthen the 3D code validation.
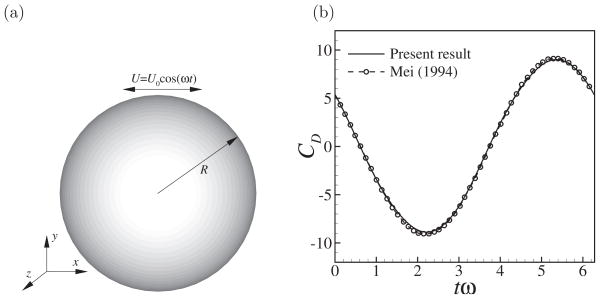
The first case, as shown in Fig. 3(a), concerns the unsteady flow caused by an oscillating sphere in a fluid that is quiescent at infinity. The oscillating velocity is prescribed as U = U0 cos(ωt), where U0 and ω are the velocity amplitude and the angular frequency of oscillation, respectively. The Reynolds number is defined as Re = 2RU0/ν, and the Stokes number is , where R is the radius of the sphere. The computational domain is a 34R×32R×32R rectangular box discretized by 200 × 184 × 184 Cartesian nodes. The Cartesian grid is uniform in all three directions within a 4R×3.2R×3.2R inner box enclosing the sphere, with grid spacing of Δx = Δy = Δz = 0.05R. The grid is stretched in the remainder of the domain. The Reynolds number and the Stokes number are set at Re = 40 and ε = 4, respectively, which are the same as Mei [39]. The simulation is performed with Δtω = 0.031416. The unsteady drag force is computed at each time step and is normalized by the Stokes drag, 6πρf νU0R. After the flow becomes periodic, we compare the drag coefficient of the sphere from our simulation with that in Mei [39], who solved the flow using the Fourier expansions. Fig. 3(b) shows the comparison, which demonstrates that very good agreement has been achieved between the two results.
Figure 3.
(a) An oscillating sphere in a quiescent fluid. (b) Comparison of the drag coefficient during an established cycle.
4.3. Validation for the flow solver: a circular disk immersed in flow
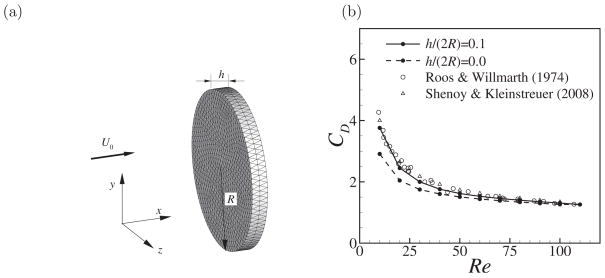
The solid body in the preceding sphere case has a smooth surface. In some applications, e.g., insect wings and fish fins, thin structures are involved. Therefore, it would be preferable to test the present flow solver for such bodies. In this section, we consider a circular disk immersed in a uniform flow as shown in Fig. 4(a). The rigid disk has a diameter R and thickness h, and it is centered at the origin. The Reynolds number is defined as Re = 2RU0/ν, where U0 is the freestream velocity. The computational domain is a 35R × 24R × 24R rectangular box discretized by 190 × 104 × 104 Cartesian nodes. The grid is uniform in all three directions within a 4R × 2.4R × 2.4R inner box containing the disk, where the grid spacing is Δx = Δy = Δz = 0.04R, and it is stretched in the remainder of the computational domain. This setup is similar to that used in Shenoy and Kleinstreuer [40]. In addition to the finite-thickness model with h/(2R) = 0.1, we also perform a separate series of simulations by assuming h/R → 0. The additional simulations will be used to test the capability of the flow solver in treating a “zero-thickness” body. Note that even for the zero-thickness body, an artificial thickness of two grid intervals is introduced in the flow solver to allow designations of ghost nodes inside the body [19].
Figure 4.
(a) A circular disk immersed in flow. (b) The drag coefficient CD for Reynolds number between 10 and 110.
Fig. 4(b) shows the time-averaged drag coefficient of the disk, CD, defined with , for Re between 10 and 110. Along with the simulation results are the data from the experiment by Roos and Willmarth [41] and from the simulation using a commercial CFD package by Shenoy and Kleinstreuer [40], both studies having the finite thickness at h/(2R) = 0.1. It can be seen from the figure that the drag coefficient with h/2R = 0.1 in the present study is in good agreement with those of previous studies for all of the Reynolds numbers considered. For the cases with h/(2R) = 0, the drag coefficient is close to that in the corresponding case of h/(2R) = 0.1 when Re is greater than 40 and the friction drag on the edge becomes less significant. It should be pointed out that when the Reynolds number is high, e.g., Re = 180, the flow becomes unsteady and vortex shedding occurs in the wake. As a result, an instantaneous lift is produced. We also compared the time history of the lift coefficient with that from Shenoy and Kleinstreuer [40] for h/(2R) = 0.1, and the agreement (not shown here) is very good.
To demonstrate that the present flow solver can treat a thin body in motion, we reduce the freestream velocity to 0.9U0 and move the disk against the flow with −0.1U0. Simulations are performed at Re = 110 for this equivalent problem. The results show that the error in CD is around 3.2% for h/(2R) = 0.0 and 1.5% for h/(2R) = 0.1, which is deemed satisfactory in this work. In summary, the present solver is capable of handling 3D flows involving stationary or moving thin structures.
4.4. FSI validation: flow-induced vibration of an elastic beam behind a cylinder
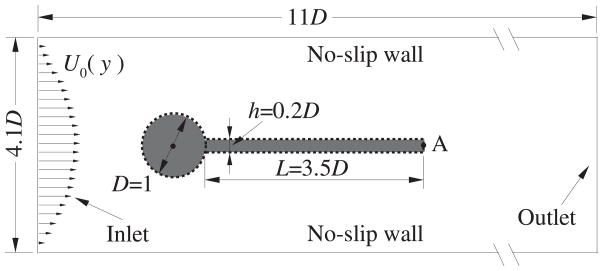
In this section, we present the validation results for a 2D benchmark problem: flow-induced vibration of a flexible beam that is attached to the downstream side of a stationary and rigid cylinder, as shown in Fig. 5. The beam material is assumed to be governed by the Saint Venant–Kirchhoff model. The problem was proposed by Turek and Hron [27] and has been frequently used as a large-displacement benchmark validation for 2D FSI solvers [25, 28]. For this test, the 3D flow solver is set to perform 2D simulations in a thin slice, and the structure has a wide span so that the cross section at the mid-span essentially experiences the plane-strain deformations.
Figure 5.
Model setup for flow-induced vibration of a flexible beam attached to a rigid cylinder.
The computational domain is shown in Fig. 5 along with all of the geometric parameters. The top and bottom sides of the domain are no-slip walls and the flow at the inlet (left side) has a parabolic velocity profile. The average velocity at the inlet is Ū0; the cylinder diameter is D; and the beam length is L and the thickness is h. Two cases are considered here: (1) ρs/ρf = 10, Re = Ū0D/ν = 100 and (2) ρs/ρf = 1, Re = 200. The other parameters are chosen to be , νs = 0.4, and the length and the thickness of the beam are 3.5D and 0.2D, respectively. The rectangular domain is −2 ≤ x/D ≤ 9 and −2.05 ≤ y/D ≤ 2.05D, and the cylinder is centered at the origin. A 240 × 100 nonuniform grid with Δxmin/D = Δymin/D = 0.025 is applied to the region in which the beam is expected to move. The beam is treated as a 3D body and is discretized with a uniform mesh of 32 × 2 × 20 elements. The time-step size is set to be Δt = 0.01D/Ū0, which corresponds to about 500 steps per vibration period. An initial perturbation is introduced to the beam to seed the system instability. For the case with low density ratio, ρs/ρf = 1, to converge, the relaxation factor is set to be α = 0.2 for the boundary velocity and traction update during the FSI iteration.
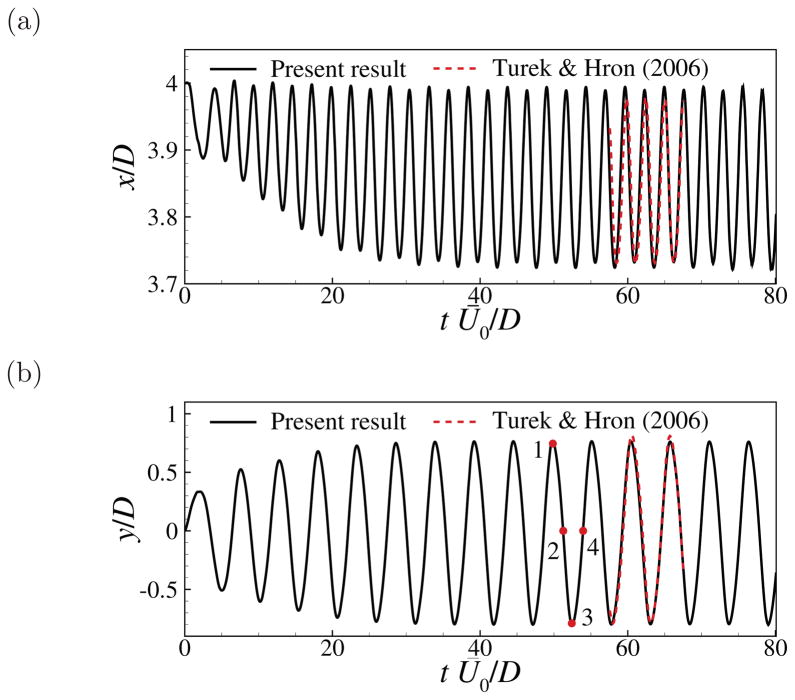
The time-varying position of the free end of the beam for ρs/ρf = 10, calculated at point A as marked in Fig. 5), is shown in Fig. 6 along with the results from Turek and Hron [27]. From the figure we note that the flexible beam reaches a periodic oscillation approximately after tŪ0/D = 40. During the stationary-state vibration, the period of a cycle is about 5.29D/Ū0, and the amplitudes of the x- and y-coordinates of the free end are 0.132D and 0.784D, respectively. Fig. 6 further shows an excellent agreement between the present result and that of Turek and Hron [27].
Figure 6.
Flow-induced vibration of the beam attached to a cylinder (ρs/ρf = 10 and Re = 100): comparison between the present work and Turek and Hron [27] for the stationary-state variation of the x- and y-positions of the free end (point A marked in Fig. 5).
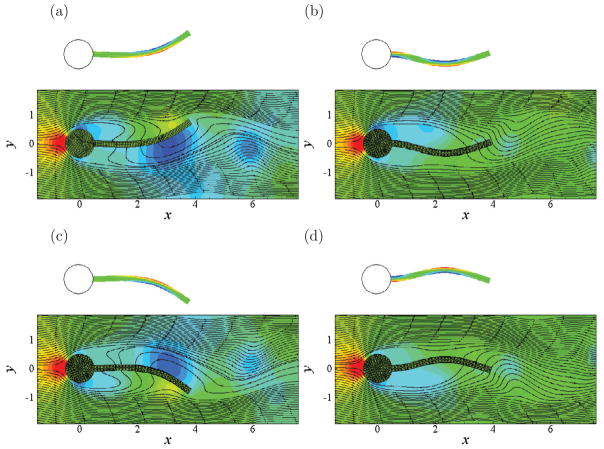
The amplitude of the y-coordinate of the free end, the Strouhal number defined by St = fŪ0/D (f is the vibrating frequency), and the average drag coefficient are shown in Table 1 along with the data from several sources. Here F̄x is the average drag of the cylinder-beam system. From the table we found that the present results are in good agreement with the previous results. We further plot in Fig. 7 the pressure contours, streamlines, and deformation of the beam at four time instances that are labeled in Fig. 6. These results qualitatively agree with those in Turek and Hron [27] and Bhardwaj and Mittal [25]. The dominant strain component, E11, is also shown in this figure for future reference.
Table 1.
Flow-induced vibration of the beam attached to a cylinder: amplitude of the y-displacement of the free end, the Strouhal number St, and the drag coefficient.
Figure 7.
Flow-induced vibration of the beam attached to a cylinder (ρs/ρf = 10 and Re = 100): distribution of the strain component E11, pressure contours, streamlines, and deformation of the beam at four time instances labeled in Fig. 6(b). The ranges of the contours are from −0.03 to 0.03 for E11 and from −1.5 to 1 for pressure.
4.5. FSI validation: 3D flow around a flapping flag
A flapping flag in the wind is a classical model problem for the fundamental understanding of FSI processes. However, the 3D simulation of the complex flapping motion is very challenging and has only been done in a few cases [42, 24]. In the present work, we will perform a 3D simulation of the flag and compare the results with those of Huang and Sung [24] who adopted a diffuse-interface immersed-boundary method for the same problem.
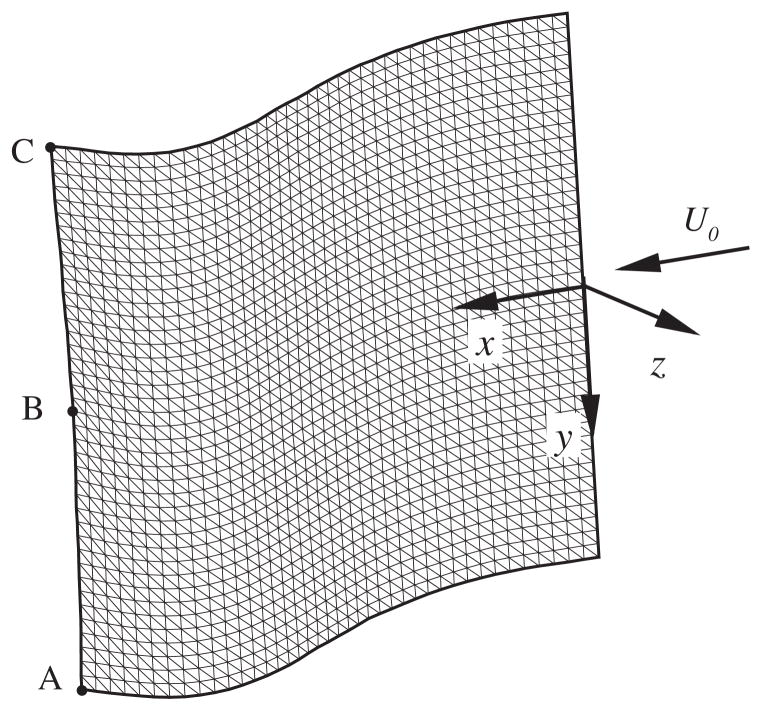
The setup is shown in Fig. 8, where a square flag of length L initially lies flat in the xy-plane, and the center of its leading edge is positioned at the origin. The leading edge is pinned, and the other three edges are free boundaries. The uniform freestream velocity U0 is in the x-direction.
Figure 8.
A flag flapping in uniform flow.
In the present simulations, the computational domain for the flow is a rectangular box extending from (−2L, −4L, −2L) to (8L, 4L, 2L). The simulations are performed on a 164 × 124 × 120 nonuniform grid with points clustering around the flag and in the near-field wake. The minimum spacing is Δx = Δy = Δz = 0.02L. Two solid models are used for the flag to test the different modules in the structure solver. One is a plate model where the thickness is assumed to be infinitesimal (labeled as Flag 1), and the other is a 3D body with finite thickness h = 0.01L (labeled as Flag 2). For the flow, the two models are nearly equivalent since the Reynolds number considered here is moderate. As in Section 4.3, to treat an infinitely thin body in the current immersed-boundary flow solver, an artificial thickness is introduced so that the treatment approach of such boundaries is essentially the same as that for general 3D bodies [19].
For Flag 1, a triangular mesh of 3200 elements are used to discretize the flag surface, and for Flag 2, a 20-node hexahedral mesh of 25 × 25 × 2 elements are used to discretize the flag body. In both cases, the Reynolds number is Re = U0L/ν = 200, the mass ratio is ρsh/(ρfL) = 1.0, the bending rigidity is , and Poisson’s ratio is νs = 0.4. A time step of Δt = 0.002L/U0 is used.
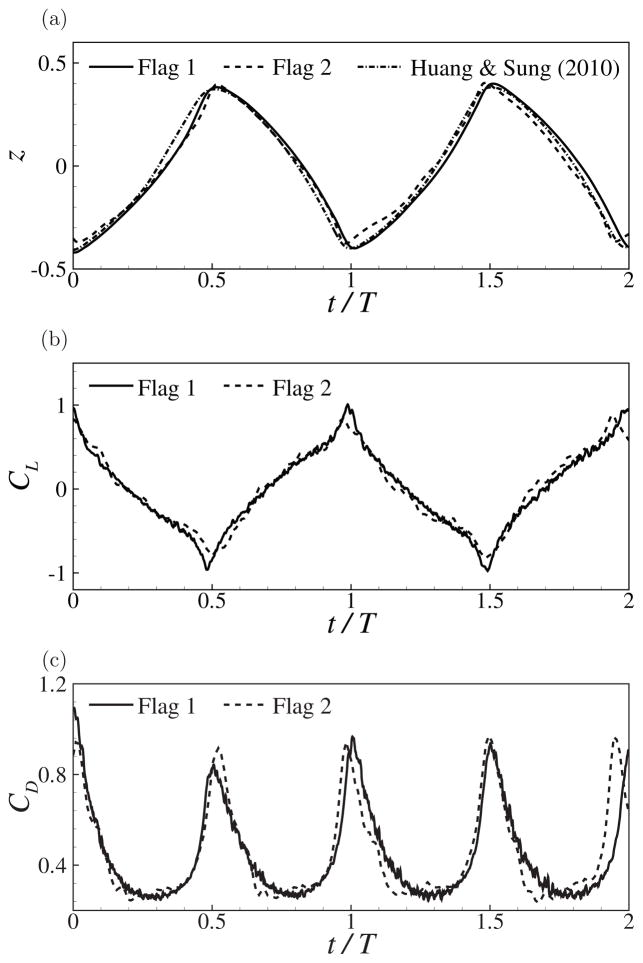
Fig. 9(a) shows the time histories of the transverse displacement of point B on the trailing edge of the flag (as indicated in Fig. 8) computed from both flag models. For comparison, the result by Huang and Sung [24] is also plotted in this figure. The peak-to-peak excursion amplitude, A/L, and the Strouhal number defined as St = fL/U0, f being the oscillation frequency, all quantities measured for point B, are tabulated in Table 2. It can be seen that the two flag models produce very similar results, and both are very close to the model in Huang and Sung [24]. Fig. 9(b, c) further shows that the drag and lift coefficients, which are defined with , are not very different for the two present flag models. Note that the drag and lift coefficients are not available in Huang and Sung [24] but are included here for future reference. These forces contain noticeable oscillations, which are due to the likely noise from prediction of the thin plate. A refined method as recommended by Bathe [43] will be considered in the future.
Figure 9.
A flag flapping in uniform flow. (a) The transverse displacement of point B (marked in Fig. 8), (b) the lift coefficient, and (c) the drag coefficient as a function of time, where T is the period of a flapping cycle.
Table 2.
A flag flapping in uniform flow: comparison of the excursion amplitude and the Strouhal number.
| Amplitude A/L | St | |
|---|---|---|
| Flag 1 | 0.812 | 0.263 |
| Flag 2 | 0.806 | 0.266 |
| Huang & Sung (2010) | 0.780 | 0.260 |
Fig. 10 shows a snapshot of the vortical structures for Flag 1, which is characterized by the isosurface using the Q-criterion defined by Hunt et al. [44]. Flag 2 has almost the same vortical structures and is thus not shown here. In this figure, the vortex shed from the trailing edge and the vorticies from the side edges are joined together to form a hairpin-type structure, and this hairpin may be connected with the downstream hairpin with two antennae. The flow pattern seen here is qualitatively consistent with the wake structure shown in Huang and Sung [24].
Figure 10.
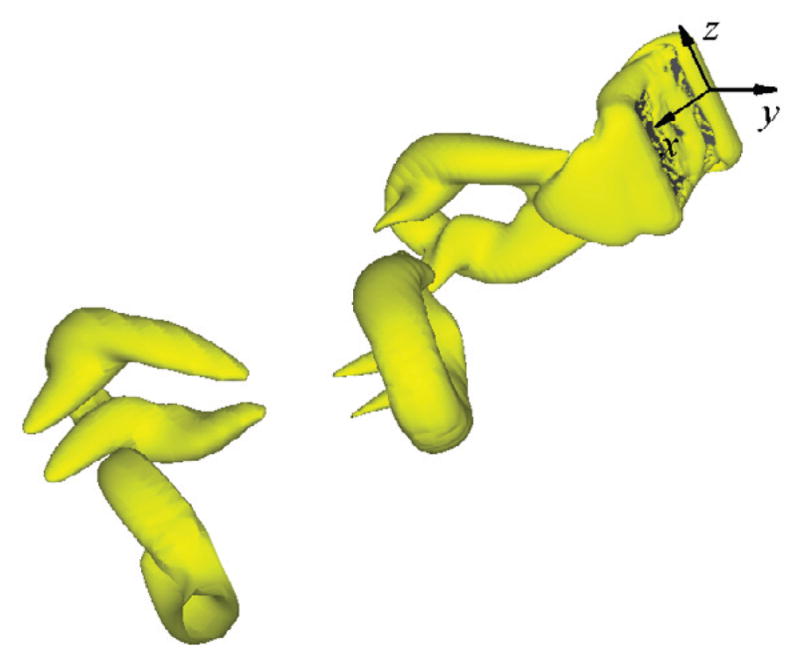
3D vortical structures produced by a flag flapping in uniform flow.
4.6. FSI validation: bending of a flexible plate in cross flow
In the last validation test, we consider a flexible plate that is bent by a cross flow. The simulation results will be compared directly with those from a recent experimental study by Luhar and Nepf [45]. As pointed out in the reference, this problem has been used as a model to study the deformation of aquatic plants by flow of water.
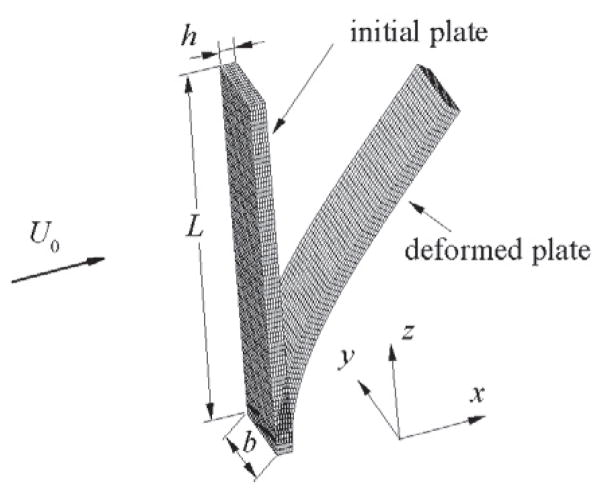
As shown in Fig. 11, an elastic plate of length L, width b, and thickness h is vertically placed in a uniform flow of velocity U0. One end of the plate is clamp-mounted and the other end is free. Following the experimental setup in Luhar and Nepf [45], we use these dimensionless parameters in the simulation: Re = U0b/ν = 1600, L/b = 5, h/b = 0.2, , νs = 0.4, ρ* = ρs/ρf = 0.678, and . The buoyant force is applied as the body force term in the equation of the solid body, Eq. (2). The computational domain for the flow is a rectangular box extending from (−5b, −8b, −8.5b) to (16b, 8b, 8.5b). The center of the plate is located initially at the origin. The simulation is performed on a 200 × 160 × 190 nonuniform grid with points clustering around the plate and in the near-field wake. The minimum grid spacings are Δx = 0.020b and Δy = Δz = 0.022b.
Figure 11.
Schematic of a vertical flexible plate in uniform flow.
We first compare the result of the baseline case with the experimental data. Fig. 12 shows the deformation pattern of the plate from the present simulation as well as that obtained by photogrammetry in Luhar and Nepf [45]. Under the experimental condition, the flexible plate settles down to a steady configuration which reduces the drag as compared with the rigid plate. This figure shows that the steady deformation is achieved by the present simulation and the simulated deformation pattern is very close to that observed in the experiment. Table 3 shows the drag coefficient of the deformed plate, CD, and the deflection in the x- and z-directions of the center of the free end, Dx and Dz. Here , where Fx is the total hydrodynamic force in the x-direction. Note that the error of the drag coefficient in the experiment is estimated to be around 10% [45]. Taking this error into consideration, all of these measures from the present simulation are in good agreement with the experimental data.
Figure 12.
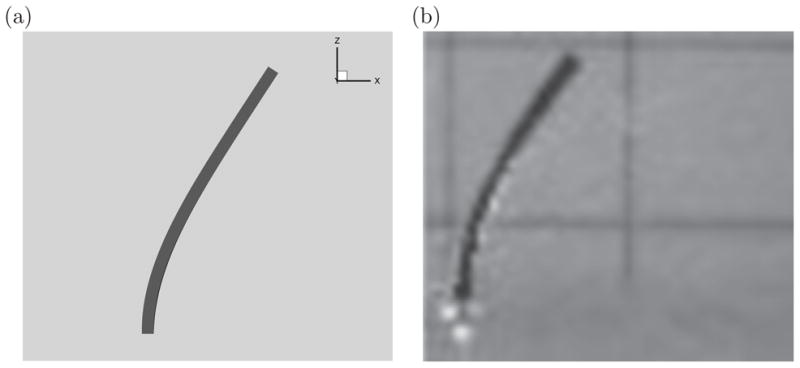
Bending of a flexible plate in cross flow. (a) The present baseline simulation, and (b) an image of the plate obtained from photogrammetry in Luhar and Nepf [45].
Table 3.
Bending of a flexible plate in cross flow: quantitative comparison between the present result and the experimental data [45].
| CD | Dx/b | Dz/b | |
|---|---|---|---|
| Present simulation | 1.03 | 2.12 | 0.54 |
| Luhar and Nepf [45] | 1.15 (with 10% error) | 2.14 | 0.59 |
After validating the baseline case, we then perform a series of simulations to expand the database of this problem for the future benchmark studies. For this purpose, we set the gravity and buoyancy to zero by disabling them in the simulations, and we vary Re from 100 to 1600 while keeping the rest parameters the same as in the baseline case. The simulation results are shown in Table 4 for the drag coefficient and the deflection of the free end. Several observations can be made from this table. First, the displacement of the plate at Re = 1600 in the absence of buoyancy is larger than that with buoyancy. Specifically, Dx/b in Table 4 is 2.45 and is around 16% larger than the baseline case in Table 3. Correspondingly, the drag coefficient in the absence of buoyancy is lower than that with buoyancy. Another observation from Table 4 is that the displacement increases with Re, which is in contrast with the 2D situation studied by Zhu et al. [46], who considered lower Reynolds numbers, Re ≤ 100. Finally, the drag coefficient decreases as Re is increased from 100 to 400 but then the reduction is negligible when Re is greater than 400.
Table 4.
Bending of a flexible plate in cross flow: deflection and the drag coefficient in the absence of gravity and buoyancy.
| Re | CD | Dx/b | Dz/b |
|---|---|---|---|
| 100 | 1.02 | 2.34 | 0.67 |
| 400 | 0.94 | 2.34 | 0.68 |
| 800 | 0.94 | 2.39 | 0.71 |
| 1200 | 0.93 | 2.41 | 0.73 |
| 1600 | 0.94 | 2.45 | 0.75 |
5. Applications of the numerical method
5.1. FSI simulation of the cicada
Having performed the validation studies, we now demonstrate the versatility of the current numerical method for some practical applications. The first one we consider is aerodynamics of the flexible flapping wings of insects. Since insect wings are thin structures typically consisting of a membrane and a network of veins, it is reasonable to model them as reinforced plates so that the inhomogeneous and anisotropic mechanical properties can be easily incorporated in the model. The finite-element method is clearly the best available approach for analyzing such structures as compared to other approaches that has been applied in similar FSI applications, e.g. the finite-difference method [23, 24].
In this work, we present a simulation of the cicada during tethered flight. The geometrical and mechanical properties of the wing structure, as well as the actuation kinematics of the wings at the root, are obtained in Luo’s lab at Vanderbilt University as described in Luo et al. [47]. Briefly, the live samples of the periodical cicada were collected, and the mechanical properties of their forewings were experimentally measured, which includes the mass distribution of the wings and the bending stiffness of the major spars. The insects were tethered and the wing motions were filmed by a high-speed camera. Then the wing actuation was reconstructed by tracing the pre-labeled markers on the wings and by calculating the three Euler angles of the wing root. The wing length L, chord width c, flapping frequency f, and the stroke amplitude Φ of the wings are listed in Table 5.
Table 5.
The characteristic geometric and kinematic data of the cicada forewing [47].
| Wing length (L) | Chord width (c) | Flapping frequency (f) | Stoke amplitude (Φ) |
|---|---|---|---|
| 3 cm | 1 cm | 25 Hz | 120° |
The finite-element model of the forewings (Fig. 14) consists of a homogeneous and isotropic plate and a network of the frames that are traced from the stationary image of the cicada wings. The frames are assumed to have a circular cross section and undergo bending and torsional deformations. Based on the experimental data, the bending stiffness of the 7 groups of frames, EI, ranges from 3.7 to 2750 g·cm3/s2, and their torsional stiffness, GJ, ranges from 3.0 to 1810 g·cm3/s2. Here G, I, and J are respectively the shear modulus, the area moment of inertia of the cross section, and the torsional constant of the cross section. The linear density distribution of the lead-edge spar is experimentally measured. For the rest of the spars, the linear density is derived from their bending stiffness by assuming that they have the same volume density as the leading-edge spar. The result ranges from 0.023 mg/cm for the minor spars to 1.33 mg/cm for the major spars. The bending stiffness of the plate is around 50 g·cm2/s2, and the surface density is ρsh = 0.4 mg/cm2. Poisson’s ratio is assumed to be νs = 0.25 for both the plate and the frames. The total mass of each forewing is 6.4 mg, including both the plate and frames. More mass is distributed toward the base area of the wing. The average surface density of the wing model is around ρsh = 2.6 mg/cm2 in the proximal half of the wing and around ρsh = 0.9 mg/cm2 in the distal half of the wing. This setup is consistent to the experimental measurement of the cicada wings [47].
Figure 14.
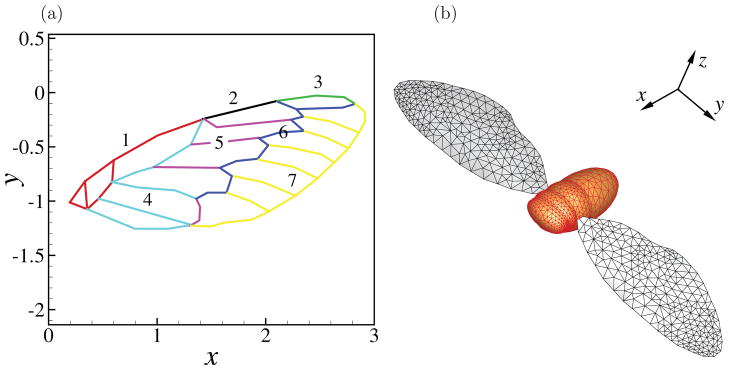
The study of a cicada with forewings only. (a) A finite-element model of the wing in which the spars are labeled as 7 groups of frame elements with different linear densities and bending stiffnesses. (b) The triangular mesh discretizing the insect body and wings.
In the simulation, the air density is set to be 1.2 kg/m3. Using the mass ratio defined by m* = ρsh/(ρfc) to represent the ratio between the wing inertia and the aerodynamic load [48], the distal half of the wing is around m* = 0.76. Thus, both the aerodynamic load and the inertial force are important contributing factors for the wing deformation. The Reynolds number based on the chord width of the wing and the mean tip velocity is set at Re = 300. The surface mesh in Fig. 14(b) for the cicada model consists of 2492 triangular elements for the body and 435 triangular elements for each wing. The computational domain is 13c × 12c × 11.5c. A nonuniform grid of 148 × 184 × 178 points is used. The minimum spacing is Δx = Δy = Δz = 0.05c. The time step is set at Δt = 0.004 s.
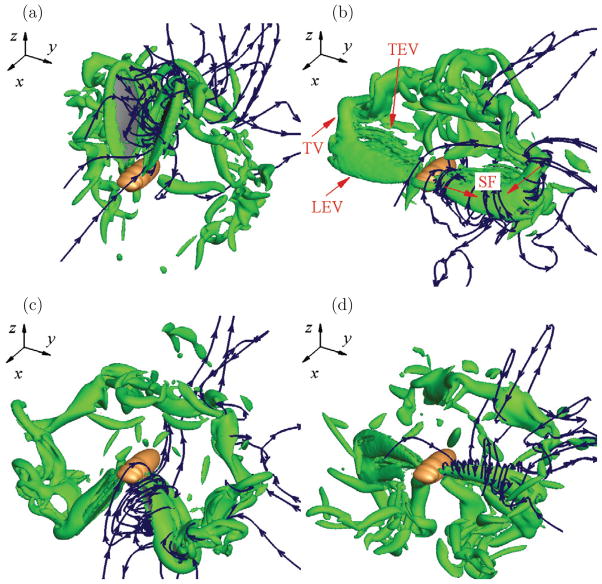
A sequence of the wing deformation patterns obtained from the present simulation is shown in Fig. 15, where the downstroke and upstroke frames are separated. The result shows that the wings experience spanwise and chordwise bending and also twisting deformations. These deformation characteristics are typical in insects [49] and are consistent with the observations from our high-speed videos. Fig. 16 shows the vortical structures and streamlines at four time instances within one flapping cycle: start of downstroke, mid-downstroke, end of downstroke, and mid-upstroke. The distinguished flow features that are associated with flapping wings, such as the leading-edge vortex, the trailing-edge vortex, the tip vortex, and the spanwise flow [50] can be identified from this figure. In future studies, we will investigate details of the unsteady aerodynamics and the effect of the wing flexibility in this insect model.
Figure 15.
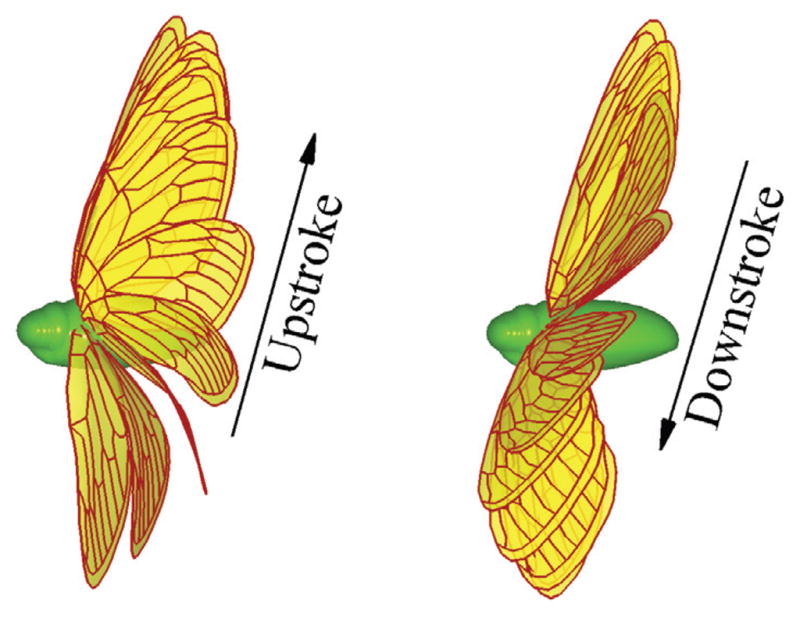
Deformation pattern of the cicada forewing from the present FSI simulation.
Figure 16.
Instantaneous vortical structures and streamlines produced by the cicada forewings at (a) start of down-stroke, (b) mid-downstroke, (c) end of downstroke, and (d) mid-upstroke. Indicated are the leading-edge vortex (LEV), the trailing-edge vortex (TEV), the tip vortex (TV), and the spanwise flow (SF).
5.2. Flow-induced vocal fold vibration
In the second example, we will show that the present numerical method has useful application in biomedical flows by performing a simulation of the flow-induced vocal fold vibration during voice production. There have been many numerical models for the FSI study of the vocal folds [51, 52]. However, few of them incorporate the nonlinear mechanics of the vocal fold tissue even though large deformations are common during phonation due to loud speech or posturing activities such as vocal fold abduction, adduction, and lengthening [53].
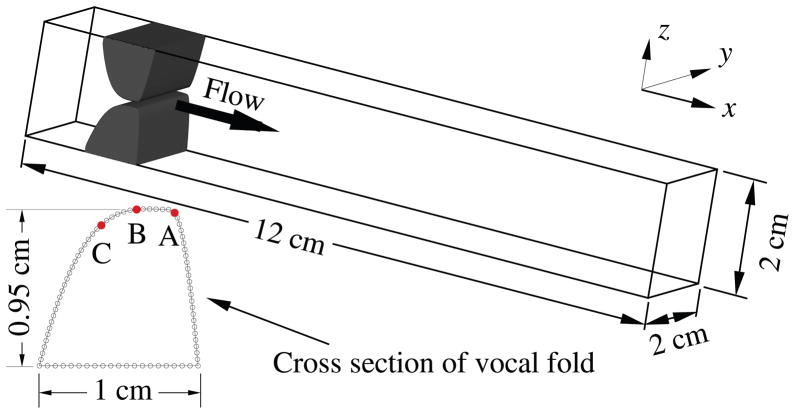
In the present work, we incorporate the rubber-like hyperelastic material described in Section 2 to model the tissue behavior of the vocal folds. The 3D model configuration is shown in Fig. 17, where a rectangular channel represents the larynx lumen and a pair of identical vocal folds are placed inside to obstruct the airflow. The dimensions of the channel and of the vocal folds are chosen based on the characteristic data of the human vocal folds [54] and are shown in the figure. The specific profile of the vocal fold is based on the approximation of Luo et al. [23]. The x-, y- and z-coordinates represent the vertical, anterior–posterior, and lateral directions, respectively, in terms of the human anatomy. The material parameters are chosen as follows. The vocal folds are homogeneous and isotropic, and their density is ρs = 1000 kg/m3. The elastic constants in Eq. (8) are α10 = 2 kPa and α01 = 0 kPa. The density of the fluid is ρf = 5 kg/m3 and the kinematic viscosity is ν = 2.5 × 10⁻⁵ m2/s. These parameters are chosen to produce significant deformations and a vibration frequency on the order of 100 Hz, i.e., a characteristic fundamental frequency in human phonation. The inlet velocity is assumed to be uniform and is 1 m/s. A nonuniform 152 × 72 × 96 Cartesian grid is employed for the flow domain with minimum grid spacings at Δx = Δz = 0.022 cm and Δy = 0.027 cm, and a total number of 2398 Hex20 elements are employed for each vocal fold. The time step is Δt = 2.5 × 10⁻⁴ cs (cs for centisecond) and this leads to about 4000 time steps for each vibration cycle. A simple kinematic constraint [23] on the vocal folds is applied to maintain a minimum gap of 0.1 cm between the two vocal folds.
Figure 17.
Geometrical configuration of the 3D FSI of the vocal folds, where the inset shows the cross-section profile of the vocal folds.
Sustained vibration of the vocal folds is achieved in the present simulation after about 3 cycles. The transition of the oscillation is shown in Fig. 18, where the xz-positions of the three selected points on the surface of the lower vocal fold (marked in Fig. 17) are plotted as functions of time. From this figure it can be seen that the fundamental vibration frequency of the vocal folds is around 96 Hz. Furthermore, the maximum vertical displacement of point A is greater than 0.2 cm, i.e., 20% of the size of the vocal fold. Such large deformations justify the need for a nonlinear model of the tissue.
Figure 18.

Time histories of the positions of the three points on the medial surface of the vocal folds, A, B, and C, as labeled in Fig. 17.
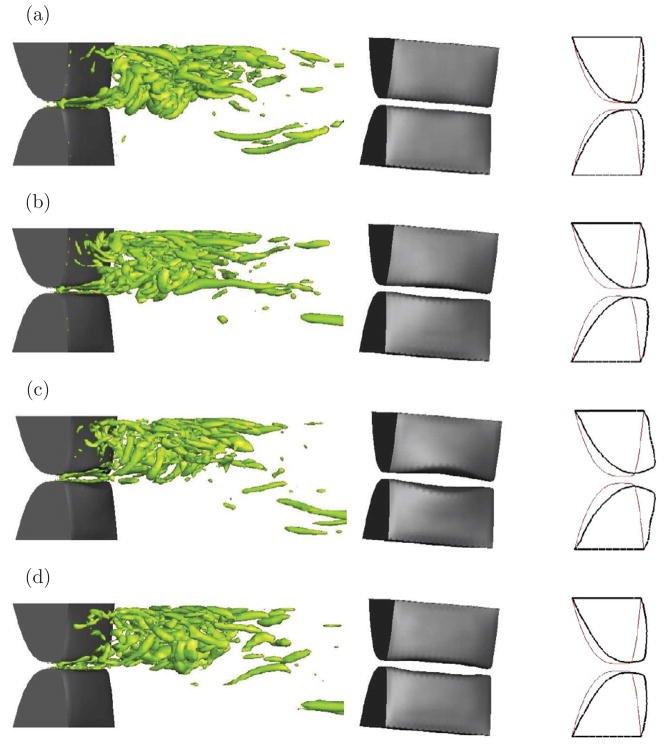
Fig. 19 shows several frames of the flow field, the deformed vocal folds, and the displacement in the middle xz-plane. Four time frames within a vibration cycle as labeled in Fig. 18 are shown. It can be seen that the flow is highly skewed to one side of the vocal fold. The gap between the two vocal folds, or glottis, forms an oval shape as viewed from the negative x-direction during the opening phase. In the cross section, the glottal gap forms a converging shape during vocal fold closure and a diverging shape during vocal fold opening. These features have been discussed in previous numerical studies [55, 56, 52]. There are also unique features that are captured by the present 3D simulation. For example, the flow field downstream the vocal folds displays complex 3D features and consists of many slender vortex structures. Wave propagation on the superior surface can be seen from an animation not only along the lateral directions, i.e., mucosal waves, but also along the longitudinal (anterior-posterior) direction. That is, the displacements of the vocal folds are not in-phase in the longitudinal direction. These features were previously seen either in the experiment using the vocal fold models [57, 58], or in the clinical observation of phonation [59], but have not been well captured by numerical simulations. Further details of the flow and vocal fold characteristics will be studied in the future.
Figure 19.
Instantaneous vortical structures (left column), 3D vocal fold deformation pattern (center column), and the displacement in the xz-plane at mid-span (right column) at four time instances that are labeled in Fig. 18.
6. Conclusion
We have presented a numerical approach, which is an enhanced method as compared to the existing similar methods, for the simulation of 3D fluid–structure interaction (FSI) problems that involve large deformations. In this method, the viscous incompressible Navier–Strokes equation is solved with a sharp-interface immersed-boundary method, and the solid dynamics is solved with a conventional finite-element method. Since both programs are in-house codes written in FORTRAN 90, the interface of coupling can be easily customized and the combined program has great portability (as opposed to some commercial packages).
Based on a fixed Cartesian grid, the immersed-boundary method can treat complex and moving boundaries with large displacements. On the other hand, the separate finite-element modules in the solid-mechanics solver utilize an unstructured Lagrangian mesh and can handle thin-walled structures as well as general three-dimensional bodies. The two solvers share the unstructured mesh on the exposed surface of the solid body. We use a strong-coupling approach for the FSI by iterating the fluid and solid solvers in a partitioned manner. Such a method leads to numerical stability and in addition, it preserves the modular form of each software so that the further development (e.g., inclusion of a different material behavior for the solid) of the software is straightforward.
Both geometric nonlinearity associated with large displacements and material nonlinearity associated with large strains of the solid body have been incorporated into the program. In addition to separate validation efforts of the fluid and solid solvers, we presented three case studies of FSI problems, specifically, vortex-induced vibration of a beam attached to a fixed cylinder, three-dimensional flow of flapping flag, and a flexible plate bent by the cross flow. The numerical results are successfully validated against previous experimental and simulation data. Since there is only a limited database for computational FSI that involves deformable bodies, the validated results in the present work can be used as benchmark cases for the future development of FSI methods.
Finally, we have applied the present method to two distinct practical problems. In one case, we modeled aerodynamics of the flexible wings of the cicada during tethered flight. A sophisticated finite-element model for the insect’s forewings incorporating the vein structure was combined with the three-dimensional unsteady flow, and the model can be used to address the effect of aeroelasticity of the insect wings. In the second case, we modeled the vocal fold tissue using a hyperelastic material and simulated the large-amplitude deformation of the vocal folds induced by the glottal flow. These examples show that the present numerical method is versatile and is well suited for modeling a range of biological FSI systems.
Figure 13.

Bending of a flexible plate in cross flow: instantaneous vortical structures (a) and streamlines (b) for the baseline setup.
Acknowledgments
This research was supported by the NSF (CBET-0954381 and CBET-1066962), and the NIDCD (No. 5R01DC011338). Computing resources were provided by the NSF XSEDE and Vanderbilt ACCRE.
Footnotes
Publisher's Disclaimer: This is a PDF file of an unedited manuscript that has been accepted for publication. As a service to our customers we are providing this early version of the manuscript. The manuscript will undergo copyediting, typesetting, and review of the resulting proof before it is published in its final citable form. Please note that during the production process errors may be discovered which could affect the content, and all legal disclaimers that apply to the journal pertain.
References
- 1.Hirt CW, Amsden AA, Cook JL. An arbitrary Lagrangian–Eulerian computing method for all flow speeds. J Comput Phys. 1974;14:227–253. [Google Scholar]
- 2.Ahn HT, Kallinderis Y. Strongly coupled flow/structure interactions with a geometrically conservative ALE scheme on general hybrid meshes. J Comput Phys. 2006;219:671–696. [Google Scholar]
- 3.Tezduyar TE, Behr M, Mittal S, Liou J. A new strategy for finite element computations involving moving boundaries and interfaces–The deforming-spatial-domain/space-time procedure: II. Computation of free-surface flows, two-liquid flows, and flows with drifting cylinders. Comput Meth Appl Mech Engrg. 1992;94:353–371. [Google Scholar]
- 4.Tezduyar TE, Sathe S, Keedy R, Stein K. Space–time finite element techniques for computation of fluid–structure interactions. Comput Meth Appl Mech Engrg. 2006;195:2002–2027. [Google Scholar]
- 5.Thompson JF, Soni BK, Weatherill NP. Handbook of Grid Generation. CRC; 1998. [Google Scholar]
- 6.Hermansson J, Hansbo P. A variable diffusion method for mesh smoothing. Commun Numer Meth Eng. 2003;19:897–908. [Google Scholar]
- 7.Nakata T, Liu H. A fluid–structure interaction model of insect flight with flexible wings. J Comput Phys. 2012;231:1822–1847. [Google Scholar]
- 8.Peskin CS. PhD thesis. Yeshiva University; 1972. Flow patterns around heart valves: a digital computer method for solving the equations of motion. [Google Scholar]
- 9.Tseng YH, Ferziger JH. A ghost-cell immersed boundary method for flow in complex geometry. J Comput Phys. 2003;192:593–623. [Google Scholar]
- 10.Yang JM, Balaras E. An embedded-boundary formulation for large-eddy simulation of turbulent flows interacting with moving boundaries. J Comput Phys. 2006;215:12–40. [Google Scholar]
- 11.Mittal R, Dong H, Bozkurttas M, Najjar FM, Vargas A, von Loebbecke A. A versatile sharp interface immersed boundary method for incompressible flows with complex boundaries. J Comput Phys. 2008;227:4825–4852. doi: 10.1016/j.jcp.2008.01.028. [DOI] [PMC free article] [PubMed] [Google Scholar]
- 12.Taira K, Colonius T. The immersed boundary method: a projection approach. J Comput Phys. 2007;225:2118–2137. [Google Scholar]
- 13.Mittal S, Singh S. Vortex–induced vibrations at subcritical. Re J Fluid Mech. 2005;534:185–194. [Google Scholar]
- 14.Griffith BE, Hornung RD, McQueen DM, Peskin CS. An adaptive, formally second order accurate version of the immersed boundary method. J Comput Phys. 2007;223:10–49. [Google Scholar]
- 15.Ghias R, Mittal R, Dong H. A sharp interface immersed boundary method for compressible viscous flows. J Comput Phy. 2007;225:528–553. [Google Scholar]
- 16.Luo H, Blyth MG, Pozrikidis C. Two-layer flow in a corrugated channel. J Eng Math. 2008;60:127–147. [Google Scholar]
- 17.Kim J, Kim D, Choi H. An immersed-boundary finite-volume method for simulations of flow in complex geometries. J Comput Phys. 2001;171:132–150. [Google Scholar]
- 18.Seo JH, Mittal R. A sharp-interface immersed boundary method with improved mass conservation and reduced spurious pressure oscillations. J Comput Phys. 2011;230:7347–7363. doi: 10.1016/j.jcp.2011.06.003. [DOI] [PMC free article] [PubMed] [Google Scholar]
- 19.Luo H, Dai H, Ferreira de Sousa P, Yin B. On the numerical oscillation of the direct-forcing immersed-boundary method for moving boundaries. Comput Fluids. 2012;56:61–76. [Google Scholar]
- 20.Peskin CS. The immersed boundary method. Acta Numerica. 2002;11:479–517. [Google Scholar]
- 21.De Tullio MD, Cristallo A, Balaras E, Verzicco R. Direct numerical simulation of the pulsatile flow through an aortic bileaflet mechanical heart valve. J Fluid Mech. 2009;622:259–290. [Google Scholar]
- 22.Ge L, Sotiropoulos F. A numerical method for solving the 3d unsteady incompressible navier–stokes equations in curvilinear domains with complex immersed boundaries. J Comput Phys. 2007;225:1782–1809. doi: 10.1016/j.jcp.2007.02.017. [DOI] [PMC free article] [PubMed] [Google Scholar]
- 23.Luo H, Mittal R, Zheng X, Bielamowicz S, Walsh R, Hahn J. An immersed-boundary method for flow–structure interaction in biological systems with application to phonation. J Comput Phys. 2008;227:9303–9332. doi: 10.1016/j.jcp.2008.05.001. [DOI] [PMC free article] [PubMed] [Google Scholar]
- 24.Huang WX, Sung HJ. Three-dimensional simulation of a flapping flag in a uniform flow. J Fluid Mech. 2010;653:301–336. [Google Scholar]
- 25.Bhardwaj R, Mittal R. Benchmarking a coupled immersed-boundary–finite-element solver for large-scale flow-induced deformation. AIAA J. 2012;50:1638–1642. [Google Scholar]
- 26.Luo H, Yin B, Dai H, Doyle JF. AIAA Paper 2010–556. 2010. A 3D computational study of the flow–structure interaction in flapping flight. [Google Scholar]
- 27.Turek S, Hron J. Proposal for numerical benchmarking of fluid–structure interaction between an elastic object and laminar incompressible flow. In: Bungartz HJ, Schäfer M, editors. Fluid-Structure Interaction: Modelling, Simulation, Optimisation. Springer–Verlag; Berlin Heidelberg, Netherlands: 2006. pp. 371–385. [Google Scholar]
- 28.Richter T. Goal-oriented error estimation for fluid–structure interaction problems. Comput Methods Appl Mech Engrg. 2012;223–224:28–42. [Google Scholar]
- 29.Doyle JF. Nonlinear analysis of thin-walled structures: statics, dynamics, and stability. Springer–Verlag; New York: 2001. [Google Scholar]
- 30.Doyle J. QED: static, dynamic, stability, and nonlinear analysis of solids and structures. 2008. Software manual, version 4.60. [Google Scholar]
- 31.Doyle JF. Guided Explorations of the Mechanics of Solids and Structures. Cambridge; New York: 2009. [Google Scholar]
- 32.Landau LD, Lifshitz EM. Theory of Elasticity. Pergamon; New York: 1986. [Google Scholar]
- 33.Levental I, Georges PC, Janmey PA. Soft biological materials and their impact on cell function. Soft Matter. 2007;3:299–306. doi: 10.1039/b610522j. [DOI] [PubMed] [Google Scholar]
- 34.Bathe KJ. Finite Element Procedures. Prentice-Hall; Englewood Cliffs, NJ: 1996. [Google Scholar]
- 35.Batoz JL, Bathe KJ, Ho LW. A study of three-node triangular plate bending elements. Int J Num Meth Eng. 1980;15:1771–1812. [Google Scholar]
- 36.Fernàndez M. Coupling schemes for incompressible fluid-structure interaction: implicit, semi-implicit and explicit. SeMA J. 2011;55:59–108. [Google Scholar]
- 37.Zheng X, Xue Q, Mittal R, Beilamowicz S. A coupled sharp-interface immersed-boundary-finite element method for flow–structure interaction with application to human phonation. J Biomech Eng. 2010;132:111003. doi: 10.1115/1.4002587. [DOI] [PMC free article] [PubMed] [Google Scholar]
- 38.Bathe KJ, Wilson EL. NONSAP–a nonliear structural analysis problem. Nucl Eng Des. 1974;29:266–293. [Google Scholar]
- 39.Mei R. Flow due to an oscillating sphere and an expression for unsteady drag on the sphere at finite Reynolds number. J Fluid Mech. 1994;270:133–174. [Google Scholar]
- 40.Shenoy AR, Kleinstreuer C. Flow over a thin circular disk at low to moderate Reynolds numbers. J Fluid Mech. 2008;605:253–262. [Google Scholar]
- 41.Roos FW, Willmarth WW. Some experimental results on sphere and disk drag. AIAA J. 1971;9:285–291. [Google Scholar]
- 42.Kim Y, Peskin CS. Penalty immersed boundary method for an elastic boundary with mass. Phys Fluids. 2007;19:053103. [Google Scholar]
- 43.Bathe KJ. Conserving energy and momentum in nonlinear dynamics: a simple implicit time integration scheme. Compt Struct. 2007;85:437–445. [Google Scholar]
- 44.Hunt JCR, Wray A, Moin P. Center for Turbulence Research Report CTR-S88. 1988. Eddies, stream, and convergence zones in turbulent flows. [Google Scholar]
- 45.Luhar M, Nepf HM. Flow-induced reconfiguration of buoyant and flexible aquatic vegetation. Limnol Oceanogr. 2011;56:2003–2017. [Google Scholar]
- 46.Zhu L, He G, Wang S, Miller L, Zhang X, You Q, Fang S. An immersed boundary method by the lattice Boltzmann approach in three dimensions with application. Comput Math Appl. 2011;61:3506–3518. [Google Scholar]
- 47.Luo H, Dai H, Mohd Adam Das SS, Song J, Doyle JF. AIAA Paper 2012–1212. 2012. Toward high-fidelity modeling of the fluid–structure interaction for insect wings. [Google Scholar]
- 48.Dai H, Luo H, Doyle JF. Dynamic pitching of an elastic rectangular wing in hovering motion. J Fluid Mech. 2012;693:473–499. [Google Scholar]
- 49.Wootton RJ. Functional morphology of insect wings. Ann Rev Entomol. 1992;37:113–140. [Google Scholar]
- 50.Shyy W, Aono H, Chimakurthi SK, Trizila P, Kang CK, Cesnik CES, Liu H. Recent progress in flapping wing aerodynamics and aeroelasticity. Progr Aerospace Sci. 2010;46:284–327. [Google Scholar]
- 51.Mittal R, Zheng X, Bhardwaj R, Seo JH, Xue Q, Bielamowicz S. Toward a simulation-based tool for the treatment of vocal fold paralysis. Front Physiol. 2011;2:19. doi: 10.3389/fphys.2011.00019. [DOI] [PMC free article] [PubMed] [Google Scholar]
- 52.Mittal R, Byron D, Plesniak M. Fluid dynamics of human phonation and speech. Annual Review of Fluid Mechanics. 2013;45:437–467. [Google Scholar]
- 53.Titze IR, Hunter EJ. A two-dimensional biomechanical model of vocal fold posturing. J Acoust Soc Am. 2007;121:2254–2260. doi: 10.1121/1.2697573. [DOI] [PMC free article] [PubMed] [Google Scholar]
- 54.Zemlin WR. Speech and Hearing Science: Anatomy and Physiology. 3. Prentice-Hall; NJ: 1988. [Google Scholar]
- 55.Alipour F, Berry DA, Titze IR. A finite-element model of vocal-fold vibration. J Acoust Soc Am. 2000;108:3303–3312. doi: 10.1121/1.1324678. [DOI] [PubMed] [Google Scholar]
- 56.Luo H, Mittal R, Bielamowicz SA. Analysis of flow-structure interaction in the larynx during phonation using an immersed-boundary method. J Acoust Soc Am. 2009;126:816–824. doi: 10.1121/1.3158942. [DOI] [PMC free article] [PubMed] [Google Scholar]
- 57.Baer T. Observation of vocal fold vibration: Measurement of excised larynges. In: Stevens KN, Hirano M, editors. Vocal Fold Physiology. University of Tokyo Press; Tokyo, Japan: 1981. pp. 119–133. [Google Scholar]
- 58.Murray PR, Thomson SL. Vibratory responses of synthetic, self-oscillating vocal fold models. J Acoust Soc Am. 2012;132:3428–3438. doi: 10.1121/1.4754551. [DOI] [PMC free article] [PubMed] [Google Scholar]
- 59.Rammage L, Morrison MD, Nichol H. Management of the voice and its disorders. 2. Singular; San Diego, CA: 2001. [Google Scholar]


