

Abstract
Nicotinamide adenine dinucleotide (NAD) is a metabolite essential for cell survival and generated de novo from tryptophan or recycled from nicotinamide (NAM) through the nicotinamide phosphoribosyltransferase (NAMPT)-dependent salvage pathway. Alternatively, nicotinic acid (NA) is metabolized to NAD through the nicotinic acid phosphoribosyltransferase domain containing 1 (NAPRT1)-dependent salvage pathway. Tumor cells are more reliant on the NAMPT salvage pathway making this enzyme an attractive therapeutic target. Moreover, the therapeutic index of NAMPT inhibitors may be increased by in NAPRT-deficient tumors by NA supplementation as normal tissues may regenerate NAD through NAPRT1. To confirm the latter, we tested novel NAMPT inhibitors, GNE-617 and GNE-618, in cell culture- and patient-derived tumor models. While NA did not protect NAPRT1-deficient tumor cell lines from NAMPT inhibition in vitro, it rescued efficacy of GNE-617 and GNE-618 in cell culture- and patient-derived tumor xenografts in vivo. NA co-treatment increased NAD and NAM levels in NAPRT1-deficient tumors to levels that sustained growth in vivo. Furthermore, NAM co-administration with GNE-617 led to increased tumor NAD levels and rescued in vivo efficacy as well. Importantly, tumor xenografts remained NAPRT1-deficient in the presence of NA, indicating that the NAPRT1-dependent pathway is not reactivated. Protection of NAPRT1-deficient tumors in vivo may be due to increased circulating levels of metabolites generated by mouse liver, in response to NA or through competitive reactivation of NAMPT by NAM. Our results have important implications for the development of NAMPT inhibitors when considering NA co-treatment as a rescue strategy.
Introduction
In recent years, it has become apparent that altered regulation of cellular metabolism is an important contributor to cancer cell growth, focusing attention on identifying critical nodes in metabolic pathways that can be exploited for therapeutic purposes. One pathway in particular, the generation of nicotinamide adenine dinucleotide (NAD), provides a key metabolite that is a critical co-factor and substrate for a wide range of metabolic enzymes including those required for the generation of ATP, lipids, and minimizing levels of reactive oxygen species [1].
There are two main processes that cells use to generate NAD: an elaborate de novo pathway catabolizing dietary tryptophan [2] or two salvage pathways that use nicotinic acid (NA) or nicotinamide (NAM) substrates, respectively, to regenerate NAD [3]. These pathways are dependent on the enzyme nicotinamide phosphoribosyltransferase (NAMPT), which catalyzes the condensation of phosphoribosyl pyrophosphate (PRPP) and NAM to generate nicotinamide mononucleotide, a key intermediate in the regeneration of NAD [3,4]. Given the high metabolic demands of proliferating cancer cells [5], it has been proposed that cancer cells are dependent on the salvage pathways to continually resupply sufficient levels of NAD required to support growth. Notably, one of the main NAD-using enzymes, poly(ADP-ribose) polymerase-1 (PARP-1), uses such high flux of NAD that, when inhibited, overall cellular NAD levels increase three- to four-fold [6]. Moreover, PARP-1 is frequently upregulated in cancer cells due to high levels of ongoing DNA damage [7], providing one important factor for why cancer cells need a continuous supply of NAD. Additionally, inhibition of NAMPT with a small molecule inhibitor effectively reduced tumor burden in vivo while having minimal impact on normal healthy tissue [8], again suggesting that tumor cells are more dependent on the salvage pathway than normal cells.
While cells can potentially use either the de novo or the NAMPT salvage pathway to generate NAD, a third route is available when dietary levels of NA are high. In this case, NA is converted to NAD through three enzymatic steps [9], with the rate-limiting enzyme in this cascade being nicotinic acid phosphoribosyltransferase domain containing 1 (NAPRT1). Importantly, some cancer cell lines and human tumors fail to express NAPRT1 and are thus unable to use this pathway [8,10,11]. This observation has led to the hypothesis that the therapeutic index of an NAMPT small molecule inhibitor could be increased by targeting tumors lacking NAPRT1 and co-treating patients with NA, thereby protecting normal tissue, but not tumor cells, from NAMPT inhibition by generating NAD through the NAPRT1-dependent pathway. Indeed, it has been demonstrated in vitro that NA cannot rescue the antiproliferative effects of the NAMPT inhibitor APO866 in NAPRT1-deficient tumor cell lines. Moreover, co-dosing NA with APO866 at a nontolerated dose in nontumor-bearing mice resulted in 100% survival and complete protection [8].
Development of two NAMPT inhibitors, APO866 (FK866) and GMX-1778, has been hindered by poor clinical responses in phase I clinical trials [12,13]. One approach to increase the clinical response rate is to identify NAPRT1-deficient tumors and co-administer NA with the NAMPT inhibitor. For this strategy to succeed, two important assumptions need to be met. First, NA should ameliorate the toxicities associated with systemic NAMPT inhibition. While both compounds that progressed into phase I clinical trials noted thrombocytopenia as a dose limiting toxicity, in vitro data have shown that purified human platelets can covert NA to NAD [14], suggesting that platelets express NAPRT1 and thus may be protected from the effects of NAMPT inhibition by supplementation with NA. Moreover, consistent with clinical data, dosing APO866 in mice above its maximum tolerated dose (MTD) also induced thrombocytopenia, but it was found that co-administration with NA rescued this effect [8]. Thus, it was proposed that a co-dosing strategy might allow an NAMPT inhibitor to be dosed higher than was achieved in these early clinical trials. The second assumption is that co-dosing NA does not reduce efficacy of an NAMPT inhibitor. In one report, it was shown that codosing NA reduced the antiproliferative effects of an efficacious and tolerated dose of APO866 in the A2780 (NAPRT1 deficient) ovarian cancer xenograft model in vivo [8]. In a second study [11], a trend toward reduced efficacy in the HT-1080 (NAPRT1 deficient) fibrosarcoma xenograft model was observed when NA was administered after treatment with GMX-1777 at its MTD. However, when NA was co-administered with a dose of GMX-1778 that is not tolerated in the absence of NA, it rescued lethality and did not affect efficacy [11]. Therefore, results from in vivo studies conducted with APO866 and GMX-1778 suggests that NA may reduce efficacy of an NAMPT inhibitor when administered at tolerated doses, although it is unclear from these two studies to what extent this may occur.
Accordingly, our primary aim was to evaluate the feasibility of a co-dosing strategy with NA across multiple xenograft models derived from tissue cell culture and, more clinically relevant, primary patient tumors that are deficient in NAPRT1. To accomplish this, we evaluated two novel, potent, and orally bioavailable NAMPT inhibitors, GNE-617 [15] and GNE-618 [16] that is structurally related to GNE-617. GNE-617 demonstrated robust efficacy in NAPRT1-deficient xenograft models representing fibrosarcoma (HT-1080), prostate (PC3), and pancreatic (MiaPaCa-2) cancers and inhibited NAD generation by greater than 98% in vivo. Surprisingly, we found that while co-administration of NA with GNE-617 did not effectively rescue tumor growth of these NAPRT1-deficient models in vitro it did in vivo in all models tested. In addition, NA also reversed in vivo efficacy of GNE-618 in patient-derived sarcoma and gastric tumor xenografts. Importantly, NA co-administration with GNE-617 modestly increased NAD and NAM levels in NAPRT1-deficient tumor xenografts to a level sufficiently high to maintain tumor growth even in the presence of NAMPT inhibition. We confirmed that NAD regeneration in tumor xenografts was not due to reexpression of NAPRT1, suggesting an in vivo mechanism that reroutes NA to a protection pathway independent of NAPRT1. Collectively, our data demonstrate that, unlike observations made in vitro in NAPRT1-deficient tumor cell lines, administration of NA with NAMPT inhibitors in vivo results in significant loss of efficacy.
Materials and Methods
Materials
GNE-617 (N-{[4-(3 5-difluorobenzenesulfonyl)phenyl]methyl} imidazo[1,2-a]pyridine-6-carboxamide) was synthesized by Hande Sciences (Suzhou, China) as previously described [15]. GNE-618 [N-(4-((3-(trifluoromethyl)phenyl)-sulfonyl)benzyl)-1H-pyrazolo [3,4-b]pyridine-5-carboxamide] was prepared by Medicilon, Inc (Shanghai, China) as previously described [16]. NA and NAM were purchased from Sigma-Aldrich (St Louis, MO).
Cell Lines and Viability Assays
Cell lines were obtained from the American Type Culture Collection (ATCC, Manassas, VA) or Deutsche Sammlung von Mikroorganismen und Zellkulturen (DSMZ, Braunschweig, Germany), expanded, and stored at early passage in a central cell bank. Lines were authenticated by short tandem repeat and genotyped on reexpansions. Cells were grown in RPMI 1640 supplemented with 10% FBS and 2 mM glutamine (Invitrogen, Grand Island, NY) and passaged no more than 20 times after thawing. To determine 50%effective concentration (EC50) values, cells were plated such that 30% to 40% confluency was achieved the next day. Nine-point dose titrations of GNE-617 were added directly to the cells, and after 96 hours, cell viability was quantified using CyQUANT Direct Cell Proliferation Assay (Invitrogen, Ltd) that measures nucleic acid in live cells, followed by CellTiter-Glo Luminescent Cell Viability Assay (Promega Corporation, Madison, WI) that measures ATP levels. EC50 values were calculated with a four-parameter fit using XLfit 5.1 (ID Business Solutions, Ltd, La Jolla, CA) or Prism 5.04 (GraphPad Software Inc, La Jolla, CA).
In Vivo Studies
All in vivo efficacy and imaging studies were approved by Genentech's Institutional Animal Care and Use Committee and adhere to the National Institutes of Health Guidelines for the Care and Use of Laboratory Animals. Tumor xenografts derived from cell lines were established by subcutaneous injection of cells in female NCR nude mice (Taconic Farms, Oxnard, CA). Patient-derived tumors from the SAO-737 sarcoma and STO-399 gastric models were implanted as fragments into female BALB/c SCID mice at CrownBio (Santa Cruz, CA) and Pharmaron (Beijing, China), respectively. Animals were distributed into treatment groups when tumors reached a mean volume of approximately 150 to 300 mm3. GNE-617, GNE-618, and GMX-1778 were formulated in polyethylene glycol (PEG) [PEG400/H2O/EtOH (60/30/10, vol/vol/vol)], while NA and NAM were dissolved in sterile water as vehicles. Test articles were administered by oral gavage. NA and NAM were administered twice daily, while NAMPT inhibitors were dosed either twice daily or once daily. NAMPT inhibitors were dosed before NA treatment. Tumor volumes were determined using digital calipers (Fred V. Fowler Company, Inc, Newton, MA) using the formula (L x W x W)/2. Curve fitting was applied to log2 transformed individual tumor volume data using a linear mixed-effects model with the R package nlme, version 3.1-97 in R v2.13.0 (R Development Core Team 2008; R Foundation for Statistical Computing, Vienna, Austria) [17]. Tumor growth inhibition (%TGI) was calculated as the percentage of the area under the fitted curve (AUC) for the respective drug-treated group per day relative to vehicle control animals, %TGI = 100 x (1 - (AUCtreatment/day)/(AUCvehicle/day)); 100% TGI was defined as tumor stasis, while values greater than 100% TGI indicate tumor regression. Fitted tumor volume data are reported as %TGI with 95% confidence intervals (CIs; lower and upper range). Tumor sizes and body weights were recorded twice weekly over the course of the study. Mice with tumor volumes ≥2000 mm3 or recorded body weight loss ≥20% from their weight at the start of treatment were promptly killed. An MTD was defined as the dose in which <20% body weight loss or no animal deaths were observed.
For fluoro-deoxyglucose (FDG)–PET imaging studies, PC3 prostate cancer xenografts were established by subcutaneous injection in the right flank of nude mice. When tumors reached a mean volume of 300 to 350 mm3, mice were imaged on Siemens Inveon MM PET/CT scanners (Siemens Preclinical Solutions, Knoxville, TN). Animals were lightly anesthetized for restraint with approximately 3.5% sevoflurane in air and body temperature maintained at 37°C by warm airflow under feedback control. Animals were fasted overnight with access to water and kept on warming pads before imaging. At scan onset, mice received an 18-FDG tracer dose of approximately 300 mCi by 60-second infusion through a lateral tail vein catheter. For every scan, blood glucose was measured pre-scan and post-scan with a Bayer Contour glucometer (Bayer Healthcare, Tarrytown, NY). Tumor volumes were measured daily over the treatment period as described above.
The imaging protocol consisted of a 30-minute dynamic acquisition immediately followed by an X-ray computed tomography (CT) used for anatomic reference and attenuation correction. List mode data were reconstructed into images with 128 x 128 in-plane voxels of 0.4 x 0.4 mm and 0.8 mm through-plane voxel thickness using vendor-provided iterative OP-MAP implementation with the beta hyperparameter set to 0.05. Regions of interest (ROIs) were drawn using Inveon Research Workplace (Siemens Preclinical Solutions) software. Tumor ROIs were defined as voxels exceeding a 50% threshold of the maximal tumor signal, thus excluding necrotic regions from the analysis. Mean signal values from drawn ROIs were used for Patlak-Gjedde analysis with liver ROIs used as a blood reference tissue [18]. Calculations were computed with statistical programming language R (R Development Core Team. R: A Language and Environment for Statistical Computing. The R Foundation for Statistical Computing, Vienna, Austria; R version 2.15.2, 2012). The metabolic tumor glucose uptake rate, MRGlucMAX, is calculated as K i * (mean blood glucose + K m), where K i is the tumor FDG uptake rate constant and K m is the half-saturation Michaelis-Menten constant set to 130 mg/dl [19].
Metabolite Analysis
Concentrations of NA, NAM, and NAD in mouse blood, cell line, tumor, and liver were determined by a nonvalidated liquid chromatography-tandem mass spectrometry (LC-MS/MS) assay. Due to different sample treatment requirements, NA and NAM use one set of sample, while NAD uses the second set of sample. For NA and NAM analyses, tumor and liver tissues were homogenized by using a FastPrep-24 bead beater (MP Biomedicals, Solon, OH). NA-13C6 and NAM-d4 were used as surrogate analytes for NA and NAM, respectively. All homogenate, blood, and cell line samples were crashed with acetonitrile, and the supernatant was injected into LC-MS/MS. For NAD analysis, all samples, including blood, cell line, tumor, and liver samples, were treated with PCA before extraction or homogenization. These treated homogenate, blood, and cell line samples were crashed with PCA again. The supernatant was diluted with 5 mM ammonium formate and injected into LC-MS/MS. Sample analysis was carried out with a Shimadzu Nexera (Columbia, MD) coupled to an API 5500 Q trap Mass Spectrometer (AB Sciex, Foster City, CA) equipped with a turbo electrospray interface in positive ionization mode. LC-MS/MS data were acquired using Analyst software (v1.42; AB Sciex).
Ex Vivo Clonogenic Growth Assay
Single cell suspensions of tumor xenografts that were grown in mice were generated by mechanical disassociation and disaggregation with an enzyme cocktail containing collagenase and DNase; 40,000 cells in 0.35% agar were layered on 0.5% agar in 24-well plates and cultured for 24 hours before treatment. Cells were treated with DMSO vehicle or escalating concentrations of GNE-618 for a period of 14 days with medium supplementation weekly. At the end of the treatment period, colonies were stained with calcein AM crystal violet dye and fixed in 10% neutral buffered formalin. The Acuman imaging analysis system was used to quantify colony numbers and size.
Western Blot Analysis
Tumor xenografts were treated with extraction buffer (Invitrogen, Camarillo, CA) containing 10 mM Tris (pH 7.4), 100 mM NaCl, 1 mM EDTA, 1 mM EGTA, 1 mM NaF, 20 mM Na4P2O7, 2 mM Na3VO4, 1% Triton X-100, 10% glycerol, 0.1% sodium dodecyl sulfate, and 0.5% deoxycholate supplemented with phosphatase and protease inhibitors (Sigma-Aldrich) and 1 mM PMSF to generate lysates. Protein concentration was determined from lysates using BCA protein assay (Pierce, Rockford, IL). Proteins were resolved by sodium dodecyl sulfate-polyacrylamide gel electrophoresis and transferred to nitrocellulose membranes (Invitrogen, Camarillo, CA). Membranes were hybridized with the following primary antibodies: NAMPT (MBL International Corporation, Woburn, MA) and NAPRT1 (Sigma-Aldrich). LI-COR Odyssey Infrared detection system (LICOR, Lincoln, NE) was used to detect and assess protein expression.
Statistical Analysis
For comparisons between treated groups, an unpaired t test assuming unequal variances was used; for three or more groups, a comparison to controls using Dunnett method was used. All summary statistics of the results are given as means ± SEM or SD.
Results
GNE-617 Is a Potent NAMPT Inhibitor that Reduces Cellular NAD and ATP and Promotes Cell Death in NAPRT1-Proficient and NAPRT1-Deficient Tumor Cells In Vitro
GNE-617 is potent and competitive NAMPT inhibitor with a biochemical half-maximal inhibitory concentration (IC50) of 5 nM [15]. We compared the ability of GNE-617 to deplete NAD levels in a set of cell lines that we confirmed to be NAPRT1-deficient [PC3 (prostate), HT-1080 (fibrosarcoma), MiaPaCa-2 (pancreatic)] and NAPRT1-proficient [HCT-116 (colorectal), Colo205 (colorectal), Calu6 (non-small cell lung cancer)] based on protein expression (Figure W1A). Treatment of NAPRT1-deficient and NAPRT1-proficient cell lines with GNE-617 resulted in a >95% reduction in NAD levels within 48 hours and associated EC50 values ranged from 0.54 to 4.69 nM (Table 1). We also evaluated the potency of GNE-617 with regard to reduction in ATP levels and cellular viability in these same cell lines. Regardless of NAPRT1 status, GNE-617 reduced ATP levels and cellular viability with EC50 values from 2.16 to 9.35 nM and 1.82 to 5.98 nM, respectively (Table 1).
Table 1.
Cellular Potency of GNE-617 in NAPRT1-Proficient and NAPRT1-Deficient Tumor Cell Lines.
| Tumor Model | NAPRT1 Status | Cellular EC50 | ||
| NAD | ATP | Viability | ||
| HCT-116 | Proficient | 1.03 ± 0.10 | 2.16 ± 0.83 | 1.82 ± 0.64 |
| Colo205 | Proficient | 0.54 ± 0.01 | 5.31 ± 1.93 | 4.44 ± 1.29 |
| Calu6 | Proficient | 1.99 ± 0.04 | 3.90 ± 1.12 | 4.52 ± 1.77 |
| PC3 | Deficient | 1.06 ± 0.30 | 3.46 ± 2.05 | 2.98 ± 2.17 |
| HT-1080 | Deficient | 1.05 ± 0.10 | 2.49 ± 1.71 | 2.58 ± 1.50 |
| MiaPaCa-2 | Deficient | 4.69 ± 0.20 | 9.35 ± 4.86 | 5.98 ± 2.17 |
Tumor cell lines were treated with a nine-point dose titration of GNE-617 for 48 hours, and NAD levels were measured by LC-MS/MS as described in Materials and Methods section. Values reported are effective concentrations that cause a 50% reduction (EC50) in NAD, ATP, or cell viability ± SDs.
GNE-617 Induces Robust Antitumor Responses and Reduces NAD Levels in NAPRT1-Proficient and NAPRT1-Deficient Xenograft Models In Vivo
Given the potency of GNE-617 in vitro, we determined its efficacy in xenograft models that were NAPRT1-proficient (HCT-116) and NAPRT1-deficient (MiaPaCa-2, PC3, and HT-1080; Figure 1). GNE-617 was highly efficacious and induced tumor regression within 5 days of twice daily treatment at MTDs of 10 to 15 mg/kg (20 to 30 mg/kg total dose/day) in the HCT-116 [%TGI at 15 mg/kg, twice daily = 87 (95% CI = 78, 94)], MiaPaCa-2 [%TGI at 10 mg/kg, twice daily = 91 (95% CI = 87, 95)], PC3 [%TGI at 15 mg/kg, twice daily = 168 (95% CI = 122, 476)], and HT-1080 [%TGI at 15 mg/kg, twice daily = 143 (95% CI = 107, 438)] xenograft models (Figures 1, A–D, and W2). Efficacy of GNE-617 increased in a dose-dependent fashion and confirmed on a once daily schedule at doses that were well tolerated in the PC3 [%TGI, once daily at 5 mg/kg = 2 (95% CI = 0.6, 3.0); 7.5 mg/kg = 58 (95% CI = -118,115); 10 mg/kg, once daily = 137 (95% CI = 111, 215); 20 mg/kg = 147 (95% CI = 118, 242); 30 mg/kg = 144 (95% CI = 118, 232)] and HT-1080 [%TGI, once daily at 5 mg/kg = 8 (95% CI = 1.0, 15.0); 7.5 mg/kg = 31 (95% CI = -176, 83); 10 mg/kg, once daily = 66 (95% CI = -89, 107); 20 mg/kg = 138 (95% CI = 113, 228); 30 mg/kg = 143 (95% CI = 112, 252)] xenograft models (Figures 1, E and F, and W2). Notably, increased tumor regressions were observed within 7 days of daily administration of GNE-617, which were maintained after dosing concluded on day 7 (Figure 1, E and F). Regardless of dosing schedule (i.e., twice daily vs once daily), robust efficacy, defined by tumor regressions, was observed within 5 to 7 days of treatment in vivo when a total MTD of 20 to 30 mg/kg GNE-617 was administered.
Figure 1.

GNE-617 is efficacious in NAPRT1-proficient and NAPRT1-deficient tumor xenograft models. (A–D) NAPRT1-proficient (A, HCT-116) and NAPRT1-deficient (B, MiaPaCa-2; C, PC3; D, HT-1080) xenograft models were treated (Rx) orally with control (vehicle) or GNE-617 at the doses indicated for 5 days (twice daily). PC3 (E) and HT-1080 (F) tumor xenografts were treated orally with GNE-617 at the doses indicated for 7 days (once daily).
The pharmacodynamics of GNE-617 was assessed within 24 hours after single dose treatment. A significant decrease in tumor NAD levels was observed within 12 hours of treatment, and by 24 hours, NAD was reduced to 85% of control levels in PC3 or HT-1080 tumors (Figure 2, A and B). In the HT-1080 xenograft model, the reduction of NAD by GNE-617 was dose-dependent with greater than 98% inhibition observed after five daily doses of 20 or 30 mg/kg, doses that corresponded with maximum efficacy (Figures 1F and 2C). Interestingly, 5 and 7.5 mg/kg of GNE-617 significantly reduced NAD levels by 80% after 5 days of treatment but did not lead to tumor growth inhibition (Figures 1F and 2C). Moreover, maximum antitumor activity required sustained inhibition of NAMPT because >95%reduction of tumor NAD levels was achieved within 3 days of GNE-617 treatment and maintained over a period of 7 days, whereas tumor regressions were observed only after 5 days of dosing (Figure 2D). The latter observation suggests that maximum efficacy of GNE-617 is dependent on a sustained reduction of NAD by greater than 95% for at least 5 days.
Figure 2.
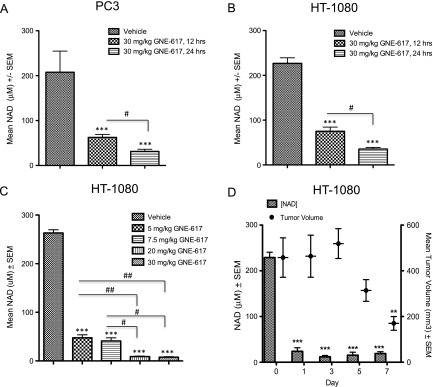
GNE-617 reduces tumor NAD levels in NAPRT1-deficient tumor xenograft models. PC3 (A) and HT-1080 (B) xenografts were treated orally with a single dose of GNE-617 (30 mg/kg), and tumors were harvested at 12 and 24 hours post-dose. NAD levels were measured by LC-MS/MS as described in Materials and Methods section. (C) HT-1080 xenografts were treated orally for 5 days with GNE-617 at the doses indicated, and tumors were harvested 1 hour following the final dose for NAD measurements by LC-MS/MS. (D) HT-1080 xenografts were treated orally with 30 mg/kg GNE-617, and tumors were harvested 1 hour after the final dose on days 1, 3, 5, and 7 for NAD measurement by LC-MS/MS. Tumor volumes were measured at the days indicated as described in Materials and Methods section. Comparisons between treated groups and control (vehicle) were determined by Dunnett method: **P < .001 and ***P < .0001. Comparisons between treatment groups were performed using unpaired t test assuming unequal variances: #P < .01 and ##P < .001.
Co-administration of NA with NAMPT Inhibitors Protects NAPRT1-Deficient Tumors In Vivo
To evaluate the utility of exogenous NA administration to protect normal tissues, we co-administered NA with GNE-617 in NAPRT1-deficient and NAPRT1-proficient tumor cells in vitro and in vivo. NA protected NAPRT1-proficient HCT-116 cells from NAMPT inhibition (0.2 µM GNE-617) in a dose-dependent manner in vitro (NA EC50 = 0.41 µM; Figure 3A). A similar level of protection was also observed in vivo, as co-administration of NA (100 mg/kg, twice daily) rescued the antitumor effects of GNE-617 when dosed at the MTD in the HCT-116 xenograft model [%TGI without NA = 119 (95% CI = 101, 147); %TGI with NA = 4 (95% CI = 0.1, 44); Figure 3B]. As PC3 tumor cells lack NAPRT1, co-dosing of NA (100 mg/kg, twice daily) did not prevent the antiproliferative effects of NAMPT inhibition in the presence of GNE-617 in vitro (NA EC50 > 100 µM; Figure 3C) but surprisingly did when grown as xenografts in vivo [%TGI without NA = 119 (95% CI = 101, 147); %TGI with NA = 4 (95% CI = 0.1, 44); Figure 3D]. Moreover, co-administration of a lower dose of NA (30 mg/kg, twice daily) that, in mouse blood, mimics the human exposure of a prescribed dose of 2000 mg of niacin [20] also rescued efficacy of GNE-617 in the PC3 xenograft model [%TGI without NA = 119 (95% CI = 101, 147); %TGI with NA = 6 (95% CI = -0.1, 22); Figure 3D]. Additionally, continuous once daily dosing of GNE-617 for 21 days did not overcome the protective effects of NA in the PC3 xenograft model [%TGI without NA = 93 (95% CI = 86, 97); %TGI with NA = 12 (lower, upper CI = -20, 39); Figure W3A]. Importantly, the loss of efficacy by NA co-treatment is not unique to GNE-617, as a similar loss of efficacy was observed with the structurally distinct NAMPT inhibitor, GMX-1778 (8) [%TGI without NA = 138 (95% CI = 118, 200); %TGI with NA = 7 (95% CI = 1, 32); Figure W3B].
Figure 3.

Co-administration of NA with GNE-617 protects NAPRT1-deficient tumors in vivo. NAPRT1-proficient (A, HCT-1116) and NAPRT1-deficient (C, PC3; E, MiaPaCa-2; G, HT-1080) tumor cell lines were exposed to 0.2 µM GNE-617 and a dose range of NA (0–100 µM) for 96 hours, and cell viability was measured by the CyQUANT assay as described in Materials and Methods section. NAPRT1-proficient (B, HCT-116) and NAPRT1-deficient (D, PC3; F, MiaPaCa-2; H, HT-1080) tumor xenograft models were treated (Rx) orally with control (vehicle), NA (100 and 30 mg/kg, twice daily), GNE-617, or a combination of both agents at the doses indicated for 5 days. GNE-617 was administered twice daily in the HCT-116 and PC3 xenograft models and once daily in the HT-1080 and MiaPaCa-2 xenograft models.
To confirm the protective effects of NA observed in NAPRT1-deficient PC3 tumor cells, we examined two additional NAPRT1-deficient cell lines (HT-1080 and MiaPaCa-2) and found that these cell lines remained sensitive to GNE-617 in the presence of NA in vitro (NA EC50 > 100 µM; Figure 3, E and G). However, NA completely prevented GNE-617-induced TGI in vivo in the MiaPaCa-2 [%TGI without NA = 77 (95% CI = 41, 96); %TGI with NA = 2 (95% CI = 0.05, 37); Figure 3F]. Notably, NA alone induced tumor growth delay but in the HT-1080 model only [%TGI of NA = 60 (95% CI = 14, 141)]. However, co-administration of GNE-617 with NA rescued TGI to levels observed with NA alone [%TGI without NA = 139 (95% CI = 107, 674); %TGI with NA = 69 (95% CI = 15, 147); %TGI of NA = 60 (95% CI = 14, 141); Figure 3H]. Interestingly, lower doses of NA (30 mg/kg, twice daily) also conferred protection against GNE-617 in the MiaPaCa-2 model [%TGI without NA = 77 (95% CI = 41, 96); %TGI with NA = 4 (95% CI = -5, 17); Figure 3F] but not in the HT-1080 model [%TGI without NA = 139 (95% CI = 41, 96); %TGI with NA = 115 (95% CI = 8, 301); %TGI of NA only = 60; Figure 3H].
To translate our findings in these cell culture-derived xenograft models, we also evaluated the ability of NA to rescue NAMPT inhibition in vivo in patient-derived xenograft models that are more representative of the heterogeneity observed in patient tumors. We initially confirmed that NAPRT1 was not expressed in sarcoma (SAO-737) and gastric cancer (STO-799) primary patient tumors (Figure W1B). For in vivo efficacy studies using these patient-derived xenograft models, we also tested another novel and orally bioavailable NAMPT inhibitor, GNE-618 that is structurally related to GNE-617 [16]. Additionally, we recently demonstrated that GNE-618 is efficacious in cell culture- and patient-derived xenograft models that are NAPRT1 proficient and, as a result, is rescued when NA is co-administered in vivo [21]. We were able to establish growth of the SAO-737 sarcoma model ex vivo and determined that it was indeed sensitive to GNE-618 (cell viability EC50 = 3.7 nM) and comparable to the potency of GNE-617 in cell-cultured tumor cell lines (Figure 4A). Similar to our in vitro observations, NA was unable to rescue SAO-737 tumors from the antiproliferative effects of GNE-618 ex vivo (Figure 4B). However, in vivo, NA completely protected the patient-derived sarcoma tumor xenograft model from the antitumor effects of GNE-618 when dosed at its MTD of 100 mg/kg [%TGI without NA = 75 (95% CI = 21, 97); %TGI with NA = 13 (95% CI = -187, 51); Figure 4C]. Moreover, the loss of efficacy of GNE-618 with NA co-treatment was also observed in the STO-399 gastric cancer xenograft model [%TGI without NA = 95 (95% CI = 82, 104); %TGI with NA = 11 (95% CI = -40, 44); Figure 4D]. Thus, co-treatment of NA with three different NAMPT inhibitors results in loss of in vivo efficacy in both cell culture- and patient-derived xenograft models that are NAPRT1 deficient.
Figure 4.

NA rescues in vivo efficacy of GNE-618 in primary patient-derived tumor xenograft models. (A) SAO-737 sarcoma patient-derived tumor explants were grown ex vivo as described in Materials and Methods section and treated with DMSO vehicle control or escalating doses of GNE-618 as shown for 14 consecutive days. Following treatment, cells were stained for viability by calcein AM crystal violet dye and colony number was enumerated microscopically. (B) SAO-737 sarcoma patient-derived tumor explants were treated with DMSO vehicle control, 10 µM NA, 37 nM GNE-618, or the combination of GNE-618 and NA for 14 consecutive days. Following treatment, cells were stained with calcein AM crystal violet dye to determine viability. (C and D) SAO-737 sarcoma (C) and STO-399 gastric (D) patient-derived tumor xenografts were treated (Rx) orally with vehicle control, GNE-618 daily, NA (twice daily), or the combination of GNE-618 and NA for a period of 5 days.
To pharmacodynamically confirm our findings that NA can rescue TGI induced by GNE-617 in vivo, we employed FDG-PET imaging to probe tumor growth in the presence and absence of NA. PC3 tumor xenografts were imaged for FDG tracer uptake on day 0 (pretreatment baseline) and 4 days after daily treatment with GNE-617 alone or in combination with NA. A trend toward TGI was observed at day 4 as previously observed (Figures 1E and 5) with a concomitant decrease in MRGlucMAX by 60% for GNE-617 alone compared with the control group (Figure 5, A, B, and D). Co-treatment with NA returned the GNE-617-inhibited glucose metabolic rate to nontreated levels (Figure 5, B and D). Modest hyperglycemic effects that were observed in mouse blood with GNE-617 dosing as a result of decreased glucose uptake were also reversed when NA was administered in parallel (Figure 5C).
Figure 5.
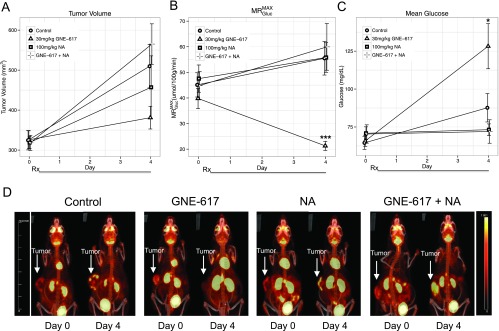
GNE-617 decreases FDG uptake in PC3 tumor xenografts, which is reversed by NA co-treatment. (A–C) PC3 tumor xenografts grown in the hind flank were treated (Rx) orally with vehicle (control), GNE-617, NA, or the combination of NA and GNE-617 for 4 days at the doses indicated. Animals were dosed with 18-FDG tracer as described in Materials and Methods section. Changes in tumor volume (A), FDG uptake (B, MRGlucMAX), and mean blood glucose levels (C) were measured as described in Materials and Methods section. (D) Maximum image projections of FDG-PET uptake in tumor tissue from representative animals at day 0 (pre-treatment baseline) and day 4 across the four treatment groups as shown. Arrows designate location of tumors. Colorimetric scale denotes degree of FDG-PET uptake with upper limits defined in the yellow range. Comparisons between treated groups and vehicle control were performed by Dunnett method: *P < .05, ***P < .0005.
NA Co-administration with GNE-617 in NAPRT1-Deficient Tumors Increases Tumor NAD and NAM Levels In Vivo
Given that NAD is essential for tumor cell growth and metabolism, the lack of efficacy when GNE-617 was co-dosed with NA in NAPRT1-deficient xenograft models suggested that NAD levels remain high in tumors. To test this hypothesis, we evaluated NAD levels in tumor xenografts after 5 days of NA (100 and 30 mg/kg) co-treatment with GNE-617 in the HT-1080, MiaPaCa-2, and PC3 models. Consistent with our previous results, we confirmed that GNE-617 treatment resulted in a 98% reduction in tumor NAD levels in all three models when compared to vehicle control levels after 5 days of treatment (Figure 6, A–C). Interestingly, compared to GNE-617 treatment alone, tumor NAD levels increased significantly by 15% to 25% in the MiaPaCa-2, PC3, and HT-1080 xenograft models when NA (100 mg/kg) was co-administered with GNE-617 (P < .01 vs GNE-617 treatment alone; Figure 6, A–C). Notably, even though co-dosing NA with GNE-617 increased NAD levels, tumor NAD levels were still significantly reduced by 80% (P < .0001 vs vehicle control; Figure 6, A–C). Similar observations were made with NA dosed at 30 mg/kg in the PC3 and MiaPaCa-2 xenograft models (Figure 6, A and B). However, NA at 30 mg/kg did not significantly increase tumor NAD levels in the HT-1080 xenograft model when compared to GNE-617 treatment alone (Figure 6C). The latter observation relates to the inability of this dose of NA to rescue the efficacy of GNE-617 in the HT-1080 xenograft model and, remarkably, suggests that a reduction of tumor NAD levels by 75% to 85% is sufficient to maintain robust in vivo growth even in the presence of NAMPT inhibition.
Figure 6.

NA co-administration with GNE-617 in NAPRT1-deficient tumors increases tumor NAD and NAM levels in vivo. MiaPaCa-2 (A), PC3 (B), and HT-1080 (C) tumor xenografts (n = 5 per model) were treated with vehicle (control), NA (100 and 30 mg/kg, twice daily), GNE-617 (once daily), or the combination of both agents at the doses shown for 5 days, and tumors were harvested 1 hour following the final dose for measurement of NAD levels by LC-MS/MS as described in Materials and Methods section. MiaPaCa-2 (D), PC3 (E), and HT-1080 (F) tumor xenografts (n = 5 per group) were treated with vehicle (control), NA (100 and 30 mg/kg, twice daily), GNE-617, or the combination of both agents for 5 days, and tumors were harvested 1 hour following the final dose for measurement of NAM levels by LC-MS/MS as described in Materials and Methods section. Comparisons between treated groups and control (vehicle) were determined by Dunnett method: ***P < .0001. Comparisons between treatment groups were performed using unpaired t test assuming unequal variances: #P < .01.
Given that NAD is directly converted to NAM by NAD-using enzymes such as PARP, we next examined if NA (100 and 30 mg/kg) also resulted in an increase in tumor NAM levels in NAPRT1-deficient models. GNE-617 treatment alone significantly reduced NAM level in MiaPaCa-2, PC3, and HT-1080 tumors by ∼98% relative to vehicle-treated animals consistent with a comparable decrease in NAD levels in these models (Figure 6, D–F). Notably, compared to GNE-617 alone, co-treatment of GNE-617 with NA in these models also increased tumor NAM levels to ∼25% of vehicle control levels (Figure 6, D–F). Again, similar observations were made with NA dosed at 30 mg/kg in the PC3 and MiaPaCa-2 xenograft models but not in the HT-1080 xenograft model (Figure 6, D–F).
We next examined the possibility that generation of NAD, and subsequently NAM, in NAPRT1-deficient tumors was due to NAPRT1 reexpression in tumor xenografts. We did not observe reexpression of NAPRT1 in either the PC3, HT-1080, or MiaPaCa-2 xenograft models after 5 days of treatment with NA, GNE-617, or a combination of both agents (Figure 7, A–C), suggesting that NAPRT1 reexpression may not be driving NAD generation in vivo in response to NA. An alternative hypothesis is that NAD or NAM may be provided exogenously by highly metabolic normal tissue such as the liver. We did observe a significant increase in liver NAD and NAM levels after treatment with NA alone or when co-administered with GNE-617 in NAPRT1-deficient tumor-bearing animals (P < .0001 vs vehicle treatment; Figure 8, A and B). In addition, compared to GNE-617 treatment alone, we also observed that NAD and NAM levels significantly increased in mouse blood after co-treatment with NA (P < .01 for NAD and P < .001 for NAM vs GNE-617 treatment only; Figure 8, C and D). Thus, normal metabolic tissue, such as liver, may produce metabolites such as NAD and NAM that can subsequently be provided to NAPRT1-deficient tumors exogenously, thereby bypassing the requirement for conversion of NA by NAPRT1.
Figure 7.

Expression of NAMPT and NAPRT1 in tumor xenografts after treatment with NA. NAMPT and NAPRT1 protein expression was determined in PC3 (A), HT-1080 (B), and MiaPaCa-2 (C) tumor xenografts after 5 days of treatment with vehicle control, 100 mg/kg NA, 30 mg/kg GNE-617, or the combination of both agents by Western blot analysis as described in Materials and Methods section (n = 4 animals per group). Colo205 tumor cell lysates were included as positive controls for NAPRT1 expression.
Figure 8.

NA increases liver and blood NAD and NAM levels in vivo. PC3 tumor-bearing xenografts (n = 5 per group) were treated with vehicle, NA, GNE-617 or the combination of both agents for 5 days with the indicated doses and mouse liver (A and B) and blood (C and D) collected 1 hour following the final dose for measurement of NAD (A and C) and NAM (B and D) levels by LC-MS/MS as described in Materials and Methods section. Comparisons between NA-treated groups and control (vehicle) was determined by Dunnett method: ***P < .0001. Comparisons between treatment groups were performed using unpaired t test assuming unequal variances: #P < .01, ##P < .001.
NAM Can Rescue Antitumor Effects of NAMPT Inhibition In Vitro and In Vivo
Because NAM is the natural substrate of NAMPT, high levels of NAM can affect the ability of NAMPT inhibitors to block enzymatic activity [15]. Given that we observed an increase in tumor NAM levels with NA co-administration, we reasoned that protection from NAMPT inhibition might be provided by the substrate NAM itself, which may compete with GNE-617 for binding to NAMPT. We initially determined if NAM could protect NAPRT1-deficient cells in vitro from NAMPT inhibition by examining NAD levels in PC3 and MiaPaCa-2 cells that were treated with GNE-617 in the presence or absence of NAM. Surprisingly, NAM modestly increased NAD levels in the presence of GNE-617 in both cell lines to ∼15% relative to GNE-617 treatment alone in vitro (Figure 9, A and B). In contrast, NA alone was unable to increase NAD levels in the presence of GNE-617 confirming that these tumor cell lines were indeed NAPRT1-deficient (Figure 9, A and B). We also compared the ability of NAM to rescue cell viability in vitro. While GNE-617 significantly reduced ATP levels and viability in both PC3 and MiaPaCa-2 cell lines, co-administration of NAM, but not NA, with GNE-617 remarkably protected cells from significant depletion of ATP and loss of viability (Figure 9, C–F). Collectively, our in vitro and in vivo results indicate that small increases in tumor NAD levels induced by NAM were sufficient to protect against the antitumor effects of GNE-617. Remarkably, tumor growth can be maintained even when tumor NAD levels are reduced by ∼85% relative to untreated animals.
Figure 9.

NAM co-treatment increases NAD levels and rescues anti-proliferative effects of NAMPT inhibition in vitro. PC3 and MiaPaCa-2 tumor cell lines were exposed to GNE-617 (0.2 µM), NA (10 µM), and/or NAM (2000 µM). (A and B) NAD levels were determined after 48 hours of treatment and measured by LC-MS/MS as described in Materials and Methods section. ATP levels (C and D) and cell viability (E and F) were assessed by CellTiter-Glo and CyQUANT assays, respectively, after 96 hours of treatment as described in Materials and Methods section. Comparisons between treatment groups were performed using unpaired t test assuming unequal variances: ***P < .0001.
To corroborate the rescuability of NAM in vitro, NAM was codosed with GNE-617 for 5 consecutive days in the PC3 xenograft model. Consistent with our in vitro results, NAM was able to rescue the antitumor effects of GNE-617 in vivo [%TGI without NAM = 130 (95% CI = 110, 221); %TGI with NAM = 42 (95% CI = -198, 93); %TGI of NAM only = 39 (95% CI = -195, 91); Figure 10A]. As expected for a model that is dependent only on NAMPT for NAD production, administration of NAM alone in vivo resulted in a significant increase in tumor NAD and NAM levels relative to vehicle control-treated animals (P < .0001; Figure 10, B and C). Similar to NA, NAM co-treatment with GNE-617 also resulted in a modest but significant increase in tumor NAD and NAM levels when compared to GNE-617 alone (P < .0001 for tumor NAD and P < .001 for tumor NAM; Figure 10, B and C). We confirmed that circulating levels of NAM in mouse blood remained significantly elevated on NAM co-administration when compared to tumor-bearing animals treated with GNE-617 alone (P < .0001 vs GNE-617 treatment only; Figure 10D). Thus, similar to NA, NAM can rescue TGI induced by GNE-617 and increase tumor NAD to levels that are sufficient to maintain growth in vivo.
Discussion
NAD serves as a co-enzyme for metabolic pathways that generate ATP as well as contribute to DNA repair mechanisms and is therefore critical for tumor cell survival. Given the high metabolic and bioenergetic demands of proliferating cancer cells [5], it has been proposed that cancer cells are dependent on NAD salvage pathways driven by the rate-limiting enzymes NAMPT and NAPRT1, as opposed to de novo synthesis, to continually supply sufficient levels of NAD required to support growth and survival. However, tumors that are deficient in NAPRT1 are unable to use one of the two salvage pathways making them more dependent on NAMPT for NAD generation and thus survival [8,10,11]. Normal cells, on the other hand, can use NA to generate NAD through the NAPRT1-proficient salvage pathway, thereby mitigating the effects of NAMPT inhibition [9]. Thus, it has been proposed that a wider therapeutic index may be achieved when NA is co-administered with NAMPT inhibitors. However, NA co-treatment should not compromise the efficacy of NAMPT inhibitors in tumors that remain NAPRT1 deficient. Therefore, the primary goal of our study was to confirm whether supplementation with NA can indeed preserve efficacy of two novel NAMPT inhibitors (GNE-617 and GNE-618) across multiple xenograft models derived from tumor cells as well as primary patient samples that were NAPRT1 deficient.
In vitro sensitivity to GNE-617 translated into robust efficacy characterized by tumor regressions in the corresponding xenograft models. We also observed that greater than 95% reduction of tumor NAD levels occurred within 3 days of GNE-617 treatment in vivo, which preceded the induction of tumor regressions, suggesting that sustained reduction of NAD is required for maximum efficacy. The kinetics of NAD reduction as it relates to tumor cell viability has not been demonstrated before in vivo but is consistent with in vitro observations made with continuous exposure of GMX-1778 in the IM-9 multiple myeloma cell line in which maximum NAD reduction occurred 16 and 52 hours before complete reduction of ATP production and cell lysis, respectively [11]. Similar findings were recapitulated with GNE-617 treatment in PC3 cells in which >90% NAD depletion occurred with 24 hours, >90% reduction in ATP levels by 52 hours, followed by cell death after ∼60 hours (DelNagro and O'Brien, unpublished observations).
Similar to other NAMPT inhibitors such as AP0866 and GMX-1778, we confirmed that in vitro NA does not inhibit the anti-growth effects of GNE-617 in tumor cell lines that do not express NAPRT1. Remarkably, however, we made the unexpected finding that three NAPRT1-deficient xenograft models were protected from NAMPT inhibition by GNE-617 when co-administered with NA in vivo. This rescue phenomenon was also observed at doses of NA (30 mg/kg, twice daily) that in mouse blood matches human exposures of a prescribed oral dose (2000 mg) of niacin [20]. Importantly, loss of efficacy was also observed with a second NAMPT inhibitor, GNE-618, when co-dosed with NA in two patient-derived xenograft models. In one of these models (STO-799), the loss of efficacy with NA co-treatment in vivo was not predicted given that NA completely protected cells from doses of GNE-618 that were greater than the EC90 when tumor explants were grown ex vivo.
Collectively, our results suggest that NA can rescue the antitumor effects of NAMPT inhibitors in vivo. These results are, to a degree, consistent with one study using an NAPRT1-deficient ovarian carcinoma xenograft model (A2780) in which co-administration of NA with APO866 decreased the life span of tumor-bearing mice to the number of days animals survived with NA alone [8]. In this study, however, the efficacy of APO866 at MTD was modest, and the resulting loss of efficacy with NA co-treatment was compared to NA and not vehicle-treated animals. Thus, the degree of NA rescue of TGI by APO866 in vivo was unclear. In contrast, a second study evaluating GMX-1778 did not exhibit a significant difference in TGI in the presence of NA in the NAPRT1-deficient HT-1080 xenograft model [11], although, and consistent with our data, there was a trend toward decreased efficacy on NA co-treatment when GMX-1778 was dosed at its MTD. However, NA was administered after GMX-1778 treatment and not co-administered with the NAMPT inhibitor, which, based on our results, does lead to a moderate loss of in vivo efficacy [11]. Notably, the HT-1080 xenograft model tested in our study is dependent on the dose of NA, since we did not observe loss of efficacy of GNE-617 at a lower dose of NA (30 mg/kg) tested. Thus, it remains possible that the timing of NA administration, dose of the NAMPT inhibitor, or NA itself tested renders the HT-1080 model more resistant to the rescue effects of NA co-treatment. Administration of NA with GMX-1778 in the PC3 model, however, did result in a complete loss of efficacy similar to observations made with GNE-617. The latter underscores the importance of confirming the rescuability of NA on in vivo efficacy of NAMPT inhibitors in multiple xenograft models, which we have demonstrated in this report. Moreover, the ability of NA to rescue in vivo efficacy does not appear to be unique to a particular NAMPT inhibitor.
Importantly, while GNE-617 treatment reduced tumor NAD levels by greater than 95% in vivo, co-administration of NA, which completely rescued TGI, only increased tumor NAD levels to 15% to 20% relative to untreated tumors. This observation is consistent with our in vivo data demonstrating that a dose of GNE-617 that can reduce tumor NAD levels by 80% was not efficacious, again suggesting that sustained reduction of NAD by >95% is required for maximum antitumor activity. Similar to NA, NAM co-treatment with GNE-617 also resulted in a loss of efficacy and a modest increase in NAD levels in NAPRT1-deficient tumor xenografts. Notably, NAM, but not NA, co-treatment modestly increased NAD in NAPRT1-deficient tumor cell lines in vitro while completely reversing the antiproliferative effects of GNE-617. Therefore, our in vitro data demonstrating rescuability by NAM translated well in vivo and suggest that low levels of NAD are remarkably sufficient to support tumor cell growth. The latter is also supported by the observation that that 90% reduction of cellular NAD levels by GMX-1778 is not sufficient to reduce viability in vitro [11]. Taken together, the in vitro and in vivo data demonstrate the remarkably high threshold for reduction of tumor NAD levels by an NAMPT inhibitor required to induce efficacy.
Collectively, our data demonstrate complete protection from NAMPT inhibition when NA is co-administered in vivo and furthermore demonstrates that protection is associated with regeneration of tumor NAD and NAM levels in the absence of NAPRT1. Because we were unable to detect any evidence of reexpression of NAPRT1 on NA treatment that could account for its protection, one compelling hypothesis is that rescuability is mediated by resupplying tumors with NAD or NAD precursors provided exogenously by normal, highly metabolic tissues such as the liver. In this case, the increase in liver NAD in response to NA may be sufficient to provide tumor cells with these metabolites to overcome the growth inhibitory effects of GNE-617. Indeed, the work by Billington et al. demonstrated that NIH-3T3 and SH-SYSY cells can uptake extracellular NAD in vitro at physiologically relevant concentrations and rescue cell death induced by FK866 on co-administration [22].
A second possibility is that increased liver NAM levels may provide an additional source of metabolites that enable NAD regeneration in tumors through NAMPT itself. Indeed, NAM is the primary circulating metabolite detected after intake and conversion of dietary NA in the liver [23]. Given the competitive nature of NAMPT inhibitors biochemically and structurally [24] (Oh et al., manuscript in preparation), the resulting increase in tumor NAM levels may compete with GNE-617 for binding to NAMPT. Consistent with this, a co-crystal structure of GNE-617 bound in the NAMPT active site suggests that the molecule will compete with NAM for binding to the protein (Oh et al., manuscript in preparation). In addition, previous biochemical experiments indicate that high NAM concentrations can negatively impact the ability of NAMPT inhibitors, which are structurally related to GNE-617, to completely block the function of the enzyme [25]. Similar to our observations in NAPRT1-deficient tumor cell lines, NAM has been shown to protect HepG2 human liver carcinoma cells in vitro from NAMPT inhibition [26]. Thus, NAM itself may block the ability of GNE-617 to inhibit NAMPT effectively, thereby reactivating the NAMPT salvage pathway to regenerate NAD in tumors in a positive feedback manner. Finally, it is possible that addition of NA may cause changes in intrinsic enzyme activity for another rate-limiting component of the pathway.
In conclusion, NA rescues the antitumor effects of NAMPT inhibitors in vivo as a result of regeneration of NAD in NAPRT1-deficient tumors. The data reported herein have important and direct implications in the clinical development of NAMPT inhibitors in terms of widening the therapeutic index by NA co-administration and suggest that this strategy may not be effective in patients as initially proposed. Our work also underscores the need to fully assess the impact of the complex in vivo metabolic macroenvironment when evaluating the efficacy of drugs that target tumor metabolism.
Supplementary Material
Figure 10.

NAM co-treatment increases NAD levels and rescues antitumor effects of NAMPT inhibition in vivo. (A) PC3 tumor xenografts were treated (Rx) orally for 5 days with vehicle control, NAM (twice daily), GNE-617 (once daily), or the combination of both agents at the doses indicated. (B–D) PC3 tumor xenografts (n = 5 per group) were treated (Rx) orally for 5 days with vehicle control, NAM, GNE-617, or the combination of both agents at the doses indicated, and tumors (B and C) or blood (D) was harvested 1 hour after the final dose for NAD (B) and NAM (C and D) measurements by LC-MS/MS as described in Materials and Methods section. Comparisons between treated groups and control (vehicle) were determined by Dunnett method: ***P < .0001. Comparisons between treatment groups were performed using unpaired t test assuming unequal variances: ##P < .001, ###P < .0001.
Acknowledgments
The authors thank the in vivo cell culture core and animal dosing teams at Genentech for their support of in vivo pharmacology studies.
Abbreviations
- NA
nicotinic acid
- NAD
nicotinamide adenine dinucleotide
- NAM
nicotinamide
- NAMPT
nicotinamide phosphoribosyltransferase
- NAPRT1
nicotinic acid phosphoribosyltransferase domain containing 1
Footnotes
This article refers to supplementary materials, which are designated by Figures W1 to W3 and are available online at www.neoplasia.com.
References
- 1.Burgos ES. NAMPT in regulated NAD biosynthesis and its pivotal role in human metabolism. Curr Med Chem. 2011;18:1947–1961. doi: 10.2174/092986711795590101. [DOI] [PubMed] [Google Scholar]
- 2.Bender DA. Biochemistry of tryptophan in health and disease. Mol Aspects Med. 1983;6:101–197. doi: 10.1016/0098-2997(83)90005-5. [DOI] [PubMed] [Google Scholar]
- 3.Preiss J, Handler P. Enzymatic synthesis of nicotinamide mononucleotide. J Biol Chem. 1957;225:759–770. [PubMed] [Google Scholar]
- 4.Martin PR, Shea RJ, Mulks MH. Identification of a plasmid-encoded gene from Haemophilus ducreyi which confers NAD independence. J Bacteriol. 2001;183:1168–1174. doi: 10.1128/JB.183.4.1168-1174.2001. [DOI] [PMC free article] [PubMed] [Google Scholar]
- 5.Locasale J, Cantley L. Altered metabolism in cancer. BMC Biol. 2010;8:88. doi: 10.1186/1741-7007-8-88. [DOI] [PMC free article] [PubMed] [Google Scholar]
- 6.Carson DA, Seto S, Wasson DB. Pyridine nucleotide cycling and poly(ADP-ribose) synthesis in resting human lymphocytes. J Immunol. 1987;138:1904–1907. [PubMed] [Google Scholar]
- 7.Nomura F, Yaguchi M, Togawa A, Miyazaki M, Isobe K, Miyake M, Noda M, Nakai T. Enhancement of poly-adenosine diphosphate-ribosylation in human hepatocellular carcinoma. J Gastroenterol Hepatol. 2000;15:529–535. doi: 10.1046/j.1440-1746.2000.02193.x. [DOI] [PubMed] [Google Scholar]
- 8.Olesen UH, Thougaard AV, Jensen PB, Sehested M. A preclinical study on the rescue of normal tissue by nicotinic acid in high-dose treatment with APO866, a specific nicotinamide phosphoribosyltransferase inhibitor. Mol Cancer Ther. 2010;9:1609–1617. doi: 10.1158/1535-7163.MCT-09-1130. [DOI] [PubMed] [Google Scholar]
- 9.Preiss J, Handler P. Biosynthesis of diphosphopyridine nucleotide. I. Identification of intermediates. J Biol Chem. 1958;233:488–492. [PubMed] [Google Scholar]
- 10.Olesen UH, Hastrup N, Sehested M. Expression patterns of nicotinamide phosphoribosyltransferase and nicotinic acid phosphoribosyltransferase in human malignant lymphomas. APMIS. 2011;119:296–303. doi: 10.1111/j.1600-0463.2011.02733.x. [DOI] [PubMed] [Google Scholar]
- 11.Watson M, Roulston A, Bélec L, Billot X, Marcellus R, Bédard D, Bernier C, Branchaud S, Chan H, Dairi K, et al. The small molecule GMX1778 is a potent inhibitor of NAD+ biosynthesis: strategy for enhanced therapy in nicotinic acid phosphoribosyltransferase 1-deficient tumors. Mol Cell Biol. 2009;29:5872–5888. doi: 10.1128/MCB.00112-09. [DOI] [PMC free article] [PubMed] [Google Scholar]
- 12.Holen K, Saltz LB, Hollywood E, Burk K, Hanauske AR. The pharmacokinetics, toxicities, and biologic effects of FK866, a nicotinamide adenine dinucleotide biosynthesis inhibitor. Invest New Drugs. 2008;26:45–51. doi: 10.1007/s10637-007-9083-2. [DOI] [PubMed] [Google Scholar]
- 13.Ravaud A, Cerny T, Terret C, Wanders J, Bui BN, Hess D, Droz JP, Fumoleau P, Twelves C. Phase I study and pharmacokinetic of CHS-828, a guanidino-containing compound, administered orally as a single dose every 3 weeks in solid tumours: an ECSG/EORTC study. Eur J Cancer. 2005;41:702–707. doi: 10.1016/j.ejca.2004.12.023. [DOI] [PubMed] [Google Scholar]
- 14.Gaut ZN, Solomon HM. Uptake and metabolism of nicotinic acid by human blood platelets. Effects of structure analogs and metabolic inhibitors. Biochim Biophys Acta. 1970;201:316–322. doi: 10.1016/0304-4165(70)90306-5. [DOI] [PubMed] [Google Scholar]
- 15.Zheng X, Bauer P, Baumeister T, Buckmelter AJ, Caligiuri M, Clodfelter KH, Han B, Ho YC, Kley N, Lin J, et al. Structure-based discovery of novel amide-containing nicotinamide phosphoribosyltransferase (Nampt) inhibitors. J Med Chem. 2013;56:6413–6433. doi: 10.1021/jm4008664. [DOI] [PubMed] [Google Scholar]
- 16.Zheng X, Bair KW, Bauer P, Baumeister T, Bowman KK, Buckmelter AJ, Caligiuri M, Clodfelter KH, Feng Y, Han B, et al. Identification of amides derived from 1H-pyrazolo[3, 4-b]pyridine-5-carboxylic acid as potent inhibitors of human nicotinamide phosphoribosyltransferase (NAMPT) Bioorg Med Chem Lett. 2013;23:5488–5497. doi: 10.1016/j.bmcl.2013.08.074. [DOI] [PubMed] [Google Scholar]
- 17.Wong H, Alicke B, West KA, Pacheco P, La H, Januario T, Yauch RL, de Sauvage FJ, Gould SE. Pharmacokinetic-pharmacodynamic analysis of vismodegib in preclinical models of mutational and ligand-dependent Hedgehog pathway activation. Clin Cancer Res. 2011;17:4682–4692. doi: 10.1158/1078-0432.CCR-11-0975. [DOI] [PubMed] [Google Scholar]
- 18.Green LA, Gambhir SS, Srinivasan A, Banerjee PK, Hoh CK, Cherry SR, Sharfstein S, Barrio JR, Herschman HR, Phelps ME. Noninvasive methods for quantitating blood time-activity curves from mouse PET images obtained with fluorine-18-fluorodeoxyglucose. J Nucl Med. 1998;39:729–734. [PubMed] [Google Scholar]
- 19.Williams SP, Flores-Mercado JE, Port RE, Bengtsson T. Quantitation of glucose uptake in tumors by dynamic FDG-PET has less glucose bias and lower variability when adjusted for partial saturation of glucose transport. EJNMMI Res. 2012;2:6. doi: 10.1186/2191-219X-2-6. [DOI] [PMC free article] [PubMed] [Google Scholar]
- 20.Menon RM, Adams MH, González MA, Tolbert DS, Leu JH, Cefali EA. Plasma and urine pharmacokinetics of niacin and its metabolites from an extended-release niacin formulation. Int J Clin Pharmacol Ther. 2007;45:448–454. doi: 10.5414/cpp45448. [DOI] [PubMed] [Google Scholar]
- 21.Xiao Y, Elkins K, Durieux J, Lee L, Oeh J, Lulu Y, Liang X, DelNagro CH, Tremayne J, Kwong M, et al. Dependence of tumor cell lines and patient-derived tumors on the NAD salvage pathway renders them sensitive to NAMPT inhibition with GNE-618. Neoplasia. 2013;15:1151–1160. doi: 10.1593/neo.131304. [DOI] [PMC free article] [PubMed] [Google Scholar]
- 22.Billington RA, Travelli C, Ercolano E, Galli U, Roman CB, Grolla AA, Canonico PL, Condorelli F, Genazzani AA. Characterization of NAD uptake in mammalian cells. J Biol Chem. 2008;283:6367–6374. doi: 10.1074/jbc.M706204200. [DOI] [PubMed] [Google Scholar]
- 23.Kirkland JB. Niacin status, NAD distribution and ADP-ribose metabolism. Curr Pharm Des. 2009;15:3–11. doi: 10.2174/138161209787185823. [DOI] [PubMed] [Google Scholar]
- 24.Khan JA, Tao X, Tong LA. Molecular basis for the inhibition of human NMPRTase, a novel target for anticancer agents. Nat Struct Mol Biol. 2006;13:582–588. doi: 10.1038/nsmb1105. [DOI] [PubMed] [Google Scholar]
- 25.Zheng X, Bauer P, Baumeister T, Buckmelter AJ, Caligiuri M, Clodfelter KH, Han B, Ho YC, Kley N, Lin J, et al. Structure-based identification of ureas as novel nicotinamide phosphoribosyltransferase (Nampt) inhibitors. J Med Chem. 2013;56:4921–4937. doi: 10.1021/jm400186h. [DOI] [PubMed] [Google Scholar]
- 26.Hasmann M, Schemainda I. FK866, a highly specific noncompetitive inhibitor of nicotinamide phosphoribosyltransferase, represents a novel mechanism for induction of tumor cell apoptosis. Cancer Res. 2003;63:7436–7442. [PubMed] [Google Scholar]
Associated Data
This section collects any data citations, data availability statements, or supplementary materials included in this article.