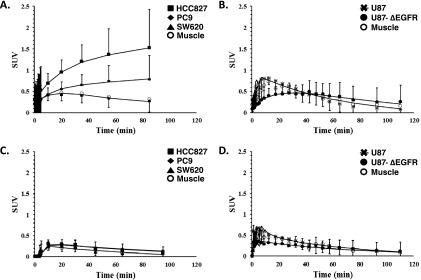
Figure 3.

[11C]-erlotinib TACs in mice bearing multiple tumor xenografts for mice imaged under high (A and B) or low (C and D) SA conditions. TACs for HCC827 (squares), PC9 (diamonds), and SW620 (triangles) or U87 (asterisks) and U87Δ (closed circles) xenografts with muscle (open circles) used as reference. Data points are SUVs with SD, and overlaid lines depict SRTM curve fits.
