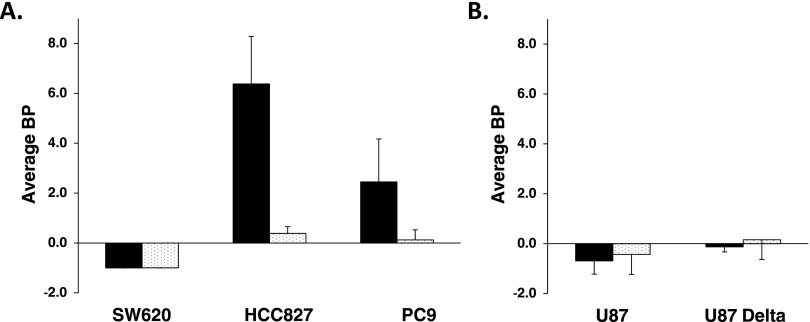
Figure 4.
Average BP of [11C]-erlotinib determined by SRTM in both high SA (black) and low SA (white) conditions. (A) Comparison of average BPs for SW620, HCC827, and PC9 xenografts. (B) Average BPs for U87 and U87 ΔEGFR tumors. Error bars represent the SD. Significant differences are reported in Results section.

