

Abstract
Photoacoustic computed tomography (PACT) is a hybrid technique that combines optical excitation and ultrasonic detection to provide high resolution images in deep tissues. In the image reconstruction, a constant speed of sound (SOS) is normally assumed. This assumption, however, is often not strictly satisfied in deep tissue imaging, due to acoustic heterogeneities within the object and between the object and coupling medium. If these heterogeneities are not accounted for, they will cause distortions and artifacts in the reconstructed images. In this paper, we incorporated ultrasonic computed tomography (USCT), which measures the SOS distribution within the object, into our full-ring array PACT system. Without the need for ultrasonic transmitting electronics, USCT was performed using the same laser beam as for PACT measurement. By scanning the laser beam on the array surface, we can sequentially fire different elements. As a first demonstration of the system, we studied the effect of acoustic heterogeneities on photoacoustic vascular imaging. We verified that constant SOS is a reasonable approximation when the SOS variation is small. When the variation is large, distortion will be observed in the periphery of the object, especially in the tangential direction.
Photoacoustic computed tomography (PACT) is a hybrid technique that is based on the acoustic detection of optical absorption in tissue from chromophores, such as oxygenated hemoglobin (HbO2) and deoxygenated hemoglobin (Hb). The conversion of light to acoustic waves allows PACT to image vasculatures in deep tissues with acoustically defined high spatial resolution [1, 2]. Over the past few years, several small-animal PACT systems have been developed with different—such as circular [1], hemispherical [3] and spherical [4]—detection geometries. When small-animal whole-body vascular images were reconstructed in most cases, a uniform speed of sound (SOS) within the acoustic media was assumed. This assumption is violated in whole-body imaging due to the relatively large SOS variations within the animal body and between the coupling medium and the animal, which may cause distortions and artifacts in the reconstructed images [5].
To address this problem, one needs to measure the SOS variation of the medium, which can be achieved by ultrasonic computed tomography (USCT) [6]. However, most PACT systems lack transmitting electronics, partially due to the large number of dedicated receive preamplifiers connected right at the array output [7]. While transmit-receive switches can be implemented, they add cost and complexity in electronic design, and also degrade the system’s signal to noise ratio. Moreover, a transmitting ultrasonic array requires the usage of piezoelectric materials that are suboptimal for receiving photoacoustic signals. This problem was first addressed by S. Manohar et al., who suggested using the photoacoustic effect to generate ultrasonic waves from a point optical absorber [8, 9]. In this study, we adapted a similar approach, but without using point absorbers. Taking advantage of a full-ring transducer array, we illuminated a narrow laser beam directly on the transducer surface. The laser beam is then scanned to provide sequential firing of array elements. With minimum modification, this method adds USCT capability to the PACT system.
Figure 1(a) shows a schematic of the integrated PACT and USCT system. For PACT, the laser beam is first homogenized by a ground glass and then illuminated directly on the object in a 512-element full-ring transducer array. The array has a 5 MHz central frequency, and the signals are detected by a data acquisition system with 40 MHz sampling rate. A detailed description of the PACT system can be found in references [1, 10]. To perform USCT measurement, we developed a USCT add-on module, which consists of a conical lens and a round disk with a radial slit. The homogenized laser beam is first converted into a ring-shaped light and then passes through the 1 mm wide light slit to illuminate the transducer element. The conversion to ring-shaped light is essential for maximum light delivery efficiency and minimum light leakage to other elements. Compared with electronic-based ultrasound firing, our approach has two advantages. First ultra-short laser pulses can generate clean, high intensity broad-band ultrasonic signals, which are favorable in frequency-domain data analysis, such as attenuation measurement. Second, USCT can be performed using the same laser for PACT experiments, simplifying system design.
Figure 1.

Integrated photoacoustic and ultrasonic computed tomography system. (a) Schematic of the system. (b) Raw channel data from a photoacoustic computed tomography measurement. (c) Raw channel data from an ultrasonic computed tomography measurement. White arrows: photoacoustic signals generated on the transducer surface.
Figure 1(b) shows the raw-channel data of a PACT experiment. Because of light scattering, the laser beam also fired all the elements in the array (Arrow 1), which generated a circular acoustic wave that propagated to elements on the opposite side (Arrow 2). Because these signals occurred only at the beginning and end of the measurement, they did not contaminate photoacoustic signals of the object. Figure 1(c) shows the raw-channel data of a USCT experiment with the USCT add-on. Because of the conical lens and the light slit, only a few elements (<3) were excited (Arrow 2). By rotating the light slit, we could sequentially fire different array elements to perform USCT measurement. In this study, we used only one light slit. However, multiple light slits can be applied to speed up measurement, as long as signals from different firing elements can be separated in time.
The SOS estimation is based on the relative time of flight (TOF), which is obtained by first running a reference measurement through water and then cross-correlating the signal with a measurement made on the object. This time-domain cross correlation method works well when the shape of the signal is not severely distorted by attenuation or refraction. The relative TOF can be expressed as
| (1) |
where cw and c(x, y) are the SOS of water and SOS of the object at position (x, y), respectively. If we assume that the acoustic transmission path (L) is straight, Eq. (1) represents a linear relationship between the relative TOF and the acoustic slowness (reciprocal of SOS) [11], and is a form of the Radon transform. Therefore, the SOS map can be reconstructed using filtered back projection.
As the first demonstration of the system, we studied how images are distorted by different SOS values in the coupling medium and the object. In whole-body PACT, for better detection coverage, a transducer array with hundreds of elements is used to enclose the imaging region. To ensure that different elements have similar detection sensitivity within the field of view, the array size is normally much larger than the object. The large scanning geometry yields a large volumetric ratio between the coupling water and the object. While warming water up to body temperature increase the SOS (1.52 mm/μs at 37 °C), it is still less than the SOS of a typical biological tissue (1.54 mm/μs). In addition, because the heater may generate bubbles in water [12], it is normally turned off during image acquisition, yielding an even larger SOS difference. It is important to examine how this difference affects photoacoustic imaging.
We first used numerical simulations to demonstrate the distortion of images due to acoustic heterogeneities. The simulation was performed using the k-Wave toolbox [13]. To mimic vascular structures, we used a skeleton leaf [Figure 2(a)], embedded in a circular gel with sound speeds higher than that of water. A skeleton leaf was used because it has rich vascular structures and the simulation can be validated experimentally. We simulated four cases, with two different sound speeds [Figures 2(b) and 2(c)] and two different gel diameters (Figure 2, top and bottom rows). The scanning geometry is similar to that in our experimental setup: 512 transducer elements evenly distributed in a 5-cm-diameter ring. The photoacoustic images were reconstructed using a constant SOS (the optimum SOS), derived by maximizing the image sharpness function [14]. This is also the optimization procedure we used when imaging an unknown object in experimental settings. From Figures 2(b) and 2(c), we can see that the distortion is negligible in the small object (diameter: 10 mm). When the diameter of the object increases to 20 mm (a typical size of a mouse cross section), we start to see blurring in the periphery of the object. It is also worth noticing that the level of blurring is different for vessels along different directions: a vessel along the radial direction blurs more than a vessel along the tangential direction.
Figure 2.
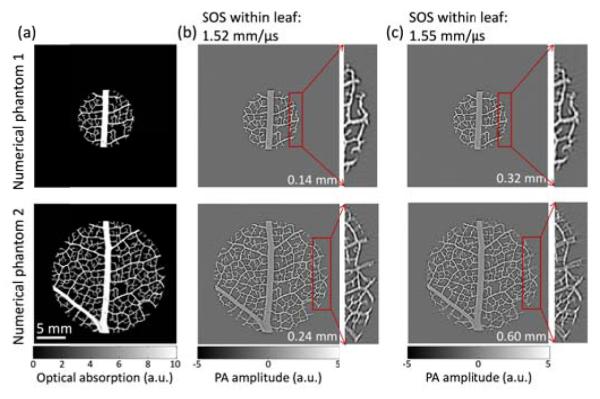
Numerical phantom studies. (a) Numerical leaf phantoms showing the distribution of optical absorption in arbitrary units. (b) and (c), photoacoustic images reconstructed using a constant speed of sound that renders the sharpest image. The initial pressure data was simulated by assigning the speed of sound within the leaf to be 1.52 mm/μs and 1.55 mm/μs in (b) and (c), respectively. The speed of sound in water is 1.5 mm/μs for all cases. The number written at the bottom right corner of each image is the observed vessel split.
This blurring effect is explained through Figure 3. In the study, we found that the optimum SOS for image reconstruction is always close to the average SOS along the radial direction of the ring array [Eq. (2)]. With this optimum SOS, the photoacoustic signal of a vessel along the radial direction will be projected to opposite sides of the true vessel position by elements A and B, respectively, leading to splitting vessels. In contrast, a vessel along the tangential direction will be projected to the same side of the vessel by elements C and D, yielding only a slight shift in vessel position. Based on this explanation, we can derive a vessel splitting criterion. Because the center of the object is the least distorted, the optimum SOS can be calculated using
| (2) |
where robj is the radius of the object, ra is the radius of the ring array, vobj is the SOS in the object, and vw is the SOS in water.
Fig. 3.
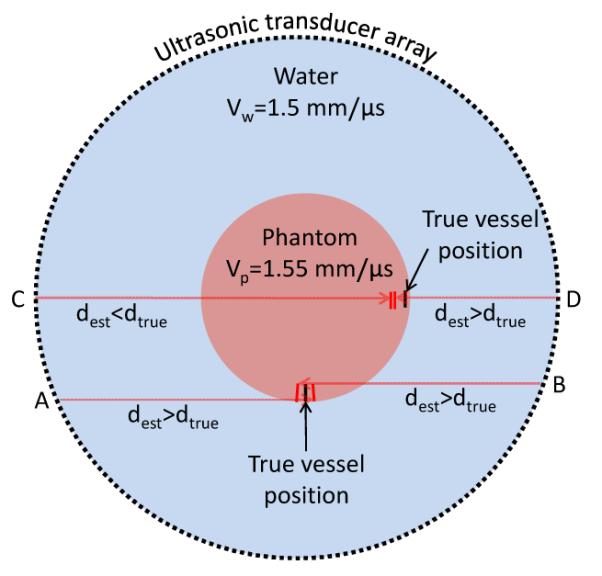
Demonstration of the distortion effect. The true traveling distance of a photoacoustic signal: dtrue = Σ(ti × vi). The estimated traveling distance used in image reconstruction: dest = t × vo.
The true time of flight t from the bottom vessel to element A can be expressed as
| (3) |
The displacement between the true vessel position and the projected position can then be written as
| (4) |
Because the image is formed by projection of data from both sides of the vessel, the split will be 2Δd. Therefore significant vessel splitting can be observed only when 2Δd is larger than the system’s tangential resolution (0.22 mm for 5 mm radius and 0.26 mm for 10 mm radius) [10]. The 2Δd value for Figure 2 is written at the bottom right corner of each image. It can be seen that the splits agree well with the observations.
We then investigated the effect of acoustic heterogeneity using the integrated USCT-PACT system. The first object was a mouse kidney embedded in an agar gel. We initially performed the PACT experiment and then added the USCT module to get the SOS map [Figure 4(a)]. The mouse kidney and the cylindrical agar gel can be clearly identified in the SOS map. This SOS map was then input to the k-Wave toolbox for time-reversal PACT image reconstruction. Compared with the PACT image reconstructed using the optimum SOS [Figure 4(b)], the SOS-informed reconstruction [Figure 4(c)] looks very similar. This observation is consistent with findings in our simulation study that when the object and SOS variation is small, the effect of the acoustic heterogeneity is negligible.
Fig. 4.
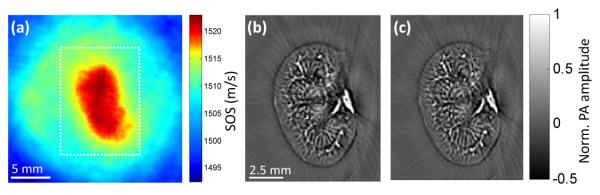
Experimental images of an excised mouse kidney. (a) The SOS map obtained from USCT measurement. (b) PACT image within the dashed box in (a) reconstructed using a constant SOS that renders the sharpest image. (c) PACT image reconstructed using the SOS map in (a).
We further studied the acoustic heterogeneity effect using a skeleton leaf phantom [Figure 5(a)]. To increase the SOS in the agar gel, we mixed the agar solution with 10% glycerol (SOS: 1.90 mm/μs), yielding an agar gel with an SOS around 1.535 mm/μs. We performed PACT and USCT experiments in sequence as in the previous kidney phantom study. The images were first reconstructed using the optimum SOS [Figures 5(b) and 5(c)]. Because of the large object size and high SOS difference, vessel splitting [red arrows, Figure 5(c)] can be clearly observed in the image, especially at the periphery of the object. We then performed time-reversal reconstruction using the SOS map [Figure 5(d)]. As expected, the images [Figures 5(e) and 5(f)] are superior to the uncorrected ones and the vessel splitting disappears.
Figure 5.
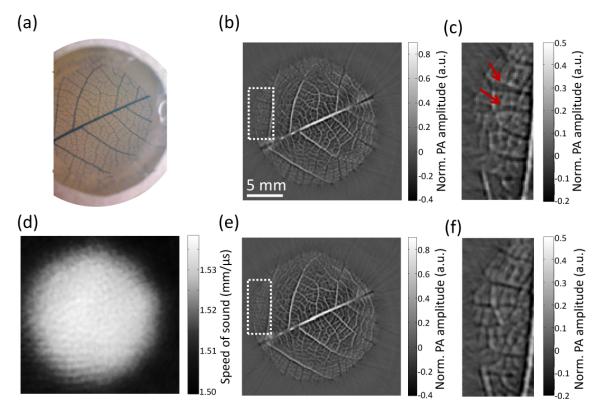
Experimental results of a leaf phantom. (a) Photograph of the skeleton leaf embedded in an agar gel with SOS of 1.535 mm/μs. (b) PACT image reconstructed using a constant average speed of sound (SOS), which was optimized for image sharpness. (c) Zoomed-in view of the veins within the dashed box indicated in (b). (d) The SOS map obtained from USCT measurement. (e) PACT image reconstructed using the SOS map in (d). (f) Zoomed-in view of the veins within the box indicated in (e).
There are still some distortions at the periphery of the object, where the amplitude of the vessel changes from positive to negative. There are two possible reasons: first, our SOS reconstruction is based on straight ray model, which may yield inaccurate SOS estimations, especially in the proximity of the interface, where acoustic refraction and reflection are likely to take place. Second, we used a two-dimensional time-reversal reconstruction algorithm, which does not account for the three-dimensional wave propagation and detection sensitivity of our transducer array. We examined the first effect by manually assigning an SOS map based on a photograph of the object and system. However, the PACT image reconstructed using that SOS map yielded almost the same result as Figure 5(e). Therefore, we believe two-dimensional image reconstruction, which assumes acoustic waves propagate only within a two-dimensional plane, is the main cause of the amplitude change. However, the amplitude change is a second order effect compared to vessel splitting, and can be further improved when three-dimensional wave-inversion algorithms are developed.
In summary, we developed an integrated USCT and PACT system based on a full-ring ultrasonic transducer array. USCT firing was performed using the same laser as for PACT experiments. The ultra-short laser pulse allows generating clean broad-band acoustic waves. The system was used to study the distortion of PACT images due to acoustic heterogeneity between the object and the coupling medium. We find that constant SOS is a reasonable approximation when the SOS variation is small or when the object is small compared to the scanning geometry. For larger objects and larger SOS variations, the image reconstructed using constant SOS will be distorted, mainly at the periphery of the object and along the tangential direction. An integrated USCT and PACT system substantially improves the accuracy of PACT imaging reconstruction.
Acknowledgements
The authors appreciate Prof. James Ballard’s close reading of the manuscript. This work was sponsored in part by National Institutes of Health grants DP1 EB016986 (NIH Director’s Pioneer Award), R01 EB016963, R01 EB008085, R01 CA134539, U54 CA136398, R01 CA157277, and R01 CA159959. L.W. has a financial interest in Microphotoacoustics, Inc. and Endra, Inc., which, however, did not support this work. K.M. has a financial interest in Microphotoacoustics, Inc., which, however, did not support this work.
Footnotes
OCIS Codes: (140.3490) vascular imaging, photoacoustic computed tomography, ultrasonic computed tomography, acoustic heterogeneity, time reversal
References
- 1.Xia J, Chatni M, Maslov K, Guo Z, Wang K, Anastasio M, Wang LV. Whole-body ring-shaped confocal photoacoustic computed tomography of small animals in vivo. J. Biomed. Opt. 2012;17(5):050506. doi: 10.1117/1.JBO.17.5.050506. [DOI] [PMC free article] [PubMed] [Google Scholar]
- 2.Chatni MR, Xia J, Sohn R, Maslov K, Guo Z, Zhang Y, Wang K, Xia Y, Anastasio M, Arbeit J, Wang LV. Tumor glucose metabolism imaged in vivo in small animals with whole-body photoacoustic computed tomography. J. Biomed. Opt. 2012;17(7):076012. doi: 10.1117/1.JBO.17.7.076012. [DOI] [PMC free article] [PubMed] [Google Scholar]
- 3.Kruger R, Reinecke D, Kruger G, Thornton M, Picot P, Morgan T, Stantz K, Mistretta C. HYPR-spectral photoacoustic CT for preclinical imaging. Proceedings of SPIE. 2009;7177(71770F) [Google Scholar]
- 4.Brecht H-P, Su R, Fronheiser M, Ermilov SA, Conjusteau A, Oraevsky AA. Whole-body three-dimensional optoacoustic tomography system for small animals. J. Biomed. Opt. 2009;14(6):064007–064008. doi: 10.1117/1.3259361. [DOI] [PMC free article] [PubMed] [Google Scholar]
- 5.Huang C, Nie L, Schoonover RW, Wang LV, Anastasio MA. Photoacoustic computed tomography correcting for heterogeneity and attenuation. J. Biomed. Opt. 2012;17(6):061211–061211. doi: 10.1117/1.JBO.17.6.061211. [DOI] [PMC free article] [PubMed] [Google Scholar]
- 6.Duric N, Littrup P, Poulo L, Babkin A, Pevzner R, Holsapple E, Rama O, Glide C. Detection of breast cancer with ultrasound tomography: First results with the Computed Ultrasound Risk Evaluation (CURE) prototype. Med. Phys. 2007;34(2):773–785. doi: 10.1118/1.2432161. [DOI] [PubMed] [Google Scholar]
- 7.Gamelin J, Castillo D, Zhu Q, Aguirre A, Huang F, Maurudis A. Photoacoustic Imaging and Spectroscopy. CRC Press; 2009. Design and Characterization of an Array-Based Photoacoustic Tomographic System for Small Animal Imaging; pp. 309–328. [Google Scholar]
- 8.Manohar S, Willemink RGH, v. d. Heijden F, Slump CH, v. Leeuwen TG. Concomitant speed-of-sound tomography in photoacoustic imaging. Appl. Phys. Lett. 2007;91(13):131911. [Google Scholar]
- 9.Jose J, Willemink RGH, Steenbergen W, Slump CH, v. Leeuwen TG, Manohar S. Speed-of-sound compensated photoacoustic tomography for accurate imaging. Med. Phys. 2012;39(12):7262–7271. doi: 10.1118/1.4764911. [DOI] [PubMed] [Google Scholar]
- 10.Gamelin J, Maurudis A, Aguirre A, Huang F, Guo P, Wang LV, Zhu Q. A real-time photoacoustic tomography system for small animals. Opt. Express. 2009;17(13):10489–10498. doi: 10.1364/oe.17.010489. [DOI] [PMC free article] [PubMed] [Google Scholar]
- 11.Jin X, Wang LV. Thermoacoustic tomography with correction for acoustic speed variations. Phys. Med. Biol. 2006;51(24):6437. doi: 10.1088/0031-9155/51/24/010. [DOI] [PubMed] [Google Scholar]
- 12.Van de Sompel D, Sasportas LS, Dragulescu-Andrasi A, Bohndiek S, Gambhir SS. Improving Image Quality by Accounting for Changes in Water Temperature during a Photoacoustic Tomography Scan. PLoS One. 2012;7(10):e45337. doi: 10.1371/journal.pone.0045337. [DOI] [PMC free article] [PubMed] [Google Scholar]
- 13.Treeby BE, Cox BT. k-Wave: MATLAB toolbox for the simulation and reconstruction of photoacoustic wave fields. J. Biomed. Opt. 2010;15(2) doi: 10.1117/1.3360308. [DOI] [PubMed] [Google Scholar]
- 14.Treeby BE, Varslot TK, Zhang EZ, Laufer JG, Beard PC. Automatic sound speed selection in photoacoustic image reconstruction using an autofocus approach. J. Biomed. Opt. 2011;16(9) doi: 10.1117/1.3619139. [DOI] [PubMed] [Google Scholar]