Abstract
Objective
To examine the 13-year trend in annual dental care utilization among the US non-institutionalized civilian population.
Methods
Data from the BRFSS from 1995–2008 for adults’ age 18 and older were abstracted and analyzed using the NIDCR/CDC data query system. Point-estimates, confidence-intervals, trends and differences in trends for self-reported annual dental visits by socio-demographic factors and behavioral factor (smoking) were tested with chi-square tests using Stata® (v11).
Results
The overall, median percent of reported dental visits increased marginally (1.3%; p=0.99) from 68.6% (66.2%, 70.9%) in 1995 to 69.9% (69.1%, 71.7%) in 2008. Trend lines remained flat for most age groups except for those aged 65 and older, which showed a steady rise from 58.9% (52.9%, 64.9%) in 1995 to 66.3% (63.9%, 68.7%) in 2008. Disparities in median annual dental visits between non-Hispanic whites and other racial/ethnic groups increased from a range of a 2–7% point difference (1995) to a 7–11% point difference (2008). A higher percentage of women relative to men reported a visit 70.1% (66.9%, 73.2%) vs. 66.6 % (63.8%, 69.3%) in 1995 and 71.2% (69.2%, 73.2%) vs. 67.4% (65.0%, 69.7%) in 2008; trends and differences in trends among gender remained similar over time (4–5%). No meaningful change in reported dental visit by race/ethnicity; income, education or smoking was seen.
Conclusion
Over 13 years, the proportion of persons visiting a dentist has remained relatively constant. Of note is that disparities in dental visits by socio-demographic factors also remained the same over time.
Keywords: Dental visit, trend, utilization, disparity
Background
Dental care utilization is commonly used to measure patient behavior to seek accessible care (1). The proportion of a population with a dental visit each year is an important measure for predicting dental care utilization (2) spending, identifying oral health disparities, and assessing the impacts of changing economic conditions and policies. Research in this area is also important to health professionals and policymakers alike; advocating or modifying existing policies and programs can better target at-risk subgroups and remove barriers to accessing oral health care. For the first time, oral health is included as a leading health indicator in the nation’s health objectives. Specifically, the Healthy People 2020 indicator aims to increase the proportion of children, adolescents, and adults who use the oral health care system by a ten percentage point from a baseline line of 44.5% in 2007 to 49% by 2020. Therefore, monitoring trends in dental care utilization can be used to track national performance and progress (4, 5).
The proportion of individuals reporting at least a visit to the dentist in the past year has gradually risen over the years from 37% in 1958 to 50% during the 1970s (6). Studies in recent decades also reflect this trend while showing significant utilization disparity by socio-demographic factors such as age, gender, race/ethnicity, and income. Fortunately, the previously wide gap in dental care utilization according to socio-demographic status, narrowed over time. Many studies use one of the three main nationally representative data sources to analyze dental care utilization; the Medical Expenditure Panel Survey (MEPS), the National Health and Nutrition Examination Survey (NHANES) and the National Health Interview Survey (NHIS). However, dental care utilization and differences in care sought vary significantly between these three data sources. The study by Macek et al compared reported dental visit among adults using these three data sources and found a statistically significant difference in the overall reported dental visit but consistent stratum-specific trend estimates (5). A literature review by Dolan et al assessed national trends in dental care utilization among older adults in the United States utilizing reports based on MEPS, NHANES, or NHIS. They found inconsistent results in that the surveys produced different responses to the same questions. However trends were consistent as it relates to health disparities across the data sources (7). Reasons given for the discrepancies in estimates among these data sources include differing study design, and reference periods, lead-in-statements, question format and social desirability of questions (7). Based on this, a true overall estimate of dental visit utilization is still farfetched.
The results presented in this paper are based on the Behavioral Risk Factor Surveillance System (BRFSS) survey; a state administered survey representative of state level dental visit estimates. BRFSS is conducted annually and provides state-specific prevalence estimates for major behavioral risks among adults (8). Much of the implementation of the Patient Protection and Affordable Care Act (PPACA) will be left to the States. Thus States have the option to opt out of the PPACA’s Medicaid expansion and will be responsible for creating their health insurance exchanges. Examining dental utilization in BRFSS over the past decade may provide further insights to disparity trends, track the impact of interventions, and leverage future policymaking on the state level.
Objective
To examine the 13-year (1995 – 2008) trend in annual dental care utilization for any type of dental care —preventive, restorative, orthodontic, oral surgery— among the U.S. non-institutionalized civilian population.
Methods
Data from the BRFSS 1995–2008 was analyzed using the National Institute of Dental and Craniofacial Research (NIDCR) and Centers for Disease Control and Prevention (CDC) Data Query System (DQS). Descriptive statistics comprising median proportion of self-reported dental visits in the past year with their 95 percent confidence intervals for individuals at least 18 years of age are reported by gender, race/ethnicity, household income, education level and smoking status.
Trends and differences in trend proportion between groups were tested with the Pearson’s chi2 test using Stata statistical software package v.11. Trends lines were charted with MS Excel. Median percentage visits represent the prevalence estimate of dental visits for the middle state in a list of state level prevalence estimates listed from smallest to largest. Median estimates are a more reliable estimate because unlike the mean estimates, they are less sensitive to the effects of outliers.
Results
For all adults, the median percent of reported dental visits in the past year increased marginally (1.3%; p=0.99) from median (95% C.I) 68.6% (66.2%, 70.9%) in 1995 to 69.9% (68.2%, 71.8%) in 2008. The greatest increase in median percentage dental visit was observed in the year 2000 with a median (95% C.I) reported dental visit of 71.8 % (70.1%, 73.6%). (Table 1) In 1995 as compared to a median (95% C.I) of 68.6% (66.2%, 70.9%) reporting visiting a dentist in the past year, 7.5% (6.3%, 8.7%) reported their last visit to the dentist as greater than 2 years but less than 5 years. Additionally, 68.9% reported a dental visit in the past year in 2006 compared to 9.1% (8.1%, 10.1%) who reported their last dental visit as more than 2 years but less than 5 years prior. (Table 1)
Table 1.
Median proportion with 95% confidence interval of self-reported dental visits from the Behavioral Risk factors Surveillance system (BRFSS) 1995–2008
| Dental visits in the past year | Dental visits greater than 2 years but less than 5 years |
|||
|---|---|---|---|---|
| Year | Median (%) | 95% C.I. | Median (%) | 95% C.I. |
| 1995 | 68.6 | 66.2, 70.9 | 7.5 | 6.3, 8.7 |
| 1996 | 69.7 | 67.9, 71.5 | 7.0 | 6.0, 8.1 |
| 1997 | 66.6 | 64.1, 69.1 | 8.0 | 6.7, 9.4 |
| 1998 | 70.1 | 67.8, 72.4 | 6.7 | 5.7, 7.7 |
| 1999 | 67.9 | 65.3, 70.4 | 8.1 | 6.6, 9.7 |
| 2000 | 71.8 | 70.1, 73.6 | 6.5 | 5.3, 7.6 |
| 2001 | 70.6 | 68.6, 72.5 | 7.3 | 6.3, 8.4 |
| 2002 | 69.2 | 67.3, 71.1 | 8.0 | 7.0, 8.9 |
| 2003 | 70.8 | 69.3, 72.3 | 7.3 | 6.2, 8.3 |
| 2004 | 68.7 | 66.9, 70.6 | 8.4 | 7.3, 9.5 |
| 2005 | 66.5 | 64.8, 68.2 | 9.6 | 7.9, 11.2 |
| 2006 | 68.9 | 67.4, 70.45 | 9.1 | 8.1, 10.1 |
| 2008 | 69.9 | 68.2, 71.8 | 9.0 | 8.4, 9.5 |
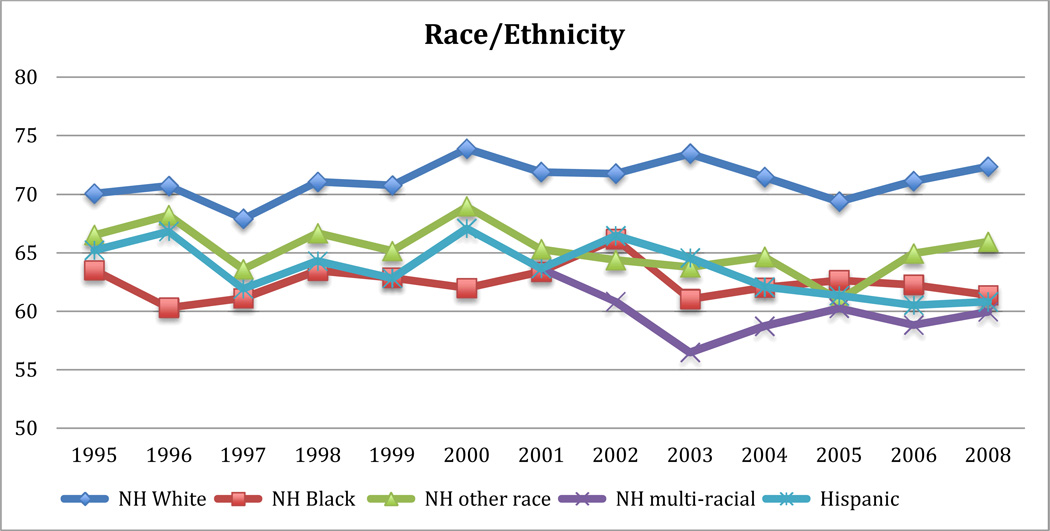
The median dental visit remained relatively flat for most age groups except for those aged 65 and older, which showed a steady increase from 58.9% (52.9%, 64.7%) in 1995 to 66.3% (63.9%, 68.7%) in 2008. (Table 2) It should be noted that utilization of dental care services declined between the years 2000 to 2005, when many States either reduced or eliminated adult dental Medicaid benefits to address increasing financial constraints. The 14 states that offered comprehensive dental benefits in 2000 was reduced by half in 2005, leaving the overwhelming majority of States to provide limited or emergency dental services and seven states not offering any Medicaid dental benefits (9). While the trend in State Medicaid changes was generalized, no meaningful change was observed in the percentage of dental visit reported in the past year according to race/ethnicity from the years studied. Non-Hispanic whites consistently reported the highest median visits ranging from 70.1% (67.5%, 72.7%) in 1995 to 72.4% (70.5%, 74.3%) in 2008. The disparity in median dental visit between Non-Hispanic whites and the other racial/ethnic groups increased from a range of between 2–7% point difference in 1995 to a 7–11% point difference in 2008. (Figure 1)
Table 2.
Median proportion of self-reported dental visits by age from the Behavioral Risk factors Surveillance system (BRFSS) 1995–2008
| 18–24 | 25–34 | 35–44 | 45–54 | 55–64 | 65+ | |
|---|---|---|---|---|---|---|
| 1995 | 69.1 | 67.4 | 75.2 | 74.9 | 67.8 | 58.9 |
| 1996 | 73.7 | 68.3 | 74.7 | 74.2 | 65.8 | 59.0 |
| 1997 | 67.7 | 65.0 | 71.2 | 71.3 | 67.0 | 61.3 |
| 1998 | 73.6 | 67.4 | 75.1 | 71.5 | 68.2 | 62.6 |
| 1999 | 72.6 | 66.2 | 70.4 | 73.2 | 67.4 | 62.1 |
| 2000 | 70.9 | 67.6 | 75.9 | 77.4 | 73.3 | 64.9 |
| 2001 | 69.0 | 68.0 | 75.2 | 76.4 | 70.4 | 64.0 |
| 2002 | 71.0 | 68.3 | 71.6 | 73.3 | 70.2 | 63.5 |
| 2003 | 67.1 | 67.4 | 73.8 | 74.6 | 74.1 | 65.5 |
| 2004 | 70.8 | 66.8 | 70.5 | 72.9 | 70.9 | 63.9 |
| 2005 | 69.4 | 63.4 | 67.7 | 72.1 | 68.8 | 61.6 |
| 2006 | 67.8 | 64.6 | 70.9 | 71.8 | 71.6 | 65.9 |
| 2008 | 68.1 | 65.7 | 71.3 | 70.4 | 73.4 | 66.3 |
Figure 1.
Median proportion of self-reported dental visit from Behavioral Risk factors Surveillance system (BRFSS) 1995–2008 by Race/Ethnicity
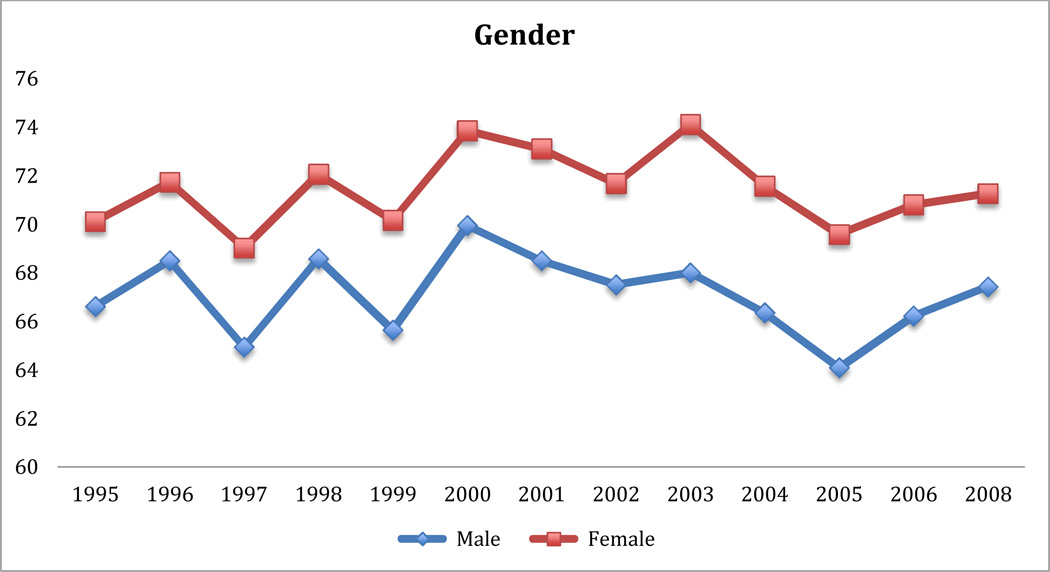
Females were consistently more likely to report a dental visit within the past year compared to males as evidenced by a consistently higher median percent of reported dental visit in the past year. Females self-reported a 70.1% (66.9%, 73.3%) annual visit in 1995 compared to a 66.6% (63.9%, 69.4%) for males in the same year. In 2008, self-reported median (95% C.I) dental visit increased slightly for females 71.3% (69.3%, 73.2%) and males self-reported median (95% C.I) visit of 67.4% (65.1%, 69.8%). The trends for both groups remained similar over time and the differences in reported dental visits between the groups were also constant at about a range of 4–5%. (Figure 2)
Figure 2.
Median proportion of self-reported dental visit from Behavioral Risk factors Surveillance system (BRFSS) 1995–2008 by gender
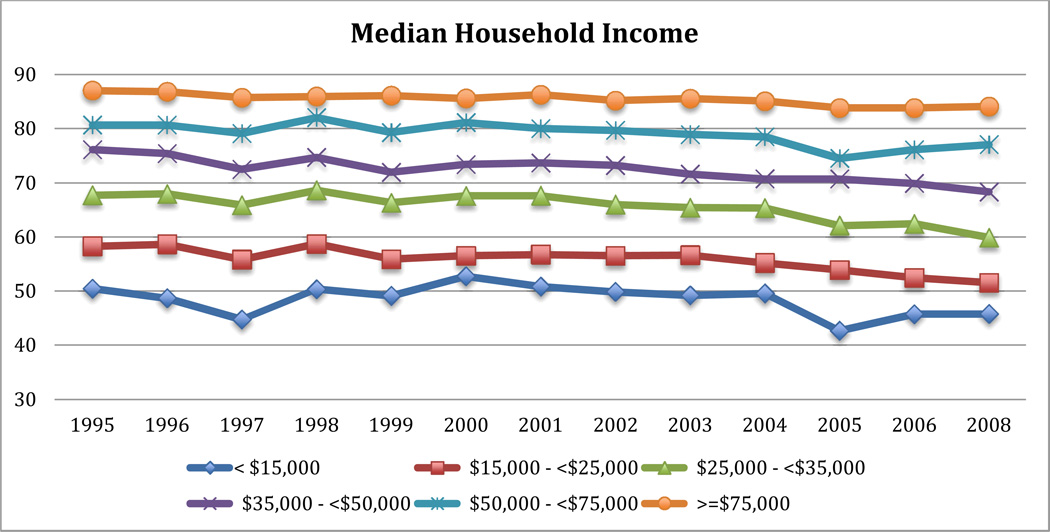
Trends in dental visit by household income remained flat with a slight decrease for all income categories. The difference between income groups remained relatively constant at about 10%. Individuals earning $75,000 or more were most likely to report seeing a dentist in the past year while those earning less than $15,000 were least likely to report seeing a dentist in the past year. For example, 84.1% (81.8%, 86.4%) of the highest income level reported a visit in the past year while only 45.8% (40.8%, 50.8%) of the lowest income earners did the same. (Figure 3)
Figure 3.
Median proportion of self-reported dental visit from Behavioral Risk factors Surveillance system (BRFSS) 1995–2008 by household income
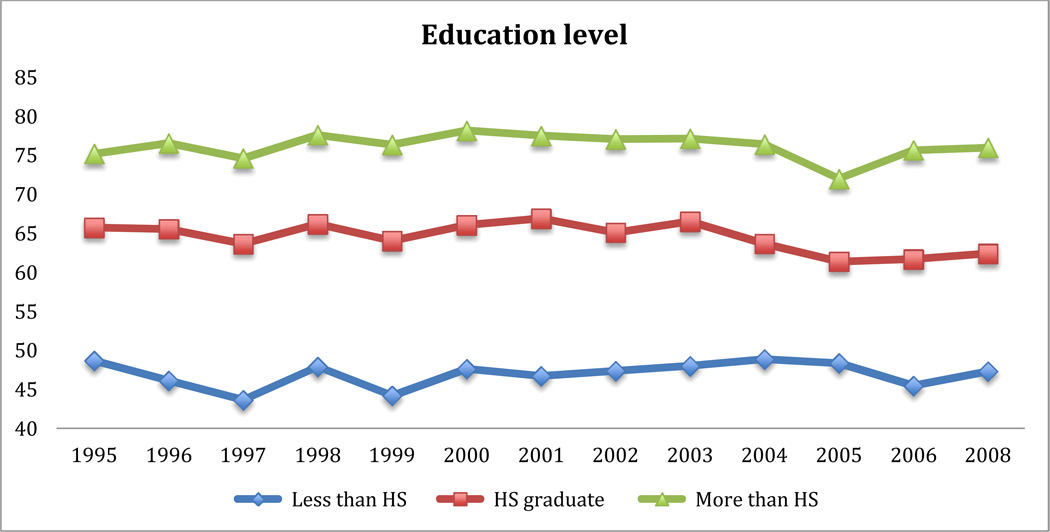
Just as the disparity in reported dental visit remained flat by income level, this relationship was also the case when educational status was examined. Specifically, individuals with more than a high school education consistently reported a higher dental visit in the past year compared to those with less than a high school or only a high school degree (Figure 4)
Figure 4.
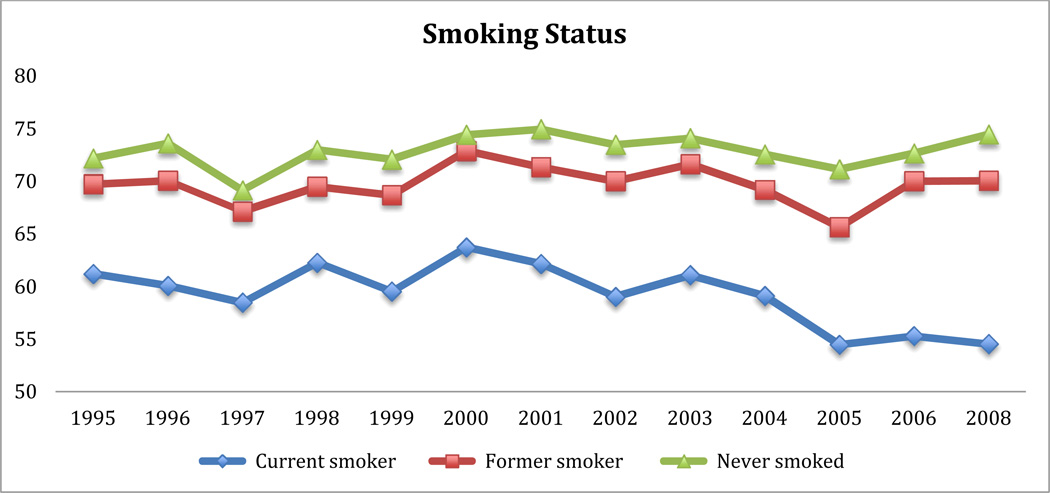
Median proportion of self-reported dental visit from Behavioral Risk factors Surveillance system (BRFSS) 1995–2008 by smoking status
The disparity in dental visit by smoking status between never and former smokers was about 3% between 1995 and 2008 with never smokers reporting a higher median annual dental visit. The disparity in reported dental visit between former smokers and current smokers however remained approximately at 10% between 1995 and 2008. (Figure 5)
Figure 5.
Median proportion of self-reported dental visit from Behavioral Risk factors Surveillance system (BRFSS) 1995–2008 by smoking status
Discussion
As the implementation of the Patient Protection and Affordable Care Act (PPACA) unfolds, millions of previously uninsured Americans will have access to health care. With the ambitious goal of ensuring quality and affordable health care for all Americans in a cost contained system, the PPACA will need to fundamentally transform how health care is delivered. Dental care however, remains on the fringes. Provisions under the PPACA does not require dental coverage in the Essential Health Benefit Package for those over the age of twenty-one (10). Nevertheless, it is widely recognized that oral health is essential to an adult’s overall health and well-being (11). The mouth reflects general health or disease status and oral fluids are increasingly been used as diagnostic tools for systemic diseases (2). Also, associations between systemic diseases such as diabetes, cardiovascular disease and oral health have been reported. Pain, a consequence of many conditions affecting oral health is associated with a reduction in quality of life, restricts daily functions and productivity in society. As such, the exclusion of dental benefits for adults could continue the existing utilization disparities, thereby suppressing the full potentials of the healthcare reform.
The overall trend in reported dental visit in the past year analyzing data from the BRFSS for the U.S. non-institutionalized adult population did not show any meaningful change for the years 1995 to 2008. The 1.3% increase although not statistically significant, represents more than a million individuals accessing dental care between the study periods. From this data source, it was unclear what type of dental services (i.e. preventive, basic restorative services, elective or emergency services) accounted for the majority of the increase in utilization as responses to dental care utilization questions reported in the NIDCR/CDC data query system aggregates all dental services received in the past year. The year 2000 had the highest reported median dental visit. Although a decline was observed in subsequent years, none decreased lower than the pre–2000 levels. This trend is probably attributable to the provision of less comprehensive dental services by the States and increased episodic dental care in the early 2000. We found an increased reporting of a dental visit in the past year compared to reporting of a dental visit of two years or more, suggesting that more people are utilizing dental care earlier rather than later. This earlier utilization could reflect the recent focus on oral disease prevention strategies at the state and local levels and the continued attention to the oral-systemic connection as clearly outlined in the year 2000 U.S surgeon general’s report (2).
Although dental visit in the past year has been on the decline for all age categories, individuals in the 18–29-age category reported the least number of visits probably due to rising health care costs, and lack of adult coverage in Medicaid. Individuals in the 65 and older age group consistently reported the highest proportion of dental visits in the past year. This is probably due to a greater tooth retention necessitating a need for regular maintenance dental care or a higher proportion of elderly females as females overall reported more dental visits compared to males. The consistently greater reports of dental visit in the past year by females may be a reflection of a higher health care seeking behavior among females compared to males.
To tease out the differences in reported dental visits by socio-demographic factors, reporting on specific types of dental service received would be helpful. The BRFSS and most of the other national surveys (except MEPS) lumps all these categories into one. Additionally, reporting on specific dental services would also be worthwhile because individuals at or near poverty have been reported to less likely obtain preventive services compared to their higher income peers (2). This represents a lot in tax payers dollars directed to more expensive restorative treatments for these individuals. Our results show low-income earners reporting the least number of dental visits in the past year; this could be a reflection of the fact that dental care utilization is driven by cost.
Our results are consistent with a 2012 study of the national health interview survey by Wall TP and colleagues. The study focused on the role of insurance coverage in accessing dental care, and reported income and age disparities in accessing dental care. The overall trend reported from 1997 to 2010 are similar to the estimates we reported (12)
Because of the difference in overall estimated trends among nationally representative surveys, stratum specific estimates of reported dental visits which have been reported to be similar across surveys (5) is recommended for program planning and policy recommendations.
Increased policy efforts including dental coverage in the Essential Health Benefit package for adults is paramount to increase access to oral health services and care. The scientific literature strongly supports the association between dental conditions such as periodontal disease with chronic health conditions such as cardiovascular disease, and diabetes. Oral health has been shown to impact self-esteem, self-image, performance and work productivity. Thus, the availability and accessibility of oral health care services is relevant to maintaining overall health and well-being.
Conclusion
Despite increasing cost of services, trends in dental visit have remained the same or slightly increased among non-institutionalized adults at least18 years old in the United States. There still exist disparities in dental care utilization by socio-demographic factors. These estimates were reported as median percentages hence States with very high or extremely low utilization are not reflected, as mean percentages would account for these variations. A comparison of self-reported utilization and actual utilization abstracted from dental records would provide the best assessment of overall dental visits for the United States.
Acknowledgments
This work was supported by the NIH/NIDCR training grant R90 DE022527
Contributor Information
Aderonke Akinkugbe, Department of Epidemiology, Gillings School of Global Public Health, 2101 McGavran-Greenberg Hall, CB #7435, University of North Carolina, Chapel Hill NC, 27599, aakinkug@live.unc.edu.
Evelyn Lucas-Perry, American Dental Education Association (ADEA), Department of Health Policy, The George Washington University, 2175 K Street, NW Suite 500, Washington, DC 20037, evelynlucasperry@gmail.com.
References
- 1.Dentistry AoG. White Paper on Increasing Access to and Utilization of Oral Health Care Services. 2008 [Google Scholar]
- 2.Watson MR, Manski RJ, Macek MD. The impact of income on children's and adolescents' preventive dental visits. J Am Dent Assoc. 2001;132(11):1580–7. doi: 10.14219/jada.archive.2001.0093. quiz 97. Epub 2002/01/25. [DOI] [PubMed] [Google Scholar]
- 3.DHHS. Healthy people.gov, Leading Health Indicators. Available from: http://www.healthypeople.gov/2020/LHI/oralHealth.aspx.
- 4.Macek MD, Manski RJ, Vargas CM, Moeller JF. Comparing oral health care utilization estimates in the United States across three nationally representative surveys. Health Serv Res. 2002;37(2):499–521. doi: 10.1111/1475-6773.034. Epub 2002/05/31. [DOI] [PMC free article] [PubMed] [Google Scholar]
- 5.Macek MD, Manski RJ, Vargas CM, Moeller J. Comparing oral health care utilization estimates in the United States across three nationally representative surveys. Health services research. 2009;37(2):499–521. doi: 10.1111/1475-6773.034. [DOI] [PMC free article] [PubMed] [Google Scholar]
- 6.Burt BA, Eklund SA. Dentistry, dental practice, and the community. Saunders; 2005. [Google Scholar]
- 7.Dolan TA, Atchison K, Huynh TN. Access to dental care among older adults in the United States. United States: J Dent Educ; 2005. pp. 961–974. [PubMed] [Google Scholar]
- 8.Prevention CfDCa. Behavioral Risk Factor Surveillance System. [cited 2013 February];2013 Available from: http://www.cdc.gov/brfss/.
- 9.Association M-CSD. Adult Dental Benefits in Medicaid: 50 States & Dist of Columbia. [cited 2013]; http://www.medicaiddental.org/2005 Available from: http://www.medicaiddental.org/Docs/AdultDentalBenefits2003.pdf. [Google Scholar]
- 10.Patient protection and Affordable Care Act; data collection to support standards related to essential health benefits; recognition of entities for the accreditation of qualified health plans. Final rule. Fed Regist. 2012;77(140):42658–42672. Epub 2012/07/28. [PubMed] [Google Scholar]
- 11.Evans CA, Kleinman DV. The surgeon general’s report on America’s oral health: opportunities for the dental profession. The Journal of the American Dental Association. 2000;131(12):1721–1728. doi: 10.14219/jada.archive.2000.0118. [DOI] [PubMed] [Google Scholar]
- 12.Wall TP, Vujicic M, Nasseh K. Recent trends in the utilization of dental care in the United States. J Dent Educ [Internet] 2012;76(8):1020–1027. [PubMed] [Google Scholar]


