

Genome-wide analysis of polyadenylation signals in Schizosaccharomyces pombe reveals conservation of the ubiquitous AATAAA motif. Heterogeneity of cleavage sites is common, as is alternative polyadenylation. Furthermore, different physiological conditions can have profound effects on poly(A) site usage. These data are accessible in a user-friendly database Pomb(A).
Keywords: polyadenylation, transcription termination, RNA-Seq, genome-wide, fission yeast
Abstract
Polyadenylation of pre-mRNAs, a critical step in eukaryotic gene expression, is mediated by cis elements collectively called the polyadenylation signal. Genome-wide analysis of such polyadenylation signals was missing in fission yeast, even though it is an important model organism. We demonstrate that the canonical AATAAA motif is the most frequent and functional polyadenylation signal in Schizosaccharomyces pombe. Using analysis of RNA-Seq data sets from cells grown under various physiological conditions, we identify 3′ UTRs for nearly 90% of the yeast genes. Heterogeneity of cleavage sites is common, as is alternative polyadenylation within and between conditions. We validated the computationally identified sequence elements likely to promote polyadenylation by functional assays, including qRT-PCR and 3′RACE analysis. The biological importance of the AATAAA motif is underlined by functional analysis of the genes containing it. Furthermore, it has been shown that convergent genes require trans elements, like cohesin for efficient transcription termination. Here we show that convergent genes lacking cohesin (on chromosome 2) are generally associated with longer overlapping mRNA transcripts. Our bioinformatic and experimental genome-wide results are summarized and can be accessed and customized in a user-friendly database Pomb(A).
INTRODUCTION
Transcription of coding genes is an essential process for every cell. The nascent transcript is cotranscriptionally cleaved at its 3′end and then further modified by poly(A) addition. This so-called poly(A) tail of eukaryotic mRNA plays a critical role in its nuclear to cytoplasmic export, mRNA stability, and translation. Failed polyadenylation leads to mRNA destruction (Zhao et al. 1999). Correct mRNA cleavage, polyadenylation, and transcription termination depend on the multipartite polyadenylation signal (PAS) (Winters and Edmonds 1973a,b; Gick et al. 1986; Proudfoot 1989; Wilusz and Spector 2010), encoded in the DNA and recognized by a group of polyadenylation factors (Zhao et al. 1999). PAS comprises an obligatory near upstream element (NUE), usually A(A/T)TAAA (Proudfoot 2011), and an auxiliary G/T-rich downstream element (DSE) in higher eukaryotes (Gil and Proudfoot 1984; McLauchlan et al. 1985). In plants and budding yeast, the DSE can be replaced by a T-rich efficiency element (EE) (Zhao et al. 1999; Graber et al. 2002; Sherstnev et al. 2012). The cooperative function of all PAS-elements is crucial, as defective 3′ end formation and termination may result in transcriptional read-through with consequent gene silencing (Gullerova and Proudfoot 2008; Gullerova et al. 2011).
Polyadenylation is a key regulatory mechanism. An absent or short poly(A) tail can mark the transcript for degradation, as shown in bacteria and plants (Steege 2000; Dreyfus and Régnier 2002; Lange et al. 2009; Chen et al. 2011). Moreover, in higher eukaryotes alternative PAS can lead to production of longer or shorter transcript isoforms (Tian et al. 2005). Genome-wide studies reveal widespread alternative polyadenylation (APA) in budding yeast and human genomes (Ozsolak et al. 2010) that generate mRNA of different lengths, which may contain different regulatory regions. These alternative transcripts can encode different proteins (Di Giammartino et al. 2011) or selectively provide a binding platform for regulatory elements, such as microRNAs (miRNA). Thus, miRNA may recognize a target seed sequence in a longer transcript, which leads to its selective degradation (Bartel 2009; Mayr and Bartel 2009). APA may occur at a specific cell cycle stage, or may relate to the developmental stage of the organism (Mangone et al. 2010; Di Giammartino et al. 2011; Sherstnev et al. 2012). A related phenomenon to APA is CS heterogeneity: In mammals and plants (Tian et al. 2005; Sherstnev et al. 2012) multiple CS often exist in close proximity to each other, yet share the same PAS. Finally, PAS located within the coding region can result in truncated protein sequence.
The fission yeast S. Pombe has a fully sequenced genome. This yeast's genomic organization resembles that of higher eukaryotes, and its high number of homologous genes related to human diseases fuel investigations in this yeast. A significant step toward understanding genomic function is the description of the gene transcript 3′ end formation and associated factors. Even so, this analysis has not been described in S. pombe at a genome-wide level. PAS are well defined in higher eukaryotes. In contrast, S. cerevisiae and S. pombe PAS are degenerate and other trans-acting factors may be required for correct transcription termination. Thus, it has been shown that convergent genes in S. pombe fail to terminate after proximal PAS, resulting in transcriptional read-through, producing overlapping long mRNAs and, consequently, long double-stranded RNA (dsRNA). The cohesin complex is recruited to chromatin in the cell cycle S-phase where it is concentrated by RNA polymerase II (Pol II) to intergenic regions between convergent genes (Schmidt et al. 2009). Here it blocks transcriptional read-through, and so leads to correct transcription termination (Gullerova and Proudfoot 2008).
Only a few gene-specific PAS, such as ura4 (Humphrey et al. 1994), have been studied experimentally in S. pombe. In contrast, in this study we have used RNA-Seq data sets isolated from cells grown under different physiological conditions. We bioinformatically extracted polyadenylated reads and mapped them back to the S. pombe genomic sequence. Our results reannotate 3′ UTRs of 4535 genes, including extensive examples of APA and heterogeneity. Strand-specific RNA-Seq reads were used to analyze cleavage sites, polyadenylation signals, alternative polyadenylation, and 3′ end heterogeneity, showing condition-specific cleavage sites. Furthermore, we observed general preference for the canonical AATAAA PAS in fission yeast genome. We validated our genomic analysis experimentally using RT-PCR analysis of the ura4 gene expressed from a plasmid. Different PAS were positioned downstream from the ura4 coding region to measure relative efficiency. Changes in transcript levels correlated to PAS efficiency (Gehring et al. 2001). We have also examined whether S. pombe genes containing AATAAA PAS possess any significant functional similarity. Finally, we investigated the extent of overlapping transcripts derived from convergent genes on chromosome 2 and their coincidence with cohesin peaks.
RESULTS
Poly(A) reads from RNA-Seq data sets were extracted from RNA and mapped back to the S. pombe genome sequence to identify the CS (Supplemental Fig. 1A; Materials and Methods). We present PAS analysis using strand-specific data for cycling cells in the main figures of the manuscript, while data from different growth conditions are summarized in the Supplemental Material. Results from all data sets are combined and accessible in our Pomb(A) database, which also allows customizable motif search around the CS.
We frequently observed multiple CS only a few nucleotides apart, a phenomenon we refer to as heterogeneity. Such heterogeneity is considered as a single CS to avoid motif over-representation (see Materials and Methods). Following these filtering criteria, we identified CS in 4741 genes, out of which 4535 have CS in their 3′ UTR (Fig. 1A). This corresponds to ∼90% of all S. pombe genes. In the strand-specific data set of cycling cells, 3093 CS were identified for 1964 genes, of which 843 were in tandem and 1121 in convergent orientation relative to their closest gene (Supplemental Table 2). CS for cycling cells (strand-specific and non-strand-specific data) were verified by 3′ rapid amplification of cDNA ends (3′RACE, Supplemental Fig. 1D). Three previously defined CS for act1 (1190, 1550, and 1800 nt downstream from the start codon) (Rissland and Norbury 2009) were also detected in our data sets. Overall, these data provide an independent validation of our computational approach.
FIGURE 1.

Analysis of S. pombe cleavage sites. (A) RNA-Seq data for all analyzed data sets mapped to 4741 genes, out of which 4535 had the CS mapped after the stop codon and 2565 within the ORF. The strand-specific RNA-Seq data for cycling cells, which was analyzed for significant PAS mapped to 2360 genes, of which 1964 had the CS mapped after the stop codon and 925 within the ORF. Out of these, 85 mapped to annotated introns within the ORF. (B) The number of RNA-Seq hits plotted against the internal cleavage number for genes that display internal cleavage (i.e., internal cleavage number presented on the vertical axis >0). (C) Average position of mapped CS relative to the stop codon dependent on the number and order of CS. Horizontal error bars correspond to one standard deviation. Percentage of genes with the displayed number of CS in the 3′ UTR, as well as all identified genes are indicated. (D) Distance between CS in genes with multiple CS after elimination of heterogeneity. (E) Positions of the RNA-Seq-derived CS with respect to the upstream stop codon (<1000 nt). (Left) Outcome for all CS; (right) the outcome for tandem and convergent genes; data are normalized to respective total number of sequences. (F) Heterogeneity of all CS: proportion of all CS numbers grouped into one CS for an individual separation of 6 nt. (G) Nucleotide composition around mapped CS, denoted as 0 (first nucleotide after cleavage).
Cleavage sites
We present here the analysis from strand-specific data, as this allows direct comparison with other RNA-Seq data, generated using the same protocol for cells grown under different conditions (meiotic and quiescent cells; see Materials and Methods). While most S. pombe genes in cycling cells possess a CS following their ORFs (1964 out of total 2360 genes), CS within an ORF can also occur (925) (Fig. 1A; all other data sets in Supplemental Table 3A). However, such intragenic CS are under-represented in ORFs and are very rare in introns (85 out of 925). We show this under-representation by comparing the total number of detected internal cleavage events to the total number of RNA-Seq reads, mapping to the same gene (Fig. 1B). Internal cleavage events increase with the number of RNA-Seq hits per gene. The number of these hits depends on gene expression level and length. More highly transcribed genes appear to result in more prevalent occurrence of internal cleavage events. Possibly degraded transcripts are detected as RNA-Seq hits, since these can be polyadenylated as part of the RNA turnover process (Schmid and Jensen 2008).
APA in 3′ UTRs was observed in 36.6% of identified genes (Fig. 1C; Supplemental Table 3B). As in mammals, S. pombe APA is common in 3′ UTRs but occurs less frequently in ORFs, where it causes different exon lengths and consequent protein variability (Yan and Marr 2005). A total of 44.4% of genes are alternatively polyadenylated, and we have plotted the average position of CS following ORFs based on the number of alternative sites (up to six CS). The high standard deviations (SDs) indicate that the CS position along the gene is highly variable (Fig. 1C). We also mapped the distance between multiple CS in one gene, and show that they still occur in close proximity to each other (Fig. 1D).
Next, we analyzed the distribution of CS downstream from ORFs using RNA-Seq CS-map coordinates, relative to gene orientation (Fig. 1E). In all tested data sets, median length for the 3′ UTRs is significantly longer between tandem genes compared with convergent genes (P< 0.05, two-tailed student t-test). In detail, the overall median distance is 187.5 nt. Tandem genes showed a slight preference for longer 3′ UTRs (median 199 nt) compared with all genes (median 187.5 nt), while the convergent genes had shorter 3′ UTRs (median 179 nt).
By considering close CS (separated by six or less nucleotides, see Materials and Methods for justification) as one, the large majority of CS (81.3%) displays no heterogeneity (Fig. 1F; Supplemental Fig. 4). Two CS are grouped in 11.2% of cases and <8% are groups of more than two CS. We also mapped the sequence distribution around all identified CS (Fig. 1G; Supplemental Fig. 5A). Three interesting regions can be observed from this distribution, where the most frequent nucleotides A and T swap: the region around −40 to −20 nt, containing potential NUE, and regions around −15 to −1 nt and 0 to 20 nt, possibly containing additional regulatory cis elements.
Variation of cleavage site usage under different growth conditions
All mapped CS can be found in the Pomb(A) database, with the corresponding usage profiles under different growth conditions for any gene of interest. Here, we present a few illustrative examples.
It is intrinsic to RNA-Seq data acquisition that certain sequence compositions will show a bias toward or against them. However, this bias is the same in every RNA-Seq experiment. We therefore cannot conclude whether one CS is used more with respect to another CS. However, we can compare the usage of the same CS between growth conditions. We chose two examples from our database to illustrate the difference in CS usage under different growth conditions. The gene SPBC16A3.02c has multiple CS, detected in each physiological condition (Fig. 2A). It is apparent that the major 3′ end CS is predominantly used in quiescent cells (24 h), possibly because this gene is more expressed in quiescent cells than in cycling cells (Bähler lab TranscriptomeViewer) (Wilhelm et al. 2008).
FIGURE 2.

Snapshot from the Pomb(A) database. Comparison of CS usage between data sets. The vertical axis presents a hit-score, which directly correlates with RNA-Seq hits for the depicted CS (see Materials and Methods). The hit-scores are derived for all data sets and all identified CS in the strand-specific data. All CS positions can be found in the database, where the precise hit-scores and data sets can be viewed more clearly by hovering over the bars. The profiles correspond to the genes (A) SPBC16A3.02c and (B) meu4. (C) Examples of alternative polyadenylation between cycling and meiotic cells (top), cycling and quiescent cells after 24 h (middle), and 7 d (bottom) of nitrogen starvation (see Results and Materials and Methods sections in the text for details). The full table of APA associated genes can be viewed in Supplemental Tables 8–10.
We also detected multiple CS for meu4, which has previously been described as a meiosis up-regulated gene (Watanabe et al. 2001) and its CS has been mapped 419 nt past the stop codon (Cremona et al. 2011). Our analysis confirms (within heterogeneity margin) and extends these findings by defining further alternative CS at low levels within the ORF (Fig. 2B). However, occurrence of internal cleavage events correlate with the high expression of the meu4 gene in meiosis, suggesting a relevance to mRNA degradation products.
We show three examples of three APA-associated genes under different conditions (Fig. 2C). The differences in PAS usage between cycling and meiotic cells (top), cycling and quiescent cells (24 h of nitrogen starvation, middle), and cycling and quiescent cells (7 d of nitrogen starvation, bottom) are depicted. The vertical axis marks the CS hit-score, while the horizontal axis represents the distance from the stop codon of the corresponding gene. We detect several examples of APA: the same CS is used in one condition, but not in the other (e.g., SPAC27F1.07 in meiotic cells, top); the same CS is used in both conditions, but with different intensity (e.g., SPAC343.09 in meiotic cells, middle) or a combination of both (e.g., SPAC660.11 in meiotic cells, bottom). The full table with candidate alternatively polyadenylated genes, including CS position and distance from stop codon, hit number, and hit-score can be found in the Supplemental Tables 8–10. We have computed P-values to estimate the significance of alternative PAS usage. We have performed a permutation test and a Fisher exact test and the results are in agreement. Full details of how either was performed can be found in the Materials and Methods. All Fisher exact test P-values <0.1 are reported in Supplemental Tables 8–10, in the columns corresponding to the data set where the CS appears to be used more. One should note that many CS are determined by few reads (≤2), many alternative CS are therefore reported without a significant P-value. Nevertheless, few reads do speak of a cleavage event and are reported as potential alternative CS, which require further experimental validation.
Cis elements close to CS
It is well established that cis elements play an important role in cleavage and polyadenylation of mRNA (Proudfoot 2011). We therefore searched for the most significant motifs of lengths 4–10 nt by scanning the 25 nt after the CS (therefore avoiding regions containing the potential NUE before the CS). The motif is ranked based on an initial filtering of over-represented motifs using a method utilized by Loke et al. (2005). This method ranks the motifs according to the difference of the maximum occurrence of the motif at a position in the scanned 25-nt region compared with a large interval occurrence median (see Materials and Methods). The top motif candidates are reranked to produce one top candidate according to the P-value of a cumulative binomial distribution throughout all analyzed sequences. This mimics the method used in the human PAS analysis performed by Beaudoing et al. (2000), which was also used in PAS analyses of other organisms (Sherstnev et al. 2012).
The top three motifs of 4–7-nt length are summarized in Figure 3A. The most frequent motifs are T/G rich and T-stretches. To verify our computational approach we used the Improbizer expectation maximization algorithm, which converged to TGTA, as did our own method (Fig. 3B). An expectation maximization algorithm (MEME) has also previously been used for PAS analyses (Retelska et al. 2006; Ozsolak et al. 2010). In the initial motif filtering, T-stretches are always present and they also display an interesting positional bias before and after the CS (Fig. 3C). All other presented motifs in Figure 3C are over-represented hexamers in the 25 nt past the CS. Since the EE is also expected to occur before the CS (Loke et al. 2005), we have plotted a 40-nt window centered around the CS.
FIGURE 3.

Analysis of potential motif sequence-mediating cleavage and polyadenylation. A 25-nt region after the CS was scanned for significant motifs. (A) The top three ranked motifs according to lowest P-value of lengths 4–7 nt. (B) Improbizer maximization expectation algorithm result when scanning the above-indicated region for over-represented motifs. (C) The distributions of the top 10 ranked motifs of length 6 around the CS are shown. The location of the motifs relates to the start of the motif. The A-rich peak before cleavage is partially due to the analytical procedure of considering the Adenosines as transcribed and not part of the added poly(A) tail. The T-stretches always rank highest in the preliminary ranking. This ranking is based on max(T-stretch)–med(T-stretch), where max denotes the maximal occurrence frequency at a nucleotide position (0–25 nt), while med denotes the median occurrence frequency over 3000 nt. Hence, the T-stretches were included in the analysis and plotted. (D) The distribution of the top 10 ranked motifs of length 4 around the CS is shown, as TGTA is the motif with the smallest P-value of all and the prevalent results of the Improbizer query. T-rich EE have been shown to occur before and after the CS, so the distribution before the CS is also plotted.
TGTA containing motifs rank high among the over-represented hexamers. Combining this with the Improbizer result, we also plotted 4-nt motifs with small P-values (Fig. 3D). The TGTA motif displays a large peak just before the CS. G and T seem to be of particular importance for the significant motifs around the CS. This is also apparent from the rise of T and G in the nucleotide distribution after the CS (Fig. 1G).
Upstream polyadenylation signals (NUE)
We scanned the region −50 to −6 nt (from the CS) for the most significant motifs of length 4–10 nt using the same method as described previously. We summarized the top ranked signals of lengths 4–7 nt in Figure 4A. The canonical human AATAAA NUE has the smallest P-value among all other hexamers, while the most dominant motifs of any other length are either subsequences of or contain AATAAA. This is supported by the Improbizer outcome (Fig. 4B). These data represent a notable similarity between fission yeast and human. Due to high frequency of T-stretches around the CS, we tested how many PAS contain an AATAAA motif before the CS and how many sequences have a T-stretch around the CS (Fig. 4C; see Supplemental Table 7 for all other data sets). The low P-value (<0.05) shows that the simultaneous occurrence of both motifs is rare, implying mutual exclusivity.
FIGURE 4.

Analysis of potential PAS. The region from −50 nt to −6 nt was scanned and motifs were ranked as before. (A) The top three ranked motifs according to lowest P-value of lengths 4–7 nt. (B) Improbizer maximization expectation algorithm results when scanning the above-indicated region for over-represented motifs. (C) Illustration of how many sequences have proposed the most dominant NUE and the supplementary signal. The P-values of such an overlap were computed by a left-sided Fisher exact test. (D) The distributions for the top 10 NUE motifs of 6-nt length ranked in the region of from −50 to −6 nt before the CS are shown. (E) The proportions of genes with the detected potential NUE. Genes containing a higher ranked NUE are not considered for the lower ranked series. (F) For comparison, the proportion of genes with human NUE is shown. Again, genes containing more significant NUE in humans are not considered for the less-significant ones.
We show the distribution of the top 10 NUE motifs of 6 nt length in Figure 4D (Supplemental Fig. 6A). The NUE in S. pombe are located ∼29 nt upstream of the CS, and the most frequent hexamer motif is AATAAA. We calculated the proportion of genes containing each of the top 10 motifs (exclusively) in their 3′ UTR upstream of the CS (Fig. 4D; Supplemental Fig. 6B). While AATAAA is the most frequent NUE in S. pombe (as in humans) the next nine most common NUE variants are different from human NUE variants (Fig 4E,F; Beaudoing et al. 2000). A striking difference is the drop in rank and positional specificity of the AATGAA motif (also apparent in the Improbizer outcome in Fig. 4B) in fission yeast (SD of 7.9 nt) compared with humans (SD of 10 nt). We also analyzed whether, in alternatively polyadenylated genes, proximal and distal sites show differences in PAS preference, but none was observed (Supplemental Fig. 5B). This is in contrast to mammalian APA, where the upstream PAS tends to be a noncanonical signal (Beaudoing et al. 2000).
This analysis can be repeated for any of the described data sets and any region of interest in the provided database Pomb(A).
Functional analysis of identified polyadenylation signals
We wished to verify the functionality of the computationally identified S. pombe PAS. Cells lacking the endogenous ura4 gene were transformed with pJR1-3XH plasmid constructs comprising a ura4 promoter, ura4 ORF, and one of five different PAS as follows: wild-type (WT) ura4 PAS (positive control), no PAS (negative control), sid4 PAS containing AATAAA, pep1 PAS containing AATGAA, and an artificial PAS derived from a pyp3 3′ flanking region fragment (Fig. 5A,E). This sequence consists of the 3′ UTR following the mapped CS by RNA-Seq, which possesses several different potential PAS motifs (Fig. 5B, top). This allows us to perform a competition experiment to test, which PAS motif is preferentially used. We used RNA isolated from cells transformed with each ura4 plasmid construct. For the artificial pyp3 PAS plasmid we detect bands corresponding to the two canonical NUE AATAAA sequences (Fig. 5B, bottom) with the shorter being more dominant. No products corresponding to AATGAA or the T-stretches were detected. To measure PAS efficiency, we performed a qRT-PCR experiment to quantify the amount of ura4 transcription derived from each PAS-containing plasmid, since PAS efficiency determines mRNA levels (Gehring et al. 2001). The cloned ura4 PAS contains all sequence elements necessary for efficient 3′ end formation (Humphrey et al. 1994) and produces the highest level of functional ura4 transcripts (Fig. 5C). The most dominant CS of ura4, when located on the plasmid, is preceded by an AATAAA motif (3′RACE) (Fig. 5D). Similar levels of ura4 mRNA were detected in strains with AATAAA PAS (sid4 and pyp3) (Fig. 5C). All ura4 expression levels are based on three biological repeats with a P-value of <0.05 vs. the negative control, by a two-tailed student t-test. Finally, the strain containing the second most significant motif AATGAA (Fig. 4A) shows ura4 transcription levels very similar to the negative control.
FIGURE 5.

Functional analysis of identified PAS. (A) Plasmid pJR1-3HX was modified to contain ura4 ORF and promoter. Indicated PAS candidates were cloned into the 3′ region located 83 nt downstream from the ura4 stop codon. (B) 3′RACE set up for the artificial PAS consisting of a pyp3 3′ flanking region fragment. Primers: (1) 20 nt before the end of the ura4 ORF; (2) at the start of the PAS. Distances for possible NUE from the start of the PAS are marked. (83 nt) The distance from the ura4 ORF to the inserted terminator, where the restriction sites were located. The 3′RACE outcome is presented, where “−” is the control lane without reverse transcriptase (RT), lane 1 corresponds to Primer 1, and lane 2 to Primer 2 in the diagram above. (C) qRT-PCR outcome of levels of ura4 transcription. (D) 3′RACE experiment set up for ura4 transcription on the plasmid. Forward primer was 20 nt before the end of the ura4 ORF. Band corresponds roughly to the second CS, which follows AATAAA. The 3′RACE outcome is presented below. (E) Inserted PAS sequences. (Bold, larger, underlined) 1st base after CS. (Underlined) Proposed NUE. ura4: RNA-Seq yielded first CS, previously identified other two CS, PAS, and EE (underlined).
Next, we investigated whether genes possessing particular PAS can be grouped based on their biological function. Genes containing each of the top 10 PAS were compared against ∼3700 GO lists (Gene Ontology annotation lists). Only genes containing AATAAA showed significant enrichment in the GO category. This class of genes is associated with general cellular functions, mainly relating to translation (Fig. 6A).
FIGURE 6.

Comparative analysis of NUE. (A) Comparison of NUE containing genes to ∼3700 GO lists. The P-value was computed by Fisher exact test and corrected for multiple testing by FDR. (B) Box plot for the sizes of the transcript overlaps (≥50 nt) between convergent genes on chromosome 2 with or without cohesin peaks.
Analysis of overlapping transcripts derived from convergent genes
Transcription of some convergent genes in S. pombe fails to terminate after their proximal PAS in the G1 phase of the cell cycle. This results in transcriptional read-through, overlapping transcripts, and consequent long dsRNA production. This in turn activates the RNAi pathway and leads to gene silencing. It has been previously proposed that the cohesin protein complex promotes transcription termination between convergent genes in G2 (Gullerova and Proudfoot 2008). Cohesin is loaded onto chromatin in S phase and is pushed by an active RNA polymerase II. Sites of cohesin localization on the chromosome are exclusively between convergent genes (Schmidt et al. 2009). Overlapping transcripts (overlap >50 nt) between convergent genes for 38 loci are identifiable on chromosome 2 in cycling cells (Fig. 6B). Transcripts overlapping at cohesin sites are significantly smaller than at sites lacking cohesin (student t-test, P < 0.1). Most of the cycling cells in S. pombe are in the G2 phase of the cell cycle with only 10% of cycling cells in G1. It is possible that the larger overlaps at cohesin sites are derived from cells that are in G1.
DISCUSSION
We have analyzed RNA-Seq data from five different data sets. When mapping CS one is always presented with the danger of not detecting CS, mapping of nonexistent CS, and mismapping of CS. To analyze PAS we chose specificity over sensitivity. Therefore, this study should be complemented in the future by further investigations that are more sensitive to CS detection. One should note that in the non-strand-specific data the numbers of detected CS and identified genes are fourfold higher in comparison to the strand-specific data sets, even though the initial number of reads is comparable. The experimental procedure to obtain the strand-specific data was different, as the non-strand-specific reads come from libraries primed with a poly(dT) primer, while the strand-specific ones use “random” RNA–RNA ligation. Data obtained by the first protocol is therefore bound to contain more poly(A) reads. As we are comparing several growth conditions, only data derived from equivalent protocols is presented in the main Results section. The analysis for the non-strand-specific data can be accessed in the Supplemental Material and the in the database.
A feature of RNA-Seq is the copying of RNA to cDNA, which comes with a set of caveats. These include template switching and internal priming (for review, see Proudfoot 2011). Moreover, RNA selection using the poly(A) tail could cause the sequencing of transcripts that were polyadenylated by alternative polymerases and marked for degradation (Schmid and Jensen 2008). The latter two issues are addressed below, whereas template switching does not present a problem when mapping CS. Template switching refers to the process of a nascent cDNA changing RNA template by annealing to another template with a similar sequence. If the nascent cDNA were to reanneal to a polyadenylated RNA, our mapping procedure would still discard it, as it would not map to a genomic region perfectly. In another scenario, it would still determine a real CS regardless of the initial template, because of sequence similarity.
Eukaryotic PAS define the 3′ ends of mRNA and comprise independent cis elements such as NUE and EE. We have analyzed NUE and motifs flanking the CS in S. pombe at a genome-wide level. Most S. pombe genes contain multiple alternative CS and/or heterogeneous CS both at the end and inside the ORF (Fig. 1A). This is consistent with a recent study performed in S. Pombe (Mata 2013), but contrasts with higher eukaryotes, where internal CS are infrequent. We identify 395 genes with apparent CS only inside the ORF under particular growth conditions (cycling cells). We have carefully excluded internal priming (Step 3 of the mapping procedure, see Materials and Methods and Supplemental Fig. 1A), so possibly these intragenic CS give rise to nonfunctional proteins and, hence, control expression of highly transcribed genes such as act1 in cycling cells and meu4 in meiotic cells (Fig. 2B,C). However, polyadenylation is well known to serve as a marker for degradation in bacteria (Steege 2000; Dreyfus and Régnier 2002) and plants (Lange et al. 2009). Chen et al. (2011) have further shown that the addition of an unusually long poly(A) tail (“hyperadenylation”) to mRNA leads to degradation in S. pombe. Other cases of polyadenylation for RNA degradation are also known in S. cerevisiae (Kuai et al. 2004). The additional fact that internal cleavage amounts correlate with gene expression levels and/or gene length (Fig. 1B) suggests that these detected CS are likely to be derived from degradation products in most cases. This could therefore also extend to some CS identified in the 3′ UTRs, though here they are more likely to be real. Identification of real truncated and functioning transcripts remains to be investigated further. These could be considered as noncoding, as they lack a stop codon, but they still have an important regulatory function. CS in introns of S. pombe are rare, similar to Arabidopsis thaliana (Sherstnev et al. 2012), which could reflect a common mechanism that restricts intronic CS in these two eukaryotes. Such a process may involve U1 snRNA, which is known to restrict premature polyadenylation in mammalian introns (Kaida et al. 2010; Berg et al. 2012). The nucleotide distribution profile around the CS demonstrates the similarity of S. pombe 3′ UTRs to other higher eukaryotes, fungi, and plants (Retelska et al. 2006; Ozsolak et al. 2010). Another similarity includes a median 3′-UTR length of 187.5 nt, which is close to the 166-nt median 3′-UTR length in S. cerevisiae (Ozsolak et al. 2010). Furthermore, the larger 3′ UTRs for tandem genes compared with convergent genes is consistent with their larger intergenic regions (Bähler and Wood 2003). Certain CS are more common (more RNA-Seq hits) under certain physiological conditions (Fig. 2A). This confirms that CS selection also depends on the developmental and physiological stage of the cell (Mangone et al. 2010; Di Giammartino et al. 2011; Sherstnev et al. 2012).
We have computed P-values to determine the significance of CS usage under different growth conditions. Care needs to be taken, as some genes might be considered alternatively polyadenylated by having three or more sites, which vary between conditions. This could show that a CS has a significantly higher usage in one condition over another. However, it might turn out that the other condition also has a highly used CS only a few nucleotides away, which might still be within the heterogeneity margin. Though we were careful not to consider this as an alternative polyadenylation in its own right, it might arise as an artefact from considering the gene alternatively polyadenylated for other reasons. This kind of analysis, which assumes the independence of CS, might fail to consider that one CS is discriminated in favor of another, which is then reversed in another condition. However, by considering the CS to be independent, this occurrence will go unnoticed. Therefore, the full list of possibly alternatively polyadenylated CS, regardless of the P-values, is presented in Supplemental Tables 8–10. Many CS have only a few reads (≤2) mapping to them, rendering the data insufficient to draw statistically significant conclusions of an alternative polyadenylation event. These CS are reported as candidate-alternative CS, but require further experimental validation, possibly by improving sequencing depth.
It has previously been noted that efficient 3′ end formation of the ura4 gene in S. pombe requires a site-determining element (NUE) and an efficiency element (EE) (Humphrey et al. 1994). Considering that the EE is following the CS, our motif search across 4–10 nt yielded mostly sequence motifs containing GT. We detect TGTA as the most significant EE in fission yeast. Interestingly, this has previously been identified as part of the far upstream element in humans and budding yeast (Graber et al. 1999; Venkataraman et al. 2005) as well as in plants (Rothnie et al. 1994), including rice (Shen et al. 2008a). In algae PAS are different from other eukaryotes, mainly due to their G-rich 3′ UTRs. Notably, TGTAA forms the NUE in this organism (Shen et al. 2008b). In fission yeast the TGTA-containing motif occurs even further downstream. This is likely due to the higher frequency of Gs over Cs after the CS, which is different in plants (Shen et al. 2008a; Sherstnev et al. 2012) and budding yeast (Ozsolak et al. 2010). Furthermore, the identified sequences (especially ranked 3 and 10) show high-sequence similarity to the previously described RNA 3′ end signals TTTTTT/TTTTAT/TTTTCT in budding yeast (Graber et al. 2002), suggesting an evolutionary conserved function in 3′ end formation. OligoT-stretches always rank high in the first steps of the ranking procedure, but are disregarded in the later steps due to a high P-value. Since T and TT are frequent in the 3′ UTR, this could be due to a bias in the Markov model, which approximates the probability of certain motifs based on the frequencies of single and dinucleotides. In addition, T-stretches and our determined most significant hexamer NUE AATAAA (Fig. 4A) rarely occur together in one PAS. This fact, together with the high frequency of T around the CS, suggest an influence on CS efficiency or a potential compensatory function of T-stretches, if the NUE is not otherwise recognized by the polyadenylation machinery. AATAAA is the most efficient functional motif to serve as a NUE element in S. pombe (Fig. 5B,C). In agreement with this, AATAAA is also found 30 nt before the CS with most RNA-Seq hits in meu4. This CS is detected in the non-strand-specific data from cycling cells (within a heterogeneity window), which include a minority of meiotic cells. However, even though AATAAA is the most conserved PAS throughout the genome, it only occurs in slightly above 20% of all 3′ UTRs, which is a lower frequency than found in flies, worms, and mammals (Yan and Marr 2005; Retelska et al. 2006; Mangone et al. 2010). Nevertheless, this still displays a higher conservation in fission yeast than in plants (Loke et al. 2005).
It has been shown in human APA that the 3′ distal PAS mainly uses the canonical AATAAA NUE, while the proximal PAS uses noncanonical signals (Beaudoing et al. 2000). In S. pombe we do not see this positional preference for NUE, implying that PAS selection in genes that display APA is an individual process specific to that gene. It has also been noted that in the case of mammalian APA the proximal PAS is preferentially used over the distal (Denome and Cole 1988) unless distal PAS has a stronger NUE (Legendre and Gautheret 2003). Our 3′RACE data obtained for the ura4-pyp3 gene construct confirms this. Two observed CS correspond to AATAAA, and the proximal CS is stronger than the distal one (Fig. 5B). Interestingly, AATGAA always ranks second for all strand-specific data sets in S. pombe. This motif ranks as the highest NUE motif in Aspergillus oryzae (Tanaka et al. 2011), emphasizing the evolutionary conservation of the PAS sequence motifs across some organisms. However, the mutation of AATAAA to AATGAA can lead to loss of PAS function in humans (Bennett et al. 2001). Our experimental analysis shows that the wild-type ura4 AATAAA NUE functions more efficiently than the same AATAAA NUE derived from sid4 (Fig. 5E). It should be noted that the ura4 PAS contains a defined EE (Humphrey et al. 1994), which acts with the NUE to promote efficient RNA 3′ end formation. There is no detectable EE in the sid4 PAS, even though it does contain TG-rich elements. The importance of AATAAA is underlined by the observation that only genes containing the canonical AATAAA NUE are enriched for a functional GO category. It has been suggested that PAS efficiency depends on the secondary structure formed by the mRNA (Loke et al. 2005). This could provide an explanation for the loss of polyadenylation function of AATGAA. We suggest that yeast does not possess efficient PAS elements throughout the whole genome, and may therefore rely on additional trans-acting. For example, it has been shown that the cohesin protein complex prevents transcriptional read-through between convergent genes, and consequently leads to transcription termination after the proximal PAS (Gullerova and Proudfoot 2008). Our data (Fig. 6B) provide further evidence that convergent genes lacking cohesin in their intergenic regions are, in general, associated with longer mRNA overlaps.
Overall, our data redefine previously annotated 3′ UTRs in S. pombe. Our analysis can be generally accessed by operating our user-friendly database Pomb(A). This is a tool used to visualize all CS and identified PAS in S. pombe, and so allows comparison of CS usage between physiological conditions. Our database permits the user to search for the most significant sequence motifs as well as defined motifs of interest. We believe that the Pomb(A) database will be a new tool for the S. pombe community, especially for studies requiring identification of PAS and indication of conditional isoforms.
Data access
Currently the Pomb(A) database can be accessed with any web browser (Google Chrome recommended) under www.pomba.co.uk.
MATERIALS AND METHODS
Data generation
Data for non-strand-specific cycling cells was obtained from Wilhelm et al. (2008), for strand-specific cycling cells and for quiescent (24 h) cells from Marguerat et al. (2012). A summary of their generation and Arrayexpress accession numbers can be found in Supplemental Table 11.
The meiotic pool and quiescent cells (7 d) were prepared in this study and sequenced with the following procedures (sequencing was carried out as in Marguerat et al. 2012). Again, Arrayexpress accession numbers can be found in Supplemental Table 11.
Meiotic
Fission yeast pat1-114 cells (ade6-M210/ade-M216 pat1-114/pat1-114 h+/h+) were grown to mid-log phase at 25°C in Edinburgh Minimal Media (EMM). Cells were washed twice in EMM without nitrogen source (EMM-N) and cultured for 12 h in EMM-N at 25°C. The culture was then supplemented with 0.5 g/L of NH4Cl and shifted to 34°C. Samples were collected for RNA preparation just before, and every hour for 8 h after shifting the culture to 34°C. Equal RNA amounts from each time-point were pooled and used for sequencing library preparation.
Quiescent (7 d)
972h- cells were grown to mid-log phase at 32°C in EMM. Cells were washed twice in EMM without nitrogen source (EMM-N) and grown for a further 7 d in EMM-N at 32°C.
Extraction of CS
Strand-specific RNA-Seq data from two combined data sets of cycling cells, meiosis arrested cells, quiescent cells after nitrogen depletion for 24 h and 7 d were filtered for polyadenylated reads (Step 1, Supplemental Fig. 1A) and mapped back to the S. pombe genome. The minimum of five consecutive adenine (A) residues (poly(A) tail) at the end of each read was taken as indicative of a polyadenylated read (cf. Mangone et al. 2010). The same was done for non-strand-specific data from cycling cells, but the original set of reads was also complemented and reversed. We permitted one non-A in the poly(A) tail (before the final 5 nt), as this could be a misread in the RNA-Seq procedure.
In Step 2 each strand of each S. pombe chromosome was scanned for each sequence before the tail. The expected overlap of the sequence g with the genome (“correctness” for the sequence g) is given by
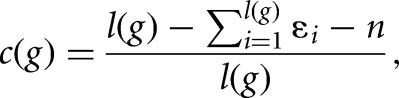 |
where l(g) is the length of g before the start of the poly(A) tail, n is the number of unrecognized bases N, ɛi is to be the error-probability derived from the quality score for base i (which is not N, nor in the poly(A) tail). In order to map a read g before the poly(A) tail to the chromosomes, the minimal agreement between the two sequences must be at least c(g). An agreement of 85% was chosen for computational efficiency, which corresponds to the expected smallest “correctness” for at least 92% of the polyadenylated sequence reads (Step 2a). Due to the short length of reads in non-strand-specific data this agreement was raised to 95% in that set.
We refer to the first nucleotide after cleavage as the CS. If an agreement of 85% (or 95% in non-strand-specific data) was reached, a preliminary CS was proposed under the following conditions:
The CS was mapped to after any A-s in the chromosomal sequence overlapping the first nucleotide of the poly(A) tail (Step 2b).
If the nucleotide of a proposed misread in the poly(A) tail is also found after the RNA-Seq read mapping in the corresponding position of the chromosome (Step 2c): the chromosomal sequence has 65% of A-s overlapping the poly(A) tail before the supposed misread, then CS is moved accordingly to after this falsely proposed misread. This step also occurs in combination with the previous condition. For both conditions the poly(A) tail length of the RNA-Seq reads is recalculated.
In step 3 we have eliminated internal priming by excluding sequences, whose recalculated poly(A) tail length was <5 nt. The chromosomal sequence must have <65% of A residues overlapping with the poly(A) tail to eliminate the possibility that the read is not polyadenylated, but ends in a stretch of A-s, which are also found within the genome (in Steps 2 and 3, 65% threshold was chosen because one sequence of correctness 35% has been observed).
In step 4 we considered a sequence that maps multiple times to the genome. The map with the closest correspondence or closest downstream from an ORF was selected. See Supplemental Figure 1A for an illustration of this data-filtering procedure. CS were attributed to a gene if they mapped inside its ORF or 1000 nt downstream from the stop-codon.
Heterogeneity of CS was eliminated by grouping CS with an individual separation between two consecutive CS of, at most, 6 nt into one—either the one with most RNA-Seq reads mapping to it, or otherwise the one with the shortest distance to the stop codon. The CS grouping based on an individual separation of 6 nt means that two different CS are at least 7-nt apart. We chose the individual separation for grouping to be 6 nt due to the following biological and computational reasons. First, the possibility of the miRNA existence is not excluded in S. pombe, as RNAi machinery is present and hairpin structures were shown to induce gene silencing. In higher eukaryotes, mature miRNAs bind to transcripts via imperfect base-pairing. The most important binding region for the ∼22-nt miRNAs is a ∼7-nt long seed region (Lewis et al. 2003). A 7-nt separation of CS would therefore be enough to provide a binding platform for a potential miRNA without giving it the opportunity to counteract planned cleavage. Furthermore, in Supplemental Figure 1B we plot the total number of detected CS vs. the individual separation. It is apparent that the decrease in the number of CS becomes smaller after the individual separation of 6 nt is passed. Finally, the maximal distance between the first and last CS of one group is >30 nt, with the individual separation of 6 nt (Supplemental Fig. 1C). It increases further with increasing individual separation. CS of 30 nt apart are unlikely to use the same NUE, as the location of NUE is expected ∼30 nt before the CS (Fig. 4C).
When considering CS positioning profiles with respect to their number per gene and order (Fig. 1C), unidentified sites following the ORF could affect the number of CS per gene, the order as well as the mean and standard deviation.
CS usage and APA across physiological conditions
The number of polyadenylated RNA-Seq reads mapping to the CS was counted for each strand-specific data set separately and normalized to the total number of RNA-Seq reads within the data set. Numbers were rescaled by a factor 108 to give the computed hit-scores in the CS-usage comparison across conditions. A bar plot across the whole genome of the hit-scores against the CS coordinate was plotted and can be accessed in the Pomb(A) database (Fig. 2). To compare CS usage in meiotic and quiescent cells (24 h and 7 d) with cycling cells, the absolute value of the difference in hit-scores for each CS was calculated and plotted as bars against CS coordinates. If the hit-score was larger in cycling cells, the bars are pointing upward. For any other data set they are pointing downward (see database Pomb(A)).
The same scoring was performed for determination of cross-conditional APA. Genes with CS detected in both cycling cells and meiotic/quiescent cells (24 h or 7 d) were candidates for APA (if one of the conditions did not display a CS, this either speaks of condition-specific genes or renders the cross-conditional comparison impossible).
Genes were considered to have alternative CS if there were at least two distinct CS, one of which displayed greater usage in one condition and the other in the other condition. Greater usage means:
If both conditions had the same CS identified, one of them must show at least a threefold higher hit-score compared with the other.
If the CS was indentified only in one condition, no CS was mapped within a distance of 20 nt around it to avoid its falling within the heterogeneity window of the other.
Motif search
Within each region around the CS, we consider the interval I1 of interest of length l1. A possible signal of length W was searched within I1. I1 was scanned for all possible motifs of length W consisting of 4 nt (4W possible motifs). A profile of motif-frequency in each nucleotide position close to the CS was created for each identified motif. The motifs were then ranked according to the difference between the maximal occurrence within I1 and the median in the 3000-nt region (cf. Loke et al. 2005). The top 10 ranked motifs were re-ranked: The one with the smallest P-value according to the cumulative binomial distribution across the sequences was considered to be the most significant. All CS with the most significant motif in the interval of interest were excluded, and the process was repeated on the remaining examples until 10 motifs were identified. These were then plotted for their distribution profile around the CS.
Statistical analyses
Alternative polyadenylation
To estimate the significance of alternative CS usage (APA), we have performed a permutation test and a Fisher Exact. The permutation test assumed the cleavage sites to be independent. Comparing CS usage between cycling and (e.g.) meiotic cells, there are 6612 and 2000 polyadenylated reads, respectively (as well as 9582 in quiescent 24 h and 8236 in quiescent 7 d). Looking at one particular CS, suppose it gets n1 hits in cycling cells and n2 hits in meiotic cells. The statistic was taken to be n2/2000–n1/6612. If the CS was not detected in cycling or meiotic cells, then n1= 0 or n2= 0, respectively. A total of 1000 permutations was performed by splitting all polyadenylated reads of meiotic and cycling cells combined randomly into groups of 2000 and 6612 elements. This yielded a distribution for the statistic. If the observed value falls in the left tail of the permutation test distribution, then the CS is significantly used more in cycling cells. If it is in the right tail, then the CS is significantly used more in meiotic cells. The equivalent tests were performed for the quiescent data sets. The Permutation Test provides an approximation to the P-values. To compute them exactly, we also performed a Fisher exact test based on the contingency table as illustrated in Supplemental Table 12. Note that if the cycling cells use the particular CS more, we computed the P-value according to the left-tailed test, otherwise according to the right-tailed test.
All Fisher exact test P-values <0.1 are reported in Supplemental Tables 8–10, in the columns corresponding to the data set where the CS appears to be used more.
Motif search
Cumulative binomial distribution: P-values were calculated based on a first order Markov model and a cumulative binomial distribution. Taking all I1 next to each CS, the probability P of a motif abcdef (each letter representing 1 nt) occurring in a fixed position was approximated by the first order Markov model
 |
where f(x) is the frequency of the nt(s) x in all regions between stop codons and mapped CS. Then, the probability p of the whole interval containing the motif was determined to be 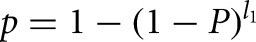 . Accordingly, the P-value for the observed number of intervals containing the motif was determined using the cumulative binomial distribution.
Improbizer results are based on 512 3′-UTR sequences in the region of interest around the CS for each data set. The background model is based on a zero order Markov model.
Fisher exact test: P-values were calculated based on the Text-NSP-1.25 CPAN Perl Module.
Cloning and S. pombe transformation
ura4 promoter and ORF were cloned into plasmid pJR1-3XH into Pst1 and Xho1 restriction sites. T4 DNA ligase was used for ligation. XL1 competent cells were transformed and grown on ampicillin plates, colonies were processed with the Qiagen Miniprep Kit. Different PAS were PCR amplified from S. pombe genomic DNA and purified by a Qiagen PCR Purification Kit, then they replaced the nmt1 PAS by repeating the previous cloning process using restriction sites Sac1 and Xma1. An S. pombe strain lacking endogenous ura4 gene (ura4-D18) was grown in rich medium and transformed with plasmid constructs by LiOAc transformation (Bähler et al. 1998). Samples were plated on –His plates to select for positive colonies containing the plasmid.
RNA analysis, 3′RACE, and PCR
RNA from the S. pombe wild-type 972 strain was purified by acid phenol, and DNase I (Roche) treated. The extracted RNA (2 µg for cleavage site verification and 500 ng for motif analysis) was reverse-transcribed by using the phased d(N)T oligonucleotide, 10 mM dNTPs, 1 µL of Superscript III reverse transcriptase (Invitrogen), 4 µL of 5x first-strand buffer, 0.1 M DTT, in a final volume of 20 µL. Real time PCR reaction was set up with Sensimix (Qiagen) and a 1:2 dilution of the RT-PCR product. qPCR was performed with 250 ng of DNA. We quantified the amount of plasmid in each strain by using a primer specific to plasmid sequences in the PCR reaction. ura4 expression was determined by the amount of detected ura4 polyadenylated transcripts with respect to the amount of plasmid.
The cDNA was PCR amplified by gene-specific forward oligonucleotides (1 µL) and linker (1 µL) added to 5 µL of 10x Thermo Buffer, 75 mM MgCl, 10 mM dNTPs, 2 µL of Taq Polymerase (Invitrogen) in a final volume of 50 µL. The PCR mix was cycled 40 times to: heat activation at 95°C for 5 min, denaturation step at 95°C for 1 min, annealing step at 50°C–54°C (depending on primer Tm) for 1 min, elongation step at 72°C for 1 min, final elongation at 72°C for 5 min. A total of 20 µL of the product was visualized on a 1.5% agarose gel.
SUPPLEMENTAL MATERIAL
Supplemental material is available for this article.
Supplementary Material
ACKNOWLEDGMENTS
We thank Konrad Krawczyk for valuable advice and support. This work was supported in part by the King Abdullah University of Science and Technology (KAUST) (KUK-C1-013-04); the Engineering and Physical Sciences Research Council (to M.S.); the L'Oreal/UNESCO Woman in Science UK and Ireland award (to M.G.), the MRC Career Development Award (to M.G.); the Wellcome Trust Senior Investigator Award (to J.B.), the Wellcome Trust programme grant (to N.J.P.), and the European Research Council grant agreement (239870 to R.E.); Royal Society for a University Research Fellowship; Brasenose College, University of Oxford (to R.E.); a Nicholas Kurti Junior Fellowship (to R.E.); and the Leverhulme Trust Philip Leverhulme Prize (to R.E.).
Footnotes
Freely available online through the RNA Open Access option.
REFERENCES
- Bähler J, Wood V. 2003. The genome and beyond. In The molecular biology of Schizosaccharomyces pombe: Genetics, genomics and beyond (ed. Egel R), pp. 13–26. Springer, Heidelberg, Germany. [Google Scholar]
- Bähler J, Wu J-Q, Longtine MS, Shah NG, McKenzie A III, Steever AB, Wach A, Philippsen P, Pringle JR. 1998. Heterologous modules for efficient and versatile PCR-based gene targeting in Schizosaccharomyces pombe. Yeast 14: 943–951. [DOI] [PubMed] [Google Scholar]
- Bartel DP. 2009. MicroRNAs: Target recognition and regulatory functions. Cell 136: 215–233. [DOI] [PMC free article] [PubMed] [Google Scholar]
- Beaudoing E, Freier S, Wyatt JR, Claverie J-M, Gautheret D. 2000. Patterns of variant polyadenylation signal usage in human genes. Genome Res 10: 1001–1010. [DOI] [PMC free article] [PubMed] [Google Scholar]
- Bennett C, Brunkow M, Ramsdell F, O'Briant K, Zhu Q, Fuleihan R, Shigeoka A, Ochs H, Chance P. 2001. A rare polyadenylation signal mutation of the FOXP3 gene (AAUAAA–>AAUGAA) leads to the IPEX syndrome. Immunogenetics 53: 435–439. [DOI] [PubMed] [Google Scholar]
- Berg MG, Singh Larry N, Younis I, Liu Q, Pinto Anna M, Kaida D, Zhang Z, Cho S, Sherrill-Mix S, Wan L, et al. 2012. U1 snRNP determines mRNA length and regulates isoform expression. Cell 150: 53–64. [DOI] [PMC free article] [PubMed] [Google Scholar]
- Chen H-M, Futcher B, Leatherwood J. 2011. The fission yeast RNA binding protein Mmi1 regulates meiotic genes by controlling intron specific splicing and polyadenylation coupled RNA turnover. PLoS One 6: e26804. [DOI] [PMC free article] [PubMed] [Google Scholar]
- Cremona N, Potter K, Wise JA. 2011. A meiotic gene regulatory cascade driven by alternative fates for newly synthesized transcripts. Mol Biol Cell 22: 66–77. [DOI] [PMC free article] [PubMed] [Google Scholar]
- Denome RM, Cole CN. 1988. Patterns of polyadenylation site selection in gene constructs containing multiple polyadenylation signals. Mol Cell Biol 8: 4829–4839. [DOI] [PMC free article] [PubMed] [Google Scholar]
- Di Giammartino Dafne C, Nishida K, Manley James L. 2011. Mechanisms and consequences of alternative polyadenylation. Mol Cell 43: 853–866. [DOI] [PMC free article] [PubMed] [Google Scholar]
- Dreyfus M, Régnier P. 2002. The poly(A) tail of mRNAs: Bodyguard in eukaryotes, scavenger in bacteria. Cell 111: 611–613. [DOI] [PubMed] [Google Scholar]
- Gehring NH, Frede U, Neu-Yilik G, Hundsdoerfer P, Vetter B, Hentze MW, Kulozik AE. 2001. Increased efficiency of mRNA 3′ end formation: A new genetic mechanism contributing to hereditary thrombophilia. Nat Genet 28: 389–392. [DOI] [PubMed] [Google Scholar]
- Gick O, Krämer A, Keller W, Birnstiel ML. 1986. Generation of histone mRNA 3′ ends by endonucleolytic cleavage of the pre-mRNA in a snRNP-dependent in vitro reaction. EMBO J 5: 1319–1326. [DOI] [PMC free article] [PubMed] [Google Scholar]
- Gil A, Proudfoot N. 1984. A sequence downstream of AAUAAA is required for rabbit β-globin mRNA 3′-end formation. Nature 312: 473–474. [DOI] [PubMed] [Google Scholar]
- Graber JH, Cantor CR, Mohr SC, Smith TF. 1999. Genomic detection of new yeast pre-mRNA 3′-end-processing signals. Nucleic Acids Res 27: 888–894. [DOI] [PMC free article] [PubMed] [Google Scholar]
- Graber JH, McAllister GD, Smith TF. 2002. Probabilistic prediction of Saccharomyces cerevisiae mRNA 3′-processing sites. Nucleic Acids Res 30: 1851–1858. [DOI] [PMC free article] [PubMed] [Google Scholar]
- Gullerova M, Proudfoot NJ. 2008. Cohesin complex promotes transcriptional termination between convergent genes in S. pombe. Cell 132: 983–995. [DOI] [PubMed] [Google Scholar]
- Gullerova M, Moazed D, Proudfoot NJ. 2011. Autoregulation of convergent RNAi genes in fission yeast. Genes Dev 25: 556–568. [DOI] [PMC free article] [PubMed] [Google Scholar]
- Humphrey T, Birse C, Proudfoot N. 1994. RNA 3′ end signals of the S. pombe ura4 gene comprise a site determining and efficiency element. EMBO J 13: 1441–1451. [DOI] [PMC free article] [PubMed] [Google Scholar]
- Kaida D, Berg MG, Younis I, Kasim M, Singh LN, Wan L, Dreyfuss G. 2010. U1 snRNP protects pre-mRNAs from premature cleavage and polyadenylation. Nature 468: 664–668. [DOI] [PMC free article] [PubMed] [Google Scholar]
- Kuai L, Fang F, Butler JS, Sherman F. 2004. Polyadenylation of rRNA in Saccharomyces cerevisiae. Proc Natl Acad Sci 101: 8581–8586. [DOI] [PMC free article] [PubMed] [Google Scholar]
- Lange H, Sement FM, Canaday J, Gagliardi D. 2009. Polyadenylation-assisted RNA degradation processes in plants. Trends Plant Sci 14: 497–504. [DOI] [PubMed] [Google Scholar]
- Legendre M, Gautheret D. 2003. Sequence determinants in human polyadenylation site selection. BMC Genomics 4: 7. [DOI] [PMC free article] [PubMed] [Google Scholar]
- Lewis BP, Shih Ih, Jones-Rhoades MW, Bartel DP, Burge CB. 2003. Prediction of mammalian microRNA targets. Cell 115: 787–798. [DOI] [PubMed] [Google Scholar]
- Loke JC, Stahlberg EA, Strenski DG, Haas BJ, Wood PC, Li QQ. 2005. Compilation of mRNA polyadenylation signals in Arabidopsis revealed a new signal element and potential secondary structures. Plant Physiol 138: 1457–1468. [DOI] [PMC free article] [PubMed] [Google Scholar]
- Mangone M, Manoharan A, Thierry-Mieg D, Thierry-Mieg J, Han T, Mackowiak S, Mis E, Zegar C, Gutwein M, Khivansara V, et al. 2010. The landscape of C. elegans 3′ UTRs. Science 329: 432–435. [DOI] [PMC free article] [PubMed] [Google Scholar]
- Marguerat S, Schmidt A, Codlin S, Chen W, Aebersold R, Bähler J. 2012. Quantitative analysis of fission yeast transcriptomes and proteomes in proliferating and quiescent cells. Cell 151: 671–683. [DOI] [PMC free article] [PubMed] [Google Scholar]
- Mata J. 2013. Genome-wide mapping of polyadenylation sites in fission yeast reveals widespread alternative polyadenylation. RNA Biol 10: 93–100. [DOI] [PMC free article] [PubMed] [Google Scholar]
- Mayr C, Bartel DP. 2009. Widespread shortening of 3′ UTRs by alternative cleavage and polyadenylation activates oncogenes in cancer cells. Cell 138: 673–684. [DOI] [PMC free article] [PubMed] [Google Scholar]
- McLauchlan J, Gaffney D, Whitton JL, Clements JB. 1985. The consensus sequence YGTGTTYY located downstream from the AATAAA signal is required for efficient formation of mRNA 3′ termini. Nucleic Acids Res 13: 1347–1368. [DOI] [PMC free article] [PubMed] [Google Scholar]
- Ozsolak F, Kapranov P, Foissac S, Kim SW, Fishilevich E, Monaghan AP, John B, Milos PM. 2010. Comprehensive polyadenylation site maps in yeast and human reveal pervasive alternative polyadenylation. Cell 143: 1018–1029. [DOI] [PMC free article] [PubMed] [Google Scholar]
- Proudfoot NJ. 1989. How RNA polymerase II terminates transcription in higher eukaryotes. Trends Biochem Sci 14: 105–110. [DOI] [PubMed] [Google Scholar]
- Proudfoot NJ. 2011. Ending the message: Poly(A) signals then and now. Genes Dev 25: 1770–1782. [DOI] [PMC free article] [PubMed] [Google Scholar]
- Retelska D, Iseli C, Bucher P, Jongeneel CV, Naef F. 2006. Similarities and differences of polyadenylation signals in human and fly. BMC Genomics 7: 176. [DOI] [PMC free article] [PubMed] [Google Scholar]
- Rissland O, Norbury C. 2009. Decapping is preceded by 3′ uridylation in a novel pathway of bulk mRNA turnover. Nat Struct Mol Biol 16: 616–623. [DOI] [PMC free article] [PubMed] [Google Scholar]
- Rothnie H, Reid J, Hohn T. 1994. The contribution of AAUAAA and the upstream element UUUGUA to the efficiency of mRNA 3′-end formation in plants. EMBO J 13: 2200–2210. [DOI] [PMC free article] [PubMed] [Google Scholar]
- Schmid M, Jensen TH. 2008. The exosome: A multipurpose RNA-decay machine. Trends Biochem Sci 33: 501–510. [DOI] [PubMed] [Google Scholar]
- Schmidt C, Brookes N, Uhlmann F. 2009. Conserved features of cohesin binding along fission yeast chromosomes. Genome Biol 10: R52. [DOI] [PMC free article] [PubMed] [Google Scholar]
- Shen Y, Ji G, Haas BJ, Wu X, Zheng J, Reese GJ, Li QQ. 2008a. Genome level analysis of rice mRNA 3′-end processing signals and alternative polyadenylation. Nucleic Acids Res 36: 3150–3161. [DOI] [PMC free article] [PubMed] [Google Scholar]
- Shen Y, Liu Y, Liu L, Liang C, Li QQ. 2008b. Unique features of nuclear mRNA poly(A) signals and alternative polyadenylation in Chlamydomonas reinhardtii. Genetics 179: 167–176. [DOI] [PMC free article] [PubMed] [Google Scholar]
- Sherstnev A, Duc C, Cole C, Zacharaki V, Hornyik C, Ozsolak F, Milos PM, Barton GJ, Simpson GG. 2012. Direct sequencing of Arabidopsis thaliana RNA reveals patterns of cleavage and polyadenylation. Nat Struct Mol Biol 19: 845–852. [DOI] [PMC free article] [PubMed] [Google Scholar]
- Steege DA. 2000. Emerging features of mRNA decay in bacteria. RNA 6: 1079–1090. [DOI] [PMC free article] [PubMed] [Google Scholar]
- Tanaka M, Sakai Y, Yamada O, Shintani T, Gomi K. 2011. In silico analysis of 3′-end-processing signals in Aspergillus oryzae using expressed sequence tags and genomic sequencing data. DNA Res 18: 189–200. [DOI] [PMC free article] [PubMed] [Google Scholar]
- Tian B, Hu J, Zhang H, Lutz CS. 2005. A large-scale analysis of mRNA polyadenylation of human and mouse genes. Nucleic Acids Res 33: 201–212. [DOI] [PMC free article] [PubMed] [Google Scholar]
- Venkataraman K, Brown KM, Gilmartin GM. 2005. Analysis of a noncanonical poly(A) site reveals a tripartite mechanism for vertebrate poly(A) site recognition. Genes Dev 19: 1315–1327. [DOI] [PMC free article] [PubMed] [Google Scholar]
- Watanabe T, Miyashita K, Saito TT, Yoneki T, Kakihara Y, Nabeshima K, Kishi YA, Shimoda C, Nojima H. 2001. Comprehensive isolation of meiosis-specific genes identifies novel proteins and unusual non-coding transcripts in Schizosaccharomyces pombe. Nucleic Acids Res 29: 2327–2337. [DOI] [PMC free article] [PubMed] [Google Scholar]
- Wilhelm B, Marguerat S, Watt S, Schubert F, Wood V, Goodhead I, Penkett C, Rogers J, Bähler J. 2008. Dynamic repertoire of a eukaryotic transcriptome surveyed at single-nucleotide resolution. Nature 453: 1239–1243. [DOI] [PubMed] [Google Scholar]
- Wilusz JE, Spector DL. 2010. An unexpected ending: Noncanonical 3′ end processing mechanisms. RNA 16: 259–266. [DOI] [PMC free article] [PubMed] [Google Scholar]
- Winters M, Edmonds M. 1973a. A poly(A) polymerase from calf thymus. Purification and properities of the enzyme. J Biol Chem 248: 4756–4762. [PubMed] [Google Scholar]
- Winters M, Edmonds MJ. 1973b. A poly(A) polymerase from calf thymus. Characterization of the reaction product and the primer requirement. J Biol Chem 248: 4763–4768. [PubMed] [Google Scholar]
- Yan J, Marr TG. 2005. Computational analysis of 3′-ends of ESTs shows four classes of alternative polyadenylation in human, mouse, and rat. Genome Res 15: 369–375. [DOI] [PMC free article] [PubMed] [Google Scholar]
- Zhao J, Hyman L, Moore C. 1999. Formation of mRNA 3′ ends in eukaryotes: Mechanism, regulation, and interrelationships with other steps in mRNA synthesis. Microbiol Mol Biol Rev 63: 405–445. [DOI] [PMC free article] [PubMed] [Google Scholar]
Associated Data
This section collects any data citations, data availability statements, or supplementary materials included in this article.