

When converted to cDNA in the course of RNA sequencing, modified RNA nucleotides can produce sequence patterns that are distinguishable from simple base-calling errors. The authors developed a method, HAMR, that can not only locate these modifications transcriptome-wide with single nucleotide resolution, but can also differentiate between different classes of modifications.
Keywords: RNA modification, RNA sequencing, tRNA
Abstract
RNA is often altered post-transcriptionally by the covalent modification of particular nucleotides; these modifications are known to modulate the structure and activity of their host RNAs. The recent discovery that an RNA methyl-6 adenosine demethylase (FTO) is a risk gene in obesity has brought to light the significance of RNA modifications to human biology. These noncanonical nucleotides, when converted to cDNA in the course of RNA sequencing, can produce sequence patterns that are distinguishable from simple base-calling errors. To determine whether these modifications can be detected in RNA sequencing data, we developed a method that can not only locate these modifications transcriptome-wide with single nucleotide resolution, but can also differentiate between different classes of modifications. Using small RNA-seq data we were able to detect 92% of all known human tRNA modification sites that are predicted to affect RT activity. We also found that different modifications produce distinct patterns of cDNA sequence, allowing us to differentiate between two classes of adenosine and two classes of guanine modifications with 98% and 79% accuracy, respectively. To show the robustness of this method to sample preparation and sequencing methods, as well as to organismal diversity, we applied it to a publicly available yeast data set and achieved similar levels of accuracy. We also experimentally validated two novel and one known 3-methylcytosine (3mC) sites predicted by HAMR in human tRNAs. Researchers can now use our method to identify and characterize RNA modifications using only RNA-seq data, both retrospectively and when asking questions specifically about modified RNA.
INTRODUCTION
Covalent post-transcriptional modifications of specific nucleotide bases in RNA molecules are known to be highly prevalent and physiologically important. However, their overall abundance and biological function are not well understood. This gap is even more surprising given that RNA modifications play a role in maintaining structure, catalytic activity, and cellular abundance of RNAs, and that all known classes of RNA molecules harbor various levels of diverse modifications. Additionally, the recent discovery that an RNA methyl-6 adenosine demethylase (FTO) is a risk gene in obesity highlights the significance of RNA modifications to human biology (Frayling et al. 2007; Gerken et al. 2007; Jia et al. 2011).
Methods for detecting such modifications are well established (Burtis 1970; Gupta and Randerath 1977; Crain 1990; Yu et al. 1997; Helm et al. 1999; Hiley et al. 2005; Grosjean et al. 2007; Meyer et al. 2012; Saletore et al. 2012). One such method is primer extension, which relies on the differential ability of reverse transcriptase to produce cDNAs with base-pair substitutions at positions occupied by modified nucleotides (Woodson et al. 1993). Interestingly, all high-throughput RNA-sequencing library preparation protocols require RNA to cDNA conversion by reverse transcription (RT); thus, we reasoned that it is possible to identify sites of modified nucleotides in all RNAs transcriptome-wide by uncovering nucleotides with significant sequence error rates. Using this idea, we developed HAMR, and demonstrate that this software allows fast and reliable identification of modified nucleotides at single-nucleotide resolution in all RNA classes transcriptome-wide through the analysis of nucleotide substitutions found in various RNA-seq data sets. This software will provide an important tool for future work on RNA modifications, which are emerging as important regulators of human biology and physiology (Jia et al. 2011; Dominissini et al. 2012).
RESULTS
Our method, HAMR, is able to detect the presence of multiple types of modifications present in RNA sequenced only once, without chemical treatment. In addition, the signals produced by these modifications via modulation of RT activity are present in all types of RNA sequencing data sets, which means that HAMR could be invaluable in gleaning more data from previous studies or publicly available data. We demonstrate that the method is able to detect modifications in two newly generated human RNA data sets as well as a publicly available yeast data set, and there is significant overlap in the signal detected.
Small RNA-sequencing of tRNA families
tRNAs are the most highly modified cellular RNAs. Since they are highly represented in small RNA sequencing libraries as tRNA fragments (Burroughs et al. 2011), we developed our approach on this type of data, although in principle our method can be applied to any type of RNA-seq data set. We analyzed small RNA-seq data obtained using the dorsolateral prefrontal cortex of four deceased human patients who showed no signs of neuropathology. We found that the majority of reads (57%) mapped to known microRNAs, 23% to tRNAs, and the rest to other types of known RNAs and intergenic regions.
Since tRNA loci exist in multiple copies across the human genome, their associated short RNA-seq reads will often map to multiple loci. Simply eliminating the ambiguously mapped reads would greatly reduce our data. We reasoned that the exact identity of the tRNA locus was not as important as the family producing each read with regard to RNA modification specificity. Given that isoacceptor tRNAs (those accepting the same amino acid) tend to have similar sequences and isodecoders (those with the same anticodon) even more, we were able to combine similar tRNA loci into families and refer to them by their predicted amino acid and anticodon. The 386 high-scoring tRNA loci annotated by tRNAscan-SE (Lowe and Eddy 1997) fell into 84 tRNA families that were distinct enough to greatly reduce read mapping ambiguity. The post-clustering cross-mapping rate (proportion of reads that map to one or more tRNA families) ranged from 9% for shorter reads (18–20 nt) down to 2% for longer reads (>31 nt). Furthermore, only two families included so-called rogue tRNAs, or tRNAs that share sequence identity with their siblings, but code for a different amino acid.
Detecting modified sites by mismatch rates
In order to detect true post-transcriptional RNA sequence differences, we needed to exclude other sources of mismatches such as base-calling error and DNA polymorphisms. It is noteworthy that we observed an elevated mismatch rate for tRNA-derived smRNA reads, as would be expected when a large number of modified bases are present. In fact, when comparing the mismatch rates of reads mapping to tRNAs, microRNAs, and other types of RNAs, we found that tRNAs showed an overall elevated level of mismatches, microRNAs showed a spike corresponding to the ends of mature miRNAs, and other RNAs showed a gradual increase in mismatches toward the 3′ ends of reads (Fig. 1). These data were consistent with high numbers of modified bases spread across tRNA reads, with edits/additions at the ends of mature microRNAs (Burroughs et al. 2010; Wyman et al. 2011), and with simple base-calling error, which is expected to increase at the 3′ ends of longer reads, respectively. The elevated-mismatch sites throughout the length of tRNA-derived small RNA reads, not just their 3′ ends, suggested that data from smRNA-seq allowed us to identify true base-pair modifications and not merely sequencing errors. Additionally, the distribution of PHRED quality scores at mismatch-containing sites 38.33 (SD = 2.28) was nearly identical to that at nonmismatching sites 38.37 (SD = 2.28).
FIGURE 1.

Mismatch rates along small RNA reads (<44 nt) mapping to three types of RNAs.
Taking advantage of this observation to identify base modifications transcriptome-wide, we developed a model for allowing statistically significant identification of RNA modification sites based on nucleotide misincorporation by RT, while ignoring sequencing errors and single nucleotide polymorphisms (SNPs) due to genotype. The model assumes a fixed base-calling error rate, and makes a set of assumptions about the underlying genotype to model the mismatch rate due to chromosomal polymorphism. The simplest null hypothesis, H01, assumes that the site is homozygous with the reference allele. Taking this as the null hypothesis results in any nonreference nucleotide above the base-calling error rate being called as a candidate modification. A more conservative null hypothesis, H02, assumes only that the genotype is biallelic. Under this assumption, we call candidate modifications where three or more nucleotides are sequenced at a rate higher than base-call errors. Such patterns will arise at sites of RT misincorporation due to modifications and not at biallelic polymorphic sites. We estimated library-wide base-calling error to be ∼1% based on the observed library-wide mismatch rate and on previous reports of error rates in Illumina sequencing (Luo et al. 2012). We also required coverage of at least 10 reads per nucleotide, including reads with the same start and end positions. Under H02, HAMR called 228 candidate modifications out of 5487 sequenced tRNA sites. Of these, 201 (88%) did not overlap with any known SNP in dbSNP release 135 (Sherry et al. 2001). Among these 201 sites, 123 (61%) coincided perfectly with a known modification as listed in tRNAdb 2009 (Sprinzl and Vassilenko 2005) or MODOMICS (Czerwoniec et al. 2009), and 187 (93%) coincided with sites known to be modified on any tRNA (Fig. 2).
FIGURE 2.
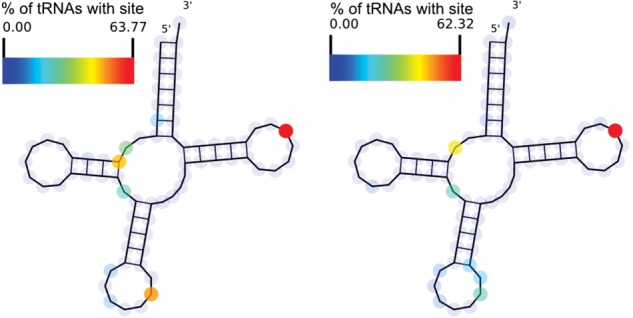
(Left) Locations of known tRNA modifications predicted to affect RT incorporation and (right) modification sites predicted by HAMR mapped onto a tRNA (RFAM) consensus structure. Values indicate the percentage of tRNA families where the site is present.
In order to test for possible violations of the biallelicity assumption under H02, we ascertained the overlap between our called sites and known CNVs. Of the 233 genomic sites where we called a modification under H02, 36 (15%) of the candidate sites fall within gain-of-copy CNVs listed in the Toronto CNV database (Zhang et al. 2006). Of the 36 sites in CNVs, 20 fall within rare CNVs (only one observation) and 16 fall within recurrent CNVs (observed more than once). This suggests that if the results are false positives due to undiscovered SNPs compounded by copy number variation, such instances are only a small fraction of the sites called by HAMR.
Since no chemical treatment that allows the identification of a specific post-transcriptional modification is used, our approach is limited to detecting modifications that modulate RT incorporation during normal sequencing library preparation. We predicted the RT effect of the remaining modifications based on their presence along the Watson–Crick edge (on the Watson–Crick bonds) of the nucleoside (Supplemental Table 1). We found that HAMR exhibits higher sensitivity where these types of modifications are predicted to occur (Fig. 3). While inosine (I) is known to produce an A > G substitution in cDNA (Bass 2002) this nucleotide pattern is indistinguishable from an A/G SNP, and so is discarded under the conservative null hypothesis H02. When we used the less-conservative null hypothesis, H01, 60% of known inosine edit sites were called (Supplemental Fig. 1).
FIGURE 3.

Proportion of sites with known modifications that we predicted to harbor modifications in human tRNA using HAMR. (Black) Modifications are known to affect RT incorporation; (dark gray) modifications predicted to affect RT incorporation based on their structure at the Watson–Crick edge of the nucleoside; (light gray) modifications known to have no effect on RT, or there is no evidence showing that they do under the conditions in this experiment.
Calling modification types by incorporation patterns in RT
We hypothesized that different types of modifications affecting RT incorporation would have distinct incorporation patterns due to the differential base-pairing properties of the modified ribonucleotides. In order to visualize the incorporation patterns, we mapped each potentially modified site (excluding known SNPs and using the conservative null hypothesis H02) onto a ternary plot with the three dimensions corresponding to observed fractions of the three nonreference nucleotides. This can be done for each precursor nucleotide separately (A, C, G, and U). The ternary plots clearly show clustering by modification type for modified adenosines and guanosines (Fig. 4A,B). Using this approach, we observed 13 sites for cytidine (m3C), while predicting two RT-effecting sites for uridine. Interestingly, despite U > D (dihydrouridine) and U > Y (pseudouridine) not being predicted to affect RT incorporation, we were able to detect these sites and they tended to cluster together. We also found that the m3C sites were sequenced with a very similar nucleotide pattern in all four human brain samples, and so those observations cluster together (Supplemental Fig. 2).
FIGURE 4.

Frequencies of observed nonreference nucleotides at sites with known modifications of (A) adenosines and (B) guanosines in human tRNAs. Each point represents one observation in one sample. The axes are labeled by template-strand cDNA sequence and are the complement of the nucleotide that was incorporated by RT into the cDNA. (C,D) Results of this same analysis in S. cerevisiae.
Among modified adenosines, m1A shows a bias toward sequencing of T with varying amounts of G, and m1I shows a very similar pattern. In contrast, t6A shows a strong bias toward sequencing of C in the cDNA. Under the less-conservative H01, 60% of the known inosine sites were detected and found to be very strongly associated with a G in the cDNA, as is expected (Supplemental Fig. 3). At guanosines, both m22G and m1G heavily favor sequencing of T with varying amounts of C and A, while peroxywybutosine (o2yW) shows more variation. Observations for peroxywybutosine were insufficient for us to draw strong conclusions about its RT incorporation patterns.
We set out to design a classifier that could take these patterns as input and predict the most likely modification at a site using these ternary plots. Given that m1A, m1I, and ms2i6A and i6A and t6A cocluster, we decided to merge these two sets of modifications into the combined classes m1A|m1I|ms2i6A and i6A|t6A. Similarly, we merged m2G and m22G into a single class, m2G|m22G. These two may be especially difficult to resolve, because m2G is a chemical precursor of m22G. Using a 3-nearest-neighbor classifier and leave-one-out cross-validation (LOOCV) we were able to differentiate between the two groups of adenosine modifications with 98% accuracy. For the guanosine modification types m1G and m2G|m22G, we were able to achieve 78% accuracy. For the 18 observations of significant uridine sites, we were able to distinguish between D and Y modifications with 86% accuracy. As there was only one type of cytidine modification that was detected, m3C, a classifier was not necessary. It is informative, however, that without chemical treatment the only cytidine modification we detected was m3C.
Expanding the tRNA modification annotation
Given the incomplete nature of the annotation we used, we set out to see whether our classifier could expand the annotation by predicting modifications across all human tRNAs. We expected that the universally conserved modifications, e.g., m1A, would appear in all sequenced tRNAs, despite those sites sometimes being absent from known annotations. Most of the undetected modifications were m2G sites, and our low sensitivity for m2G is likely due to its mild effect on RT incorporation (Youvan and Hearst 1979).
In total, we predicted 78 modification sites that were absent from the annotation (Supplemental Table 2). In many cases the modifications were absent because the specific tRNA was not listed. First, we looked at isoacceptor tRNAs and matched 25 sites to m1A9, m1A58, m1G9, m22G26, m1G37, m3C32, and Y39. For the other 53 sites not previously uncovered, we then searched across all tRNAs; this led to an additional 39 matched sites that were known to be modified in at least one type of tRNA. The remaining 14 sites were considered completely novel.
Validation in S. cerevisiae small RNA data set
In order to validate HAMR and demonstrate its utility in other organisms, we tested the software using a previously published yeast small RNA data set (Drinnenberg et al. 2011). We remapped the reads to the latest Saccharomyces cerevisiae genome release (sacCer3, UCSC) and applied the same procedure as with the human data to collapse the yeast tRNA loci into families. Of the 3783 sequenced yeast tRNA sites with coverage greater than 10, 67 were called as potentially modified sites. Of these, 56 (84%) corresponded exactly to known modifications in tRNAdb or MODOMICS. Six more sites corresponded to positions that were not annotated as being modified on their particular tRNAs, but were known to be modified in an isoacceptor tRNA. The final five sites were known to be modified in other tRNAs. The sensitivity for RT-affecting modification was higher than those not predicted to affect RT incorporation (Supplemental Fig. 4). Similar to the human data, when we used the less-conservative null hypothesis H01, we were able to detect 100% of the inosine sites as well as a t6A, an m3C, and an ac4C site (Supplemental Fig. 5).
FIGURE 5.

HAMR identifies known and novel modification sites in human tRNAs. Random-primed RT-qPCR analysis of three human tRNAs (as specified) after RNA immunoprecipitation using either an antibody specific for 3mC or an IgG control (see Materials and Methods for additional details). qPCR loading was normalized to a nonmodified tRNA (Lys [UUU]). The tRNA models demonstrate the specific site of the HAMR identified 3mC modification sites (cytosine 3 for Met [CAU], as well as cytosine 32 for mtMet [CAU] and mtThr [UGU]). Gray and black labels denote tRNAs where the HAMR-identified 3mC site is novel or known, respectively. (mt) Mitochondrial tRNAs. Error bars, ±SD. (**) P-value < 0.01.
The sequenced nucleotide patterns in yeast were similar to those in the human brain data. (Fig. 4C,D) The fact that the two data sets were generated using different library preparations, sequenced by different versions of Illumina sequencers attests to the robustness of the statistical model we have developed. In fact, the classifier trained on human tRNAs was able to achieve 90% accuracy for modified adenosines and 65% accuracy for modified guanosines in yeast tRNAs.
Validation in human whole-transcriptome data sets
In order to ascertain the reproducibility of the tRNA modifications that were not directly present in the databases, we generated additional RNA-seq data from whole-transcriptome (rRNA-depleted) libraries, which include entire tRNAs as opposed to only tRNA fragments. We compared both the “semi-novel” and “novel” tRNA sites in the small RNA libraries with the whole-transcriptome libraries (Supplemental Table 3). Semi-novel here means the site is not annotated as modified on that particular tRNA, but is annotated on some other tRNA accepting a different amino acid. Of the 23 semi-novel sites that were called in, more than half of the smRNA libraries, 10 (43%) are also called in at least one whole-transcriptome library. Two had drastically lower coverage in the whole-transcriptome libraries. The remaining 13 (mostly ms2i6A38) sites could not be detected in the whole-transcriptome libraries, possibly due to a real difference in ms2i6A modification rates between tRNA fragments and whole tRNAs. Of the six novel sites detected in more than half of the smRNA libraries, four were detected in the whole-transcriptome libraries. The remaining two had drastically lower read coverage in the whole-transcriptome libraries.
Experimental validation
To experimentally validate some of the novel RNA modification sites identified by HAMR in human tRNAs, we performed immunoprecipitation on total RNA from HEK293T cells with an antibody that specifically recognizes the 3-methylcytosine (3mC) modification or an IgG control antibody (Fig. 5). We then measured the enrichment of three tRNAs, which were predicted to contain a 3mC modification by HAMR (see Materials and Methods for additional details), in the two immunoprecipitates. Of these three tRNAs, one was known to contain this modification (mtThr [UGU]), while the two others (Met [CAU] and mtMet [CAU]) were identified specifically by our novel methodology. We found that all three tRNAs (novel and known) were significantly (P-value < 0.01) enriched in the m3C-specific immunoprecipitates compared with the IgG control (Fig. 5), indicating that they all contained this specific covalent modification. In total, these results provide experimental support for the validity of HAMR-identified RNA modifications in eukaryotic transcriptomes.
Detecting modifications in other RNAs
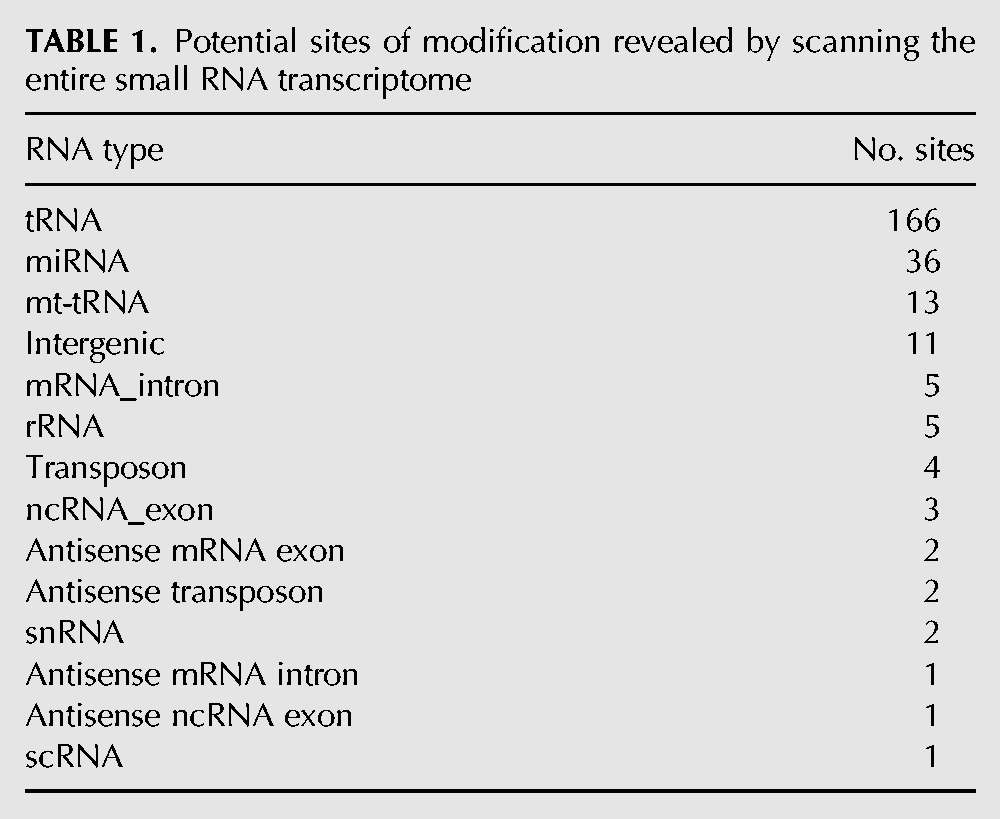
Scanning the entire human small RNA transcriptome and excluding tRNAs revealed 73 sites with mismatch patterns potentially corresponding to RNA modifications (Table 1). Nearly half (36) of these sites fell within known pre-microRNAs. Since the microRNA sites nearly always fell within 2 nt of the 3′ ends of mature microRNAs as annotated by mirBase (Kozomara and Griffiths-Jones 2010), they most likely correspond to untemplated nucleotide additions, a phenomenon that has previously been observed in small RNA-seq data sets (Chiang et al. 2010).
TABLE 1.
Potential sites of modification revealed by scanning the entire small RNA transcriptome
Software
Users may submit a link to a remote indexed BAM (read alignment) file to the online version of HAMR. HAMR detects candidate modification sites either transcriptome-wide or at selected loci specified by transcript ID or genomic coordinates. Users may also opt to filter out known dbSNP sites for human data and select various options affecting the stringency of the analysis, including P-value or FDR thresholds, minimum coverage, and which null hypothesis to use. The web version of HAMR is available at http://wanglab.pcbi.upenn.edu/hamr.
DISCUSSION
Here, we present HAMR, a high-throughput method to map RNA modifications within all classes of RNAs by identifying misincorporation of nucleotides by reverse transcriptase during production of cDNA products. While traditional methods use chemical treatment of the RNAs prior to RT, many modifications are still detectable, even without treatment, due to their effect on RT incorporation. This is advantageous because it allows for retrospective assays of potential RNA modifications in existing RNA-seq data sets, and also because it allows for the detection of RNA modifications with only one sequencing run. However, it is worth noting that the use of different chemical treatments in addition to different types of RT enzymes should expand the range of modifications that are detectable by HAMR. Since many modifications also cause complete halts in RT, a future research direction is to develop a method that allows the utilization of fragment endpoint locations for modification mapping.
We have also found that the number of allowed mismatches in read alignment places a limit on the detection of nearby modifications. Improvement of methods, like the one presented here, will thus necessitate development of an alignment method that allows mismatches at arbitrary sites. This would be similar to the mapping methods used for bisulfite sequencing data (Xi and Li 2009), which are designed to map reads accurately in the face of cytosine deamination.
MATERIALS AND METHODS
Cell culture
HEK293T cells were maintained at 37°C with 5% CO2 in DMEM (Life Technologies) supplemented with 10% FBS (Atlanta Biologicals) and 1X Pen/Strep (Life Technologies). Cells were grown to 80%–90% confluence and collected by washing and scraping in PBS.
smRNA sequencing
Frozen human brain tissue from four female patients without neurological pathology was obtained from the Center for Neurodegenerative Disease Research. Trizol extraction was performed to obtain total RNA. cDNA libraries for sequencing were generated following the Illumina small RNA library preparation procedure. The libraries were sequenced on an Illumina GAIIx machine to 50 bp and were submitted to the NCBI GEO database (GSE43335). The reads were 3′ adapter trimmed, requiring at least 6 bp of adapter sequence with, at most, a 6% mismatch rate. All untrimmed reads and trimmed reads shorter than 14 bp were discarded. The remaining reads were mapped to the human genome (hg19) (Fujita et al. 2011) using Bowtie (Langmead et al. 2009) under the “-v 2” mode with a maximum 6% mismatch rate and allowing up to 100 mappings per read. Any unmapped reads were realigned to the set of tRNA transcripts with -CCA tails appended, and these were merged into the final alignment. For the whole-transcriptome libraries, the same extractions were performed on brain samples from the same four patients, plus an additional male patient (GSE46523). Instead of initial size-fractionation, RNAs were depleted by one round of Ribominus (Invitrogen). Additionally, sequences mapping to known rRNA sequences were masked out of the data set, and both adapter-trimmed and untrimmed reads were used.
The alignments were also performed using a different alignment program, BWA (Li and Durbin 2009). The results obtained using BWA were nearly identical to those given by Bowtie's alignments (195 modified sites vs. Bowtie's 202). Reads aligning to repeat regions or annotated RNAs other than tRNAs were discarded. Nuclear tRNA annotations were taken from the “tRNAs” table in the UCSC genome browser (hg19). Annotations for mitochondrial tRNAs were generated by running tRNAscan-SE (v1.23) set to organelle mode on the mitochondrial genome (“chrM” in hg19). Multi-mapping reads were partially resolved by taking those alignments whose mismatches aligned to SNPs (dbSNP 135) as the true hits, prioritizing them over alignments whose mismatches had no apparent explanation. The yeast data, consisting of 20.8 million reads sequenced on an Illumina Genome Analyzer I, were obtained from the NCBI Sequencing Read Archive (GSM775340).
tRNA locus clustering
tRNA loci were taken from the tRNAscan annotation at UCSC and were required to have a tRNAscan score of 60.0. The loci were merged into families based on an empirical measure of sequence similarity computed from the number of reads mapping across them simultaneously, resulting in a clustering of tRNA loci that minimizes the number of cross-mapping reads. Each ordered pair of loci (i,j) is assigned a similarity value
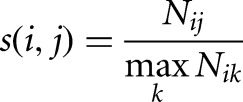 |
where Nij is the number of reads mapping to both loci, and the denominator is taken over all loci k. Then, the symmetric similarity is
and the distance is set to be
Hierarchical clustering with k = 84 clusters yielded the fewest cross-mapping reads with the fewest rogue clusters (those whose tRNAs decode to more than one amino acid). The two rogue clusters were Gly(SMC)1 containing 1 tRNAValCAC and Cys(NVM)1 containing 6 tRNAAlaAGC, 1 tRNAAlaCGC, 3 tRNAAlaUGC, 1 tRNASerAGA, and 1 tRNAValAAC.
Detecting candidate RT misincorporation sites
The read alignment was converted to a pileup format, and bases with quality score below 30 were discarded. Candidate RT misincorporation sites were taken to be those covered by at least 10 reads and significantly enriched (FDR < 5%) for mismatches by the binomial test, assuming a base call error rate of 1%. We tested two null hypotheses. The first, H01, consists of the hypothesis that the genotype is a homozygous reference. Therefore, the probability of seeing fewer than k out of ntot reads matching the reference nucleotide at a given site is
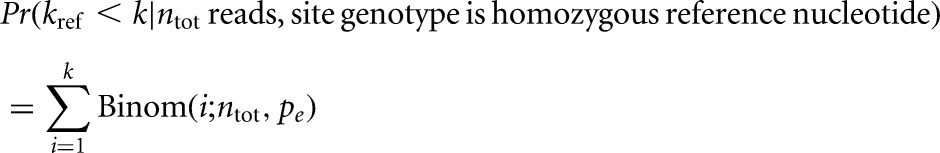 |
where pe is the base-calling error rate. A more conservative null hypothesis, H02, assumes only that the genotype is biallelic. It is a composite hypothesis consisting of subhypotheses for each of the 10 possible genotypes. HAMR tests each possible biallelic genotype and takes the maximal P-value among all of the tested genotypes. The advantage of using H02 is that it will not falsely call significant any site that looks like a heterozygous or homozygous SNP. The main disadvantage is that it will cause HAMR to miss simple RNA edits as well as modifications that produce 1- or 2-nt patterns in the cDNA. H02 is more appropriate when one wishes to avoid false positives due to polymorphisms, but H01 can be used if corroborating DNA evidence or other means are available to rule out such false hits. During the scan of the entire small RNA transcriptome, the single nucleotides corresponding to the 5′ and 3′ ends of reads were discarded to reduce false positives resulting from elevated base-calling error and ligation errors on read-ends.
tRNA modification identification
RNA modification data was taken from the RNA modification database (Rozenski et al. 1999). Specific locations of tRNA modifications were taken from the eukaryotic entries in tRNAdb 2009 and from the curated S. cerevisiae data at MODOMICS (Czerwoniec et al. 2009). The tRNAdb data were given precedence over MODOMICS in all cases. Within the tRNAdb data, if multiple modifications were annotated for the same site, precedence was given to the organism closest in evolutionary distance from the target organism (either human or S. cerevisiae), using divergence time estimates as the means reported at timetree.org (Hedges et al. 2006). For each candidate modification site, an evidence level was assigned based on its overlap with the known modification data. The highest confidence overlap is one where a candidate modification occurs at a particular site in a particular tRNA for both the prediction and in the annotation. The next lowest confidence overlap is one where a known modification occurs at that site in any isoacceptor tRNA. Finally, the lowest level of evidence is the presence of a known modification in any eukaryotic tRNA at that site. Higher evidence data always takes priority over lower evidence data. If multiple possible modifications of the same evidence level are annotated at the same site, the modification data is marked as ambiguous. Modified sites were plotted on the RFAM consensus tRNA structures using SAVOR (Li et al. 2012). The classifier for identifying specific modifications by mismatch pattern is a 3-nearest-neighbor classifier in three dimensions, with the features being the sequenced proportions of the three nonreference nucleotides, after Laplace smoothing. For training data we only used the highest level of evidence (same site, same tRNA) and only modifications supported by at least three instances in the RNA-seq data were used.
Software
The HAMR program takes as input a sequence-read alignment in BAM format (consisting of uniquely mapped reads) and produces a table of genome coordinates and nucleotide frequencies at those coordinates. Given an assumed sequencing error-rate, it then performs a statistical analysis to select those sites whose mismatch rates are higher than expected by chance. The result is a set of sites that consist of both potential SNPs and candidate RNA modifications. These sites may optionally be classified as particular modifications based on the models built from no-chemical-treatment tRNA data.
The web interface allows specification of a remote indexed BAM file and BED file, with targeted intervals for querying. The user may specify parameters for the preprocessing steps, such as minimum base-call quality score, minimum coverage at a site, assumed sequencing error rate, and significance level. Additionally, the user may utilize the software to predict the modification type based on mismatch patterns in tRNA data.
3-methylcytosine RNA immunoprecipitation
Total RNA extractions from HEK293T cells were performed according to the RNeasy Midi Kit (Qiagen), with the exception that buffer RWT (miRNeasy Mini Kit) was used in place of buffer RW1 to increase yields of small RNAs. 3mC RNA immunoprecipitation was performed using a protocol similar to that described for meRIP-seq (Meyer et al. 2012). Briefly, 10 μg of purified Rabbit-anti-3-methylcytosine (Active Motif) or 10 μg of Rabbit-control-IgG (Santa Cruz Biotechnology) was conjugated to Protein A Dynabeads (Life Technologies) in 1 M IP buffer (1 M NaCl, 0.05% Triton-X 100 and 10 mM Na3PO4). Antibody-bead conjugates were washed with 140 mM IP buffer (140 mM NaCl, 0.05% Triton-X 100, and 10 mM Na3PO4). Fifty micrograms of total RNA was denatured and immunoprecipitated in 140 mM IP buffer at 4°C for 2 h. The supernatant was removed and bound RNAs were eluted in elution buffer (5 mM Tris-HCl at pH 7.5, 1 mM EDTA at pH 8.0, 0.05% SDS, and 4.2 μL of Proteinase K [20 mg/mL]) for 1.5 h at 50°C. RNA was purified from the eluates using standard phenol:chloroform extraction, followed by ethanol precipitation.
Real-time quantitative PCR
cDNA was generated in a standard reaction with SuperScript II (Life Technologies) and random hexamers. Real-time qPCR reactions were performed using SYBR Green PCR Master Mix (Life Technologies). The data were normalized to Lysine tRNA (UUU) levels, which does not contain a known or predicted 3mC site, and should be evenly distributed between samples. Primers used to amplify each target are as follows: Met (CAU): fwd: 5′-GTAAGGTCAGCTAAATAAGCTATCG-3′, rev: 5′-CGGGAAGGGTATAACCAACA-3′; mtMet (CAU): fwd: 5′-GTAAGGTCAGCTAAATAAGCTATCG-3′, rev: 5′-CGGGAAGGGTATAACCAACA-3′; mtThr (UGU): fwd: 5′-ATACACCAGTCTTGTAAACCGGAGA-3′, rev: 5′-TCCTTGGAAAAAGGTTTTCGT-3′; and Lys (UUU) (negative control): fwd: 5′-CCGGATAGCTCAGTCGGTAG-3′, rev: 5′-GACTTGAACCCTGGACCCTC-3′.
DATA DEPOSITION
All smRNA- and RNA-seq data from our analyses were deposited in GEO under the accessions GSE43335 and GSE46523, respectively.
SUPPLEMENTAL MATERIAL
Supplemental material is available for this article.
Supplementary Material
ACKNOWLEDGMENTS
This work is supported by the National Institute of General Medical Sciences (R01-GM099962 to L.S.W., B.D.G., and P.R.; and T32-GM00821626 to I.M.S.), National Human Genome Research Institute (NHGRI) (T32-HG000046 to P.R.), National Institute on Aging (U24-AG041689 and U01-AG032984 to L.S.W.), Penn Alzheimer's Disease Center (P30-AG10124 to B.D.G. and L.S.W.), the SmithKline Beecham Center of Excellence in Geriatric Medicine through the Penn Institute on Aging (to M.C.), and National Science Foundation (MCB-1053846 and MCB-1243947 to B.D.G.). Brain samples were obtained from the Center for Neurodegenerative Disease Research. RNA-seq experiments were carried out with support from P30-AG010124 and help from Vivianna M. Van Deerlin, Virginia Lee, John Q. Trojanowski, Alice Chen-Plotkin, Gerard D. Schellenberg, and Steven E. Arnold, and their lab members. We thank Andrew Hong for helping us to experimentally validate the novel tRNA modification sites. We thank Mingyao Li, Zissimos Mourelatos, and the members of the Wang and Gregory labs for their comments on the manuscript.
Author contributions: L.S.W. and B.D.G. designed the experiment. P.R., Y.Y.L., I.M.S., and I.D. performed the RNA-seq and validation experiments with input from B.D.G. P.R. and L.S.W. developed the statistical model. P.R. compiled all annotation data and carried out the computational analysis with input from B.D.G. and L.S.W. P.R., I.M.S., B.D.G., and L.S.W. wrote the manuscript. P.R., M.C., and O.V. developed the software and web interface. All authors read and approved the manuscript.
REFERENCES
- Bass BL. 2002. RNA editing by adenosine deaminases that act on RNA. Annu Rev Biochem 71: 817–846. [DOI] [PMC free article] [PubMed] [Google Scholar]
- Burroughs AM, Ando Y, de Hoon MJL, Tomaru Y, Nishibu T, Ukekawa R, Funakoshi T, Kurokawa T, Suzuki H, Hayashizaki Y, et al. 2010. A comprehensive survey of 3′ animal miRNA modification events and a possible role for 3′ adenylation in modulating miRNA targeting effectiveness. Genome Res 20: 1398–1410. [DOI] [PMC free article] [PubMed] [Google Scholar]
- Burroughs AM, Ando Y, de Hoon ML, Tomaru Y, Suzuki H, Hayashizaki Y, Daub CO. 2011. Deep-sequencing of human Argonaute-associated small RNAs provides insight into miRNA sorting and reveals Argonaute association with RNA fragments of diverse origin. RNA Biol 8: 158–177. [DOI] [PMC free article] [PubMed] [Google Scholar]
- Burtis CA. 1970. The determination of the base composition of RNA by high-pressure cation-exchange chromatography. J Chromatogr 51: 183–194. [DOI] [PubMed] [Google Scholar]
- Chiang HR, Schoenfeld LW, Ruby JG, Auyeung VC, Spies N, Baek D, Johnston WK, Russ C, Luo S, Babiarz JE, et al. 2010. Mammalian microRNAs: Experimental evaluation of novel and previously annotated genes. Genes Dev 24: 992–1009. [DOI] [PMC free article] [PubMed] [Google Scholar]
- Crain PF. 1990. Preparation and enzymatic hydrolysis of DNA and RNA for mass spectrometry. Meth Enzymol 193: 782–790. [DOI] [PubMed] [Google Scholar]
- Czerwoniec A, Dunin-Horkawicz S, Purta E, Kaminska KH, Kasprzak JM, Bujnicki JM, Grosjean H, Rother K. 2009. MODOMICS: A database of RNA modification pathways. 2008 update. Nucleic Acids Res 37: D118–D121. [DOI] [PMC free article] [PubMed] [Google Scholar]
- Dominissini D, Moshitch-Moshkovitz S, Schwartz S, Salmon-Divon M, Ungar L, Osenberg S, Cesarkas K, Jacob-Hirsch J, Amariglio N, Kupiec M, et al. 2012. Topology of the human and mouse m6A RNA methylomes revealed by m6A-seq. Nature 485: 201–206. [DOI] [PubMed] [Google Scholar]
- Drinnenberg IA, Fink GR, Bartel DP. 2011. Compatibility with killer explains the rise of RNAi-deficient fungi. Science 333: 1592. [DOI] [PMC free article] [PubMed] [Google Scholar]
- Frayling TM, Timpson NJ, Weedon MN, Zeggini E, Freathy RM, Lindgren CM, Perry JRB, Elliott KS, Lango H, Rayner NW, et al. 2007. A common variant in the FTO gene is associated with body mass index and predisposes to childhood and adult obesity. Science 316: 889–894. [DOI] [PMC free article] [PubMed] [Google Scholar]
- Fujita PA, Rhead B, Zweig AS, Hinrichs AS, Karolchik D, Cline MS, Goldman M, Barber GP, Clawson H, Coelho A, et al. 2011. The UCSC Genome Browser database: Update 2011. Nucleic Acids Res 39: D876–D882. [DOI] [PMC free article] [PubMed] [Google Scholar]
- Gerken T, Girard CA, Tung Y-CL, Webby CJ, Saudek V, Hewitson KS, Yeo GSH, McDonough MA, Cunliffe S, McNeill LA, et al. 2007. The obesity-associated FTO gene encodes a 2-oxoglutarate–dependent nucleic acid demethylase. Science 318: 1469–1472. [DOI] [PMC free article] [PubMed] [Google Scholar]
- Grosjean H, Droogmans L, Roovers M, Keith G. 2007. Detection of enzymatic activity of transfer RNA modification enzymes using radiolabeled tRNA substrates. Meth Enzymol 425: 55–101. [DOI] [PubMed] [Google Scholar]
- Gupta RC, Randerath K. 1977. Use of specific endonuclease cleavage in RNA sequencing. Nucleic Acids Res 4: 1957–1978. [DOI] [PMC free article] [PubMed] [Google Scholar]
- Hedges SB, Dudley J, Kumar S. 2006. TimeTree: A public knowledge-base of divergence times among organisms. Bioinformatics 22: 2971–2972. [DOI] [PubMed] [Google Scholar]
- Helm M, Florentz C, Chomyn A, Attardi G. 1999. Search for differences in post-transcriptional modification patterns of mitochondrial DNA-encoded wild-type and mutant human tRNALys and tRNALeu(UUR). Nucleic Acids Res 27: 756–763. [DOI] [PMC free article] [PubMed] [Google Scholar]
- Hiley SL, Jackman J, Babak T, Trochesset M, Morris QD, Phizicky E, Hughes TR. 2005. Detection and discovery of RNA modifications using microarrays. Nucleic Acids Res 33: e2. [DOI] [PMC free article] [PubMed] [Google Scholar]
- Jia G, Fu Y, Zhao X, Dai Q, Zheng G, Yang Y, Yi C, Lindahl T, Pan T, Yang Y-G, et al. 2011. N6-methyladenosine in nuclear RNA is a major substrate of the obesity-associated FTO. Nat Chem Biol 7: 885–887. [DOI] [PMC free article] [PubMed] [Google Scholar]
- Kozomara A, Griffiths-Jones S. 2010. miRBase: Integrating microRNA annotation and deep-sequencing data. Nucleic Acids Res 39: D152–D157. [DOI] [PMC free article] [PubMed] [Google Scholar]
- Langmead B, Trapnell C, Pop M, Salzberg SL. 2009. Ultrafast and memory-efficient alignment of short DNA sequences to the human genome. Genome Biol 10: R25. [DOI] [PMC free article] [PubMed] [Google Scholar]
- Li H, Durbin R. 2009. Fast and accurate short read alignment with Burrows–Wheeler transform. Bioinformatics 25: 1754–1760. [DOI] [PMC free article] [PubMed] [Google Scholar]
- Li F, Ryvkin P, Childress DM, Valladares O, Gregory BD, Wang L-S. 2012. SAVoR: A server for sequencing annotation and visualization of RNA structures. Nucleic Acids Res 40: W59–W64. [DOI] [PMC free article] [PubMed] [Google Scholar]
- Lowe TM, Eddy SR. 1997. tRNAscan-SE: A program for improved detection of transfer RNA genes in genomic sequence. Nucleic Acids Res 25: 955–964. [DOI] [PMC free article] [PubMed] [Google Scholar]
- Luo C, Tsementzi D, Kyrpides N, Read T, Konstantinidis KT. 2012. Direct comparisons of illumina vs. Roche 454 sequencing technologies on the same microbial community DNA sample. PLoS One 7: e30087. [DOI] [PMC free article] [PubMed] [Google Scholar]
- Meyer KD, Saletore Y, Zumbo P, Elemento O, Mason CE, Jaffrey SR. 2012. Comprehensive analysis of mRNA methylation reveals enrichment in 3′ UTRs and near stop codons. Cell 149: 1635–1646. [DOI] [PMC free article] [PubMed] [Google Scholar]
- Rozenski J, Crain PF, McCloskey JA. 1999. The RNA Modification Database: 1999 update. Nucleic Acids Res 27: 196–197. [DOI] [PMC free article] [PubMed] [Google Scholar]
- Saletore Y, Meyer K, Korlach J, Vilfan ID, Jaffrey S, Mason CE. 2012. The birth of the Epitranscriptome: Deciphering the function of RNA modifications. Genome Biol 13: 1–12. [DOI] [PMC free article] [PubMed] [Google Scholar]
- Sherry ST, Ward MH, Kholodov M, Baker J, Phan L, Smigielski EM, Sirotkin K. 2001. dbSNP: The NCBI database of genetic variation. Nucleic Acids Res 29: 308–311. [DOI] [PMC free article] [PubMed] [Google Scholar]
- Sprinzl M, Vassilenko KS. 2005. Compilation of tRNA sequences and sequences of tRNA genes. Nucleic Acids Res 33: D139–D140. [DOI] [PMC free article] [PubMed] [Google Scholar]
- Woodson SA, Muller JG, Burrows CJ, Rokita SE. 1993. A primer extension assay for modification of guanine by Ni(II) complexes. Nucleic Acids Res 21: 5524–5525. [DOI] [PMC free article] [PubMed] [Google Scholar]
- Wyman SK, Knouf EC, Parkin RK, Fritz BR, Lin DW, Dennis LM, Krouse MA, Webster PJ, Tewari M. 2011. Post-transcriptional generation of miRNA variants by multiple nucleotidyl transferases contributes to miRNA transcriptome complexity. Genome Res 21: 1450–1461. [DOI] [PMC free article] [PubMed] [Google Scholar]
- Xi Y, Li W. 2009. BSMAP: Whole genome bisulfite sequence MAPping program. BMC Bioinformatics 10: 232. [DOI] [PMC free article] [PubMed] [Google Scholar]
- Youvan DC, Hearst JE. 1979. Reverse transcriptase pauses at N2-methylguanine during in vitro transcription of Escherichia coli 16S ribosomal RNA. Proc Natl Acad Sci 76: 3751–3754. [DOI] [PMC free article] [PubMed] [Google Scholar]
- Yu YT, Shu MD, Steitz JA. 1997. A new method for detecting sites of 2′-O-methylation in RNA molecules. RNA 3: 324–331. [PMC free article] [PubMed] [Google Scholar]
- Zhang J, Feuk L, Duggan G, Khaja R, Scherer S. 2006. Development of bioinformatics resources for display and analysis of copy number and other structural variants in the human genome. Cytogenet Genome Res 115: 205–214. [DOI] [PubMed] [Google Scholar]
Associated Data
This section collects any data citations, data availability statements, or supplementary materials included in this article.