
Figure 8.
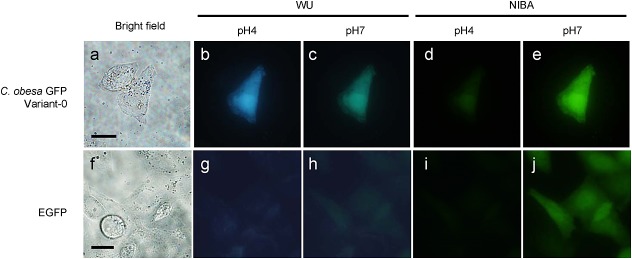
Bright-field (a,f) and fluorescence (b–e,g–j) images of HeLa cells transiently expressing variant-0 CoGFP and EGFP. Fluorescence images were captured by WU and NIBA mirror units at pH 4 and pH 7. Scale bars, 20 µm.
Official websites use .gov
A
.gov website belongs to an official
government organization in the United States.
Secure .gov websites use HTTPS
A lock (
) or https:// means you've safely
connected to the .gov website. Share sensitive
information only on official, secure websites.
Bright-field (a,f) and fluorescence (b–e,g–j) images of HeLa cells transiently expressing variant-0 CoGFP and EGFP. Fluorescence images were captured by WU and NIBA mirror units at pH 4 and pH 7. Scale bars, 20 µm.