

Abstract
Objectives
To understand the formal roles of community representatives (CRs) in Clinical and Translational Science Awardee (CTSA) activities, to evaluate the extent of integration into the organizational and governance structures and to identify barriers to effective integration.
Methods
The inventory tool was distributed to each of the 60 CTSAs using a secure web application.
Results
Forty‐seven (78%) completed the inventory. The mean number of CRs per CTSA is 21.4 (SD: 14.8). Most CTSAs had community advisory boards (89%) and 94% included CRs in Community Engagement (CE) cores. Only 11% reported a CR being a member of the CTSA leadership team and 19% reported that CRs advise core programs beyond CE.
CRs are compensated by 79% of CTSAs. Mean annual compensation is $753 (median: $400). Compensation directly correlated with the number of hours that CRs worked in CTSA activities (r = 0.64; P = 0.001).
Conclusions
This inventory allows CTSAs to better understand how CRs have engaged in activities and brings attention to the limited representation among cores and in leadership roles. CTSAs should, with substantive input from CRs, develop strategies to provide the resources and compensation necessary to better integrate the community in CTSA activities and fully realize the goals of the CTSA vision.
Keywords: community engagement, CTSA, community‐engaged research, translational research
Introduction
Enhancing public participation in clinical research has been identified as one of the central challenges facing the national clinical research enterprise.1 Although community involvement can increase the quality and relevance of research,2 community engagement (CE) is complex and innovative strategies to engage the public have not been well funded in the past. Nonetheless, to effectively translate scientific discoveries into improvements in the public's health, the scientific community must actively engage the public in all stages of research.
The Clinical and Translational Science Awardees (CTSAs) program is an NIH Roadmap initiative launched in 2006 to “re‐engineer the biomedical research enterprise,” create academic homes for clinical and translational research, and provide investigators with the resources and tools necessary to conduct clinical and translational research.3, 4, 5, 6 CE was a key component of the initial funding announcement for the CTSAs and “engaging communities in research” continues to be a goal of the CTSAs under the recently established National Center for Advancing Translational Sciences (NCATS).7 The initial Request for Applications (RFA‐RM‐06‐002)8 for CTSAs explicitly stated that applications specify “how the institution will involve the community in setting research priorities that directly affect patients, innovative ways to engage community members in mentoring processes, partnerships in clinical and translational research, and collaborations to enhance research perspectives (e.g., health disparity research), public trust, and recruitment for clinical and translational research . . . [and] plans for training CTSA researchers, trainees and scholars in community outreach, cultural sensitivity, and population and community‐based research methods.” Review criteria for applications included the extent to which the CTSA would “effectively involve the community . . . in clinical and translational research priority setting, participation and follow‐up,” and included “plans to train researchers, trainees and scholars in the methodology of community/population‐based research and outreach.” The review criteria also assessed the applicant's “commitment to integrate the CTSA into the institution and into a national network of CTSAs and also to reach out to the local community” and whether “this integration [is] reflected in the senior leadership and decision‐making processes of the CTSA.”
In order to provide guidance to achieving its goals and a forum for discussing them, the CTSA Consortium established the Community Engagement Key Function Committee,9 which in turn created the Community Partners Integration (CPI) workgroup to focus explicitly on how to involve community representatives (CRs) more fully in the CTSA efforts. This workgroup consists of faculty and staff representatives of CTSAs, as well as CRs who are actively involved with CTSAs and has three co‐chairs, two CRs, and one academic representative. To better understand the current strategies that CTSAs are using to engage CRs and to inform future strategies for effectively engaging the community, the CPI workgroup agreed to inventory the current CE strategies of the funded CTSAs, to evaluate the extent to which CRs are integrated into the organizational and governance structures of the CTSAs, and to identify barriers to effective integration.
Methods
After receiving approval to conduct this inventory from the CTSA Consortium's Community Engagement Key Function Committee, the CPI workgroup established the Added Value of Community Involvement Subgroup. This subgroup, which consists of both community and academic members, was responsible for creating the instrument used in this project, distributing the inventory, and analyzing the results.
The subgroup spent considerable time defining the term Community Representative, resulting in the following definition: “a person whose primary affiliation is with a nonacademic, non‐research community‐based organization and/or who represents a defined community within the geographic area covered by the CTSA.” This definition was included with the inventory. The subgroup then identified the categories to be inventoried (see Table 1).
Table 1.
Categories included in inventory of community involvement in Clinical and Translational Science Awardee (CTSA) activities
| Number and type of community representatives (CRs) with formal roles in each CTSA |
| Roles of CRs in the CTSAs |
| Inclusion of CRs in committee and overall leadership |
| Policies that govern CRs involvement |
| Time commitments expected of CRs |
| Types and amount of compensation to CRs |
| Best practices in engaging CRs |
| Barriers to engaging CRs |
Instrument development and distribution
Based on these categories determined, the subgroup developed a draft instrument and distributed it to CTSAs for pilot testing and feedback. After receiving 10 completed pilot inventories and feedback from the participating CTSAs, the subgroup revised the instrument. Between October and December 2011, the final instrument was distributed electronically to each of the 60 funded CTSAs, including those that participated in the pilot of the initial version. Only one inventory was sent to each CTSA via its single voting member of the Community Engagement Key Function Committee. Although each CTSA received only one inventory, the instructions suggested that the inventory be completed with other members of the institutions' CE efforts.
To increase response rates, follow‐up efforts were made for approximately 3 months following initial distribution. These efforts included individual emails to CE leaders at CTSAs who had not responded, repeated requests to complete the inventory during the Community Engagement Key Function Committee monthly conference calls, and repeated emails to CE leaders and Principal Investigators of the CTSAs. Study data were collected and managed using the REDCap electronic data capture tool, developed by a large international consortium of research institutions and networks, including CTSAs.10
Quantitative data were analyzed using SPSS version 20.0 (IBM, Chicago, IL, USA). Grounded theory was used to code the qualitative data and determine key themes.
Community representatives were involved in all phases of this project including planning, creating the instrument, developing strategies to improve response rates, interpreting the findings, and presenting and writing up the results.
Results
The inventory was completed by 47 (78%) of the 60 CTSAs. The mean number of CRs with a formal role in operations and guidance (e.g., advisory boards, formal committees, leadership council) per CTSA was 21.4 (SD: 14.8; median: 15; range: 4–64). Community members represented a broad range of community entities (see Figure 1). The most commonly represented types of organizations are minority‐serving community nonprofit organizations, community advocacy organizations, Community Health Centers/Federally‐Qualified Health Centers, public health programs, and faith‐based organizations.
Figure 1.
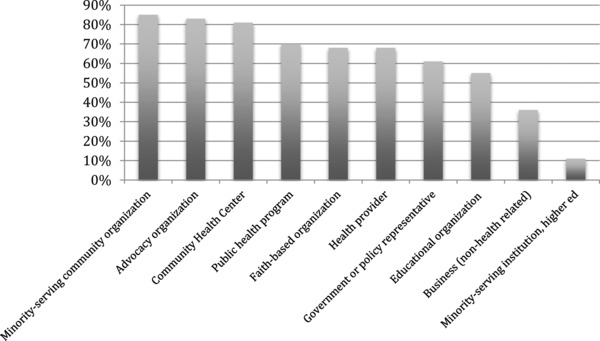
Percent of Clinical and Translational Science Awardees with a community representative from each group.
Inclusion in CTSA core programs
Community representatives had formal roles in 94% of CE Cores and 38% of External Advisory Boards (EABs). For all other cores 25% or fewer of the responding CTSAs reported inclusion of CRs in their activities (see Figure 2). The majority (89%) of CTSAs have a Community Advisory Board (CAB). These CABs directly advise only the CE Core in 62% of the CTSAs, both the CE Core and a CTSA leadership committee in 32%, and only the CTSA leadership committee in 6%. CABs meet quarterly (40%), monthly (19%), twice yearly (11%), and every other month or six times yearly (8.5%). At 68.1% of CTSAs, a CR holds a leadership position on the CAB (Chair, Co‐Chair, or similar).
Figure 2.
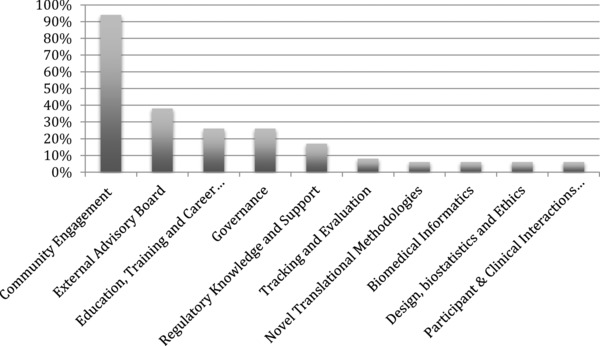
Percent of Clinical and Translational Science Awardees with a community representative involved with each core or committee.
Inclusion in leadership roles
Community members are represented on an overall CTSA leadership team (e.g., Executive Committee, Governing Council) in only 11% of CTSAs. For 38% of CTSAs, the CAB provides recommendations or advice to the CTSA leadership. Respondents noted that there were minimal opportunities to influence the CTSA leadership other than through the CE cores and that it was often unclear whether CTSA leaders acted on the recommendations from CRs and CABs.
Written policies
Community representatives are required to sign a Memorandum of Understanding (or similar) to serve on a CTSA board or committee at 74% of CTSAs. The responsibilities of CRs in formal roles are defined in a job description at 34% of CTSAs. There are written policies (such as bylaws) that govern CABs or other boards at 57% of CTSAs and explicit requirements to serve in a leadership capacity on a CAB or board at 21%.
Time commitment
The length of time that CRs are expected to serve is unspecified in 53%, 2 years in 17%, and 3–5 years in 17% of CTSAs. The number of hours that CRs are actively involved in CTSA activities varies widely (data not shown). Most often, CRs spent 2–4 hours monthly (40%) or more than 10 hours monthly (23%) involved in CTSA activities.
Types and amount of compensation
Community representatives are provided monetary compensation by 79% of CTSAs. The mean annual compensation is $956.82 (median: $500; range: $75–$6,000; excludes those who receive no compensation and one extreme outlier that compensates $12,500 annually). When the analysis is adjusted to include the 21% of CTSAs that do not compensate CRs, the mean annual compensation decreases to $753.24 (median: $400; range: $0–$6,000). The number of hours that CRs work with CTSAs is directly correlated with amount of compensation (Pearson correlation coefficient: 0.644; P = 0.001).
In addition to monetary compensation, CTSAs reported providing other incentives to CRs, including reimbursement for local travel (34%), meals, gift cards, and travel to national conferences. Several CTSAs noted that chairs/co‐chairs receive higher stipends than other board members or that compensation is provided only for those who serve as consultants.
Barriers to engaging CRs
CTSAs report a wide range of barriers to engaging CRs in CTSA activities. The most commonly cited barrier is limited time, reported by 60% of CTSAs. Other barriers reported by CTSAs include the perceived power differential between academic leadership and CRs (43%), unclear expectations (32%), perceptions of being undervalued (32%), negative history between the university and community (32%), and inadequate compensation (23%).
Additional themes from qualitative data
Themes elicited from the qualitative data are shown in Table 2. The themes capture how CRs influence CTSA leadership, other formal roles for CRs, and best practices for engaging CRs.
Table 2.
Themes from qualitative data on community involvement in Clinical and Translational Science Awardee (CTSA) activities
| Query | Themes |
|---|---|
| Describe how community representatives (CRs) influence CTSA leadership. | • Most opportunities to influence CTSAs through CE core; minimal influence of other cores, and overall CTSA • CRs influence of CTSA leadership is variable but in most cases minimal to modest • CRs provide advice and recommendations but do not receive feedback; unclear what happens to recommendations given to CTSA leaders |
| Describe other formal ways that CRs are involved in the CTSA. | • CRs serve as consultants in defined roles for CTSA cores or overall CTSA. Examples include reviewing internal or pilot grants and review of research participant recruitment materials • CRs often serve as liaisons/ambassadors to community. Disseminating relevant research & CTSA info • CRs working with CTSAs are recruited to serve on Institutional Review Boards, which allows additional input in institution's research and provides different perspective when reviewing CEnR proposals |
| Do you have a “best practice”? What are the most important “lessons learned” about involving CRs in your CTSA? | • Take CTSA to community for meetings, etc. • Formalize partnerships with MOUs • Bidirectional communication, developing goals and agendas jointly • Sharing resources; transparency • Allow adequate time to build trust • Minimize burden; compensate for time |
Discussion
This first effort to inventory the activities of CTSAs to engage CRs in their activities was conducted relatively early in the development of CTSAs. At the time of the inventory, the first funded CTSAs were completing their fifth year of operation and the most recently funded had just begun their activities. The recently funded CTSAs were in the process of developing key structures and operations, and thus, may have had plans to further incorporate CRs beyond what was reported at the time. The results, therefore, should be considered valuable information from which to build rather than standards to be modeled. Overall, given the goals of community representation in CTSA activities included in the initial request for proposals, the results are suggestive of the large steps necessary if these goals are to be achieved.
At the time of the inventory, nearly all of the responding CTSAs (94%) had involved CRs in their activities. Community representation was broad and included vulnerable and underrepresented populations. Despite the broad representation and an average of more than 20 CRs per CTSA, CRs were mostly compartmentalized in the CE cores with little evidence of much direct inclusion among other cores or the CTSA leadership. The lack of inclusion of CRs in other CTSA core programs is surprising and of concern. In particular, for both the Participant and Clinical Interactions Resources (PCIR) core and the Clinical Research Ethics (CRE) core, only 3 (6%) of 47 responding CTSAs reported inclusion of CRs. The purpose of the PCIR is to “provide an environment that promotes participation in clinical and translational research in addition to providing clinical resources for cost‐effective human subject interactions.”11 Similarly, the CRE core is intended to encourage innovative research programs that “bridge” research ethics “with other CTSA activities . . . for example, limiting risk to participants, preventing bias, improving recruitment and retention . . . developing design and analysis plans for studies of unique or vulnerable populations, and issues in diseases with limited treatment options.”11 These objectives would appear to require substantive inclusion of representative community members to help identify and address the issues and concerns that limit the participation in clinical research of some communities served by the CTSA, especially racial and ethnic minorities, and to identify the resources needed to expand their participation.
Compensation for CRs was relatively small and ranged from nothing (21% of reporting CTSAs) to $12,500 by one CTSA. The majority of CTSAs (79%) provided financial compensation to their CRs, but only one‐third reported covering their travel expenses. More than half of the CTSAs compensated their CRs less than $500/year and 17% compensated them at $2,000/year. Using the median compensation ($500/year) and the most frequently reported time spent working with CTSAs (2–4 hours/month), the average rate of compensation for CRs was between $10.42/hour and $20.84/hour. Although this a rough estimate, it is likely that this compensation is far less than the amount that CRs earn in their full‐time jobs and is certainly below the compensation of the academic staff of the CTSA. Appropriate compensation is a key component in effective CE12, 13, 14 and requesting that CRs, many of whom are leaders in their communities with full‐time jobs, participate in CTSA activities without adequate compensation undervalues their contributions.
Other important findings from this inventory include the lack of opportunities for CRs to engage with the CTSA leadership, unclear expectations for CRs and the limited feedback that CRs receive after giving advice and recommendations to the CTSAs. A number of CTSAs reported using innovative strategies to successfully engage CRs including serving on pilot grant review committees, reviewing research participant recruitment strategies and giving recommendations directly to investigators, and serving as consultants in defined roles for CTSA cores and CTSA leadership.
Although nearly 80% of the currently funded CTSAs responded to this inventory, the CTSAs are in different stages of evolution and development, therefore, this inventory may not capture plans for CE that are not yet implemented. The results of this inventory are also limited by the source of information. The inventory was distributed to the CE Core leaders of the CTSAs, so academic representatives may have reported responses without direct input from CRs. Consequently the perspectives of CRs who have been engaged in CTSA activities may not be reflected in this inventory. An inventory completed by CRs involved in CTSA activities would be an important contribution to our understanding of CE in CTSAs.
Conclusions
This inventory provides valuable information regarding how CRs have engaged in CTSA activities and brings attention to limited community representation beyond the CE cores and lack of integration of CRs within other CTSA cores. The inadequate compensation for CRs undervalues their contributions and undermines substantive community involvement in CTSA activities. To achieve the vision of the NIH Roadmap and the CTSA program, CTSA leaders, with the support of NCATS, must (1) develop strategies to obtain substantive input from a broad representation of community members regarding the time, education, funding, and resources necessary to fully engage CRs in CTSA activities,15 (2) develop and implement strategies to integrate CRs throughout CTSA cores, not just CE, (3) adopt policies and provide resources to appropriately compensate CRs, and (4) include CRs on CTSA leadership and governance committees.
Sources of Funding
This project has been funded in whole or in part with Federal funds from the National Center for Research Resources and NCATS, National Institutes of Health, through the Clinical and Translational Science Awards Program (CTSA) under the following award numbers: UL1 TR000445, UL1 TR000128, UL1 TR000448, UL1 TR000124, UL1 TR000170, UL1 TR000150, UL1 TR000165, UL1 TR000083, and UL1 RR025750‐04S2.
Ethical Approval
The CTSA Consortium Publications Committee approved the manuscript for submission. The content is solely the responsibility of the authors and does not necessarily represent the official views of the National Institutes of Health.
Acknowledgments
The authors thank the Added Value of Community Involvement Subgroup, the CPI Workgroup and former chair Sarah Greene, the CTSA Consortium's Community Engagement Key Function Committee, and Liz Chen and Leslie Boone for their contributions to this study.
References
- 1. Sung NS, Crowley WF, Genel M, Salber P, Sandy L, Sherwood LM, Johnson SB, Catanese V, Tilson H, Getz K, et al. Central challenges facing the national clinical research enterprise. JAMA. 2003; 289(10): 1278–1287. [DOI] [PubMed] [Google Scholar]
- 2. Green LW. Community‐based participatory research perspective on partnerships In: Community‐University Partnerships: Translating Evidence into Action. Proceedings of a National Symposium Jointly Sponsored by Community‐Campus Partnerships for Health and HUD's Office of University Partnerships; San Diego, CA; 2003. [Google Scholar]
- 3. Zerhouni E. The NIH roadmap. Science. 2003; 302(5642): 63–72. [DOI] [PubMed] [Google Scholar]
- 4. Zerhouni EA. Clinical research at a crossroads: the NIH roadmap. J Investigat Med. 2006; 54(4): 171–173 110.2310/6650.2006.X0016. [DOI] [PubMed] [Google Scholar]
- 5. Zerhouni EA. Translational and clinical science: time for a new vision. New Engl J Med. 2005; 353(15): 1621–1623. [DOI] [PubMed] [Google Scholar]
- 6. Zerhouni EA, Alving B. Clinical and Translational Science Awards: a framework for a national research agenda. Trans Res. 2006; 148(1): 4–5. [DOI] [PubMed] [Google Scholar]
- 7. Williams RL, Rhyne RL. No longer simply a practice‐based research network (PBRN) health improvement networks. J Am Board Family Med. 2011; 24(5): 485–488. [DOI] [PubMed] [Google Scholar]
- 8. Grants NIH. Institutional clinical and translational science award. 2005; Original RFA for CTSA. Available at: http://grants.nih.gov/grants/guide/rfa‐files/RFA‐Rm‐06‐002.html. Accessed July 11, 2012. [Google Scholar]
- 9. Michener L, Scutchfield FD, Aguilar‐Gaxiola S, Cook J, Strelnick AH, Ziegahn L, Deyo RA, Cottler LB, McDonald MA. Clinical and translational science awards and community engagement: now is the time to mainstream prevention into the nation's health research agenda. Am J Prevent Med. 2009; 37(5): 464–467. [DOI] [PMC free article] [PubMed] [Google Scholar]
- 10. Harris PA, Taylor R, Thielke R, Payne J, Gonzalez N, Conde JG. Research electronic data capture (REDCap): a metadata‐driven methodology and workflow process for providing translational research informatics support. J Biomed Informat. 2009; 42(2): 377–381. [DOI] [PMC free article] [PubMed] [Google Scholar]
- 11. Grants NIH. Institutional clinical and translational science award (U54). 2007; RFA for CTSA in 2007. Available at: http://grants.nih.gov/grants/guide/rfa‐files/rfa‐rm‐07‐007.html. Accessed July 11, 2012.
- 12. Jones L, Wells K. Strategies for academic and clinician engagement in community‐participatory partnered research. JAMA. 2007; 297(4): 407–410. [DOI] [PubMed] [Google Scholar]
- 13. Clinical and Translational Science Awards Community Engagement Key Function Committee Task Force on the Principles of Community Engagement. Principles of Community Engagement. 2nd edn. Bethesda, MD: National Institutes of Health; NIH Publication 11‐7782, 2011. [Google Scholar]
- 14. CTSA Community Engagement Key Function Committee . Researchers and their communities: the challenge of meaningful community engagement. 2009. Available at: https://www.ctsacentral.org/documents/BestPractices_inCommunityEngagement_Summary_2007_08.pdf. Accessed May 16, 2013.
- 15. Seifer S, Greene‐Moton E. Realizing the promise of community‐based participatory research: community partners get organized. Progr Comm Health Partnerships: Res Education Action. 2007; 1(4): 291–294. [DOI] [PubMed] [Google Scholar]