

Abstract
Aim
Questionnaires are an invaluable resource for clinical trials. They serve to estimate disease burden and clinical parameters associated with a particular study. However, current researchers are tackling budget constraints, loss of funding opportunities, and rise of research associated fees. We aimed at exploring alternative avenues taking advantage of the free Google docs software for questionnaire administration. This presents an opportunity to reduce costs while simultaneously increasing efficiency and data fidelity.
Material and Methods
Google documents were used as a platform to create online questionnaires that were automatically hosted via a unique URL. Password protected access to the URL link and a unique study ID gave patients around the clock access from anywhere in the world. Unique study ID ensured confidentially of all self-reported data. Patient responses were secured using a “Cloud” database where the data was automatically sorted, scaled and scored by custom Excel formulas. Researchers downloaded real-time questionnaire responses in multiple formats (e.g. excel) which was then analyzed with a statistical software of choice.
Results
This simple workflow provided instant questionnaire scores that eliminated the use for paper-based responses and subsequent manual entry of data. Ease of access to online questionnaires provided convenience to patients leading to better response rates and increase in data fidelity. The system also allowed for real time monitoring of patient's progress on completing questionnaires. Online questionnaires had 100% completion rate compared to paper-based questionnaires.
Conclusions
Google docs can serve as an efficient and free platform to administer questionnaires to a clinical population without sacrificing quality, security, and fidelity of data.
Keywords: Online Questionnaires, Google Docs, Research Study, Applied Informatics, Clinical outcomes
Introduction
Completion of paper-based questions by research study participants is often incomplete [1]. Missing data compromises the ability to perform statistical analysis, support vector machine learning, and advanced modeling. In addition, researchers must often re-enter hand written data into recording forms after patients have fill out the questionnaires. This may lead to risk of data loss and fidelity. Computer based methods obviate many of those concerns. Electronic versions of questionnaires have shown consistent test-retest reliability of data [2]. However, some platforms are expensive and/or require special tablets that are available only during clinical visits [3,4]. This has become increasingly problematic as grant funds and research budgets are shrinking.
To overcome these problems, we adapted the existing Google docs format to create an effective computerized questionnaire system [5]. Paper based questionnaires were programmed to allow a simple to read and complete push button format. A confidential log in system was developed that allowed secure data collection. No personal identifying information was collected, although additional productions could be allowed to do this. The responses were formatted so all questionnaire data could be copied to separate spreadsheets for subsequent data analysis. This paper provides step by step directions to setup the free and secure Googledocs system for questionnaire administration.
Material and Methods
This section will contain a detailed outline of how to setup and use the Google Docs function.
Questionnaire used as the example
For demonstrative purposes, the Chronic Fatigue Syndrome (CFS) severity score was used [6]. The CFS severity score questionnaire is comprised of 9 symptom domains: Fatigue, headaches, myalgia, arthralgia, sore throat, lymph nodes, cognitive dysfunction, sleep, and exertional exhaustion. Each of the 9 symptom domains are ranked using an anchored ordinal scale of 0 (none), 1 (trivial), 2 (mild), 3 (moderate), and 4 (severe). Subjects were asked to rate the severity of each symptom over the past 6 months.
Establishing a Google Account
To begin the process of creating your free and securely accessed online questionnaire system, you must first create a Google account by going to www.docs.google.com. Please do not use an existing personal account. We strongly recommend that an account be created solely to manage clinical questionnaire data for the research laboratory. Passwords to the account should be given to research members who are certified to handle patient data, Institutional Review Board (IRB) approved and understand the privacy laws for the region, state or province, and country.
Creating your online questionnaire
Once an account is created, log into the new account. Move your cursor to the top of the horizontal menu bar and click on the word “Drive” (Figure 1A) which leads to the main welcome screen for Google docs (Figure 1B). To create your spreadsheet, press on the red button labeled “Create” (Figure 2A). A drop down menu will appear. Move your cursor and press “Form” (Figure 2B). This will bring you to a sub-welcome screen; press the blue button labeled “Get started”.
Figure 1. The startup screen.

(A) To begin the process of creating your online questionnaire sheet(s), press “Drive” (red arrow). (B) This will take you to the main welcome screen.
Figure 2. Creating the questionnaire form.

(A) On the left hand side of your screen, press the button labeled “Create” (black arrow). (B) A drop down menu appears, please press on the button labeled “Form” (purple arrow).
Another sub-screen will ask you to type in the title and choose the theme for your questionnaire (Figure 3). We recommend the “Default” background as it is neutral and research appropriate.
Figure 3. Choose title and theme.

The name of the desired paper questionnaire (black arrow) should be typed in prior to the conversion to the online version. For this example, we are using the CFS severity score.
Question for confidential subject identification
Once the “Default” background is selected, the screen changes to begin the process of entering the questionnaire (Figure 4). In the “Form description” box type the directions for the questionnaire (Figure 4; black arrow). We strongly recommend making the first question a randomly generated identification code to keep track of individual patient data and for future data analysis. In the “Question title” box, type in Subject I.D. (Figure 4; red arrow). In the “Help text” box, type in the format of the code that was given to the patient (Figure 4; yellow arrow). For “Question type”, use the drop down menu and choose the option “text” (Figure 4; green arrow). Make sure that this is a “required question” by checking the box (Figure 4; blue arrow). Press on the blue “Done” button to complete this 1st step.
Figure 4. Naming of the questionnaire.
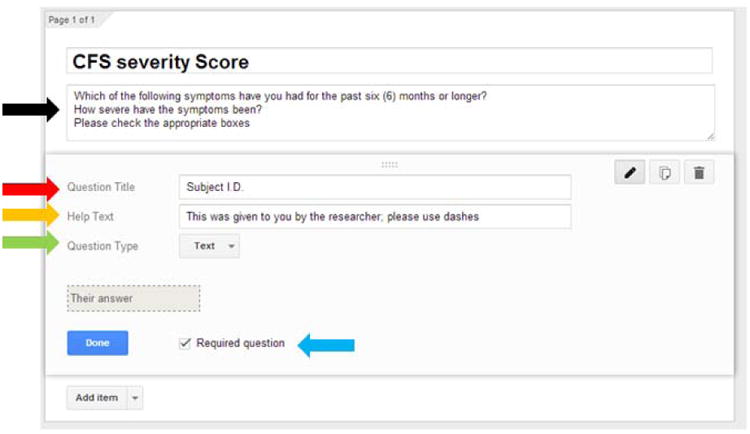
A sub-screen appears. The name of the desired paper questionnaire (black arrow) should be typed in prior to the conversion to the online version. For this example, we are using the CFS severity score.
Setting up the questionnaire
To generate the main questions press “Add item” on the left hand of the screen (Figure 5A; pink arrow). Because we are using the CFS questionnaire, the “Question type” selected from the drop down menu is “grid” (Figure 5B; blue arrow). Depending on the questionnaire, the “Question type” selected will vary.
Figure 5. Adding questions and responses to the questionnaire.

(A) Pink arrow points to the add item button to start the process. (B) Blue arrow shows the question type, in this case it will be “Grid”. Purple and green arrows show where to place the questions and associated answers.
Once the “grid” option is selected, 2 additions will appear: “Row 1 label” (Figure 5B; purple arrow) and “Column 1 label” (Figure 5B; green arrow). Below the “Row 1 label”, it states “Click to add option”. This allows you to expand the variables asked in the question. In the “Question title” box type in the associated query that is required (Figure 6; black arrow).
Figure 6.

Addition of rows and columns. Black, red and green arrows point to the expansion of the question sub screen.
We recommend that the “Row” always list the symptoms and the “Column” list the severity scale being used. For the CFS severity score, there are 9 variables that need to be entered in the “Row label” option of the questionnaire (Figure 6; red arrow). Next, the 5 ordinal rankings of severities are entered into the “Column label” option (Figure 6; green arrow). Once completed, check the box for “Required question” and press “Done” (Figure 7A; orange arrow) leading to the complete questionnaire (Figure 7B).
Figure 7. The completion of the first question.
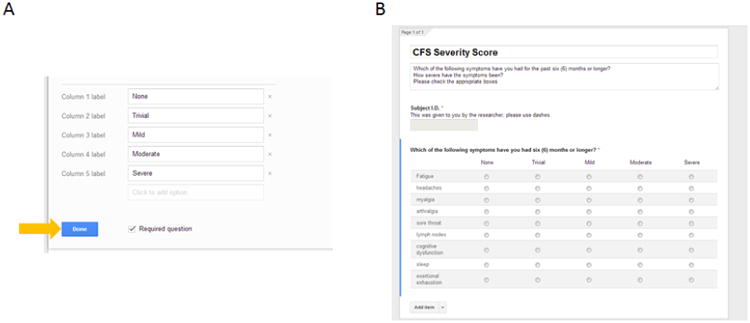
(A) After completion of the questionnaire press the blue done button (yellow arrow). Also click the “Required question” box to make sure patients answer the questions in the future. (B) Once complete, the questionnaire will be easy to read and highly organized.
Questionnaire responses converted to Excel spreadsheet
A major hurdle at this junction is often transforming the word responses of questionnaires to numerical values. Having an automated method of generating the numerical values greatly streamlines the ability to import data into statistical software. A solution to this is to setup a workbook of three spreadsheets with a Vlookup table equation.
To begin, move your cursor to the top left hand of the screen and press “Choose response destination” (Figure 8A; red arrow). This leads to a sub-welcome screen; press create (Figure 8B; black arrow). Once the spreadsheet is created, move your cursor back to the top left hand of the screen and press “View responses” (Figure 8C; orange arrow).
Figure 8. Transferring questionnaire data to spreadsheets.

(A) Red arrow shows the start of moving the data over. (B) Press create to transfer data to a spread sheet. (C) View responses will summarize and show the data collected.
What follows is the Google Docs workbook that is auto-generated with the patient responses from the questionnaire (Figure 9A). This spreadsheet is auto-named “Form Responses” and contains a “timestamp” (Figure 9A; black arrow) that identifies the time and date of questionnaire completion. We recommend keeping this column.
Figure 9.

Creating the 3 tab spreadsheet to begin the “Vlookup” process.
To setup the workbook with three spreadsheets, press the “plus symbol (+)” twice at the bottom left of the screen (Figure 9A; red arrow). This creates two tabs labeled “Sheet2” and “Sheet3”. Right click on the “Sheet2” tab and rename it to Number Responses and the “Sheet3” tab to Vlookup Table (Figure 9B). The “Number Responses” tab will contain the numerical form of the questionnaire responses. The “Vlookup Table” tab will contain all of the equations necessary to convert the word responses (that are in the Form Responses tab) to their numerical format (that are in the Number Responses tab).
Click on “Vlookup Table” tab in the spreadsheet to begin forming your equations (Figure 10). In column A and row 1 cell type in “For All Questions” (Figure 10; green arrow). This will identify which words are being transformed to their number format. Starting from the cell in column B and row 2, type in the severities used in the questionnaire (Figure 10; blue arrow). In this case, it is the 5 ordinal severity ratings from the CFS Severity Score. In the cell at column C and row 2, adjacent to the ordinal ratings, type in their respective numerical values (Figure 10; orange arrow). In the cell at column D and row 2 (Figure 10; purple arrow), copy and paste this Vlookup formula: ˆ=VLOOKUP(‘Form Responses!C2,‘Vlookup Table’!$B$2:$C$6,2,0). The hat symbol (ˆ) at the front of the equal symbol (=) is placed so that the Vlookup formula is inactive and visible for editing. It is important to note that Vlookup equations are case sensitive; therefore pay close attention to capitalization, spaces, and punctuation in the questionnaire.
Figure 10.

Forming equations for the Vlookup table.
Once this is completed, the next step is to prepare the “Number Responses” spreadsheet for automatic population. Take your cursor and click on the “Form Responses” spreadsheet that contains the original data. At the top left hand corner of this spreadsheet, click on the box below the “fx” symbol (Figure 9A; green arrow). This will highlight the entire spreadsheet. On your keyboard press, “Ctrl+C” to copy the entire “Form Responses” spreadsheet. Now, take your cursor and press the “Number Responses” tab and on your keyboard press, “Ctrl+V to paste the information into this sheet. At this point, you will have an exact copy of the data from the “Form Responses” spreadsheet to the “Number Responses” spreadsheet (Figure 11).
Figure 11.

The cells that are highlighted for the Vlookup table.
The next step is to copy the Vlookup formula: =VLOOKUP (‘Form Responses!C2,‘Vlookup Table’!$B$2:$C$6,2,0) and paste it into the cell that contains the severity word rating (Figure 11; black arrow). It is important to note that this equation does not have the hat symbol (ˆ) preceding the equal sign. If done correctly, the word form will now be transformed into its numerical format that was defined in the “Vlookup Table” spreadsheet (Figure 11; green arrow).
Results
Creating the final form for patient use
Once the workbook has been created, a link to the questionnaire needs to be generated for patient use. Take your cursor and go to the top of the screen to press “Form” on the menu bar; scroll to “go to live form” (Figure 10; red arrow). This takes you to the live questionnaire and forms a hyperlink that can be given to patients via e-mail (Figure 12; blue arrow).
Figure 12.

Permanent link to give to patients (blue arrow).
Save the hyperlink onto a word document or program of your choice. Once a patient is recruited, the hyperlink can be sent via e-mail to the patient, where they are able to fill it out confidentially in their own home. An alternative would be to maintain a small inexpensive laptop for patients that can be given to them during the clinical visit.
Discussion
We have demonstrated a unique tool for data questionnaire acquisition with the use of the cloud based spreadsheet function in Googledocs. The main benefits of this system come from its ease of use, wide availability, and enhanced security. Others have applied similar methods for enhancing online collaboration with Googledocs [7,8]. To our knowledge, our specific use of Google docs for administrating clinical questionnaires has not been reported previously.
A primary concern in all fields of data collection, particularly in clinical research, is data security. All data entered through this system is maintained in the Google cloud; known to be one of the most secure in the industry. During the initial login, security is provided by SSH login protocol that has bank like encryption and porting techniques. Locations housing the data has 24/7 manned security support and extensive background checks on employees. Googledocs applications are certified by the Federal Information Security Management Act (FISMA), SAS 70 Type II certification and US/EU Safe harbor certification. In addition, files housed by the Google cloud are separated into multiple locations on several machines. Naming of files is randomized creating an additional level of security as owners and their files cannot be matched. Complete details of the multiple levels of security can be found on the Google Apps security page [9].
Conclusion(s)
The use of the Googledocs function for creating, administering and maintain questionnaires in a clinical setting is a superior and cost effective tool that can be used around the world. Initial setup of questionnaires into the Google format is simple and efficient, and the entry form can be created to fit any type of questionnaire response. Our successful use of this system highlights the reliability and security of the Google platform further supporting its use in clinical research.
Acknowledgments
Support was provided by Department of Defense Congressionally Directed Medical Research Program (CDMRP) award W81-XWH-09-1-0526. This project has been funded in whole or in part with Federal funds (Grant # UL1TR000101, previously UL1RR031975) from the National Center for Advancing Translational Sciences (NCATS), National Institutes of Health (NIH), through the Clinical and Translational Science Awards Program (CTSA), a trademark of DHHS, part of the Roadmap Initiative, “Re-Engineering the Clinical Research Enterprise.
Footnotes
Conflict of Interest: The author(s) declare that they have no conflict of interest'.
Authors' Contributions: JNB and YZ designed the methods. RUR, CRT, JNB, OA, and YZ administered, maintained the database. RUR, CRT, JNB, OA, and YZ interpreted and completed the questionnaire analysis. RUR and JNB wrote the manuscript. All authors edited the manuscript.
Contributor Information
Yin Zheng, Email: yzheng1@health.usf.edu.
Ebsan Uddin, Email: euddin@terpmail.umd.edu.
Christian Timbol, Email: crt32@georgetown.edu.
Oluwatoyin Adewuyi, Email: oluwatoyin.adewuyi@gmail.com.
James N. Baraniuk, Email: baraniuj@georgetown.edu.
References
- 1.Van Gelder M, Bretveld RW, Roeleveld N. Web-based Questionnaires: The Future in Epidemiology? Am J Epidemiol. 2010;11:1292–8. doi: 10.1093/aje/kwq291. [DOI] [PubMed] [Google Scholar]
- 2.Cook AJ, Roberts DA, Henderson MD, Van Winle LC, Chastain DC, Hamill-Ruth RJ. Electronic pain questionnaires: A randomized, crossover comparison with paper questionnaires for chronic pain assessment. Pain. 2004;110:310–7. doi: 10.1016/j.pain.2004.04.012. [DOI] [PubMed] [Google Scholar]
- 3.Angelow A, Schmidt M, Weitmann K, Schwedler S, Vogt H, Havemann C, Hoffmann W. Methods and implementation of a central biosample and data management in a three-centre clinical study. Comput MethodsPrograms Biomed. 2008;91:82–90. doi: 10.1016/j.cmpb.2008.02.002. [DOI] [PubMed] [Google Scholar]
- 4.Manion FJ, Robbins RJ, Weems WA, Crowley RS. Security and privacy requirements for a multi-institutional cancer research data grid: an interview-based study. BMC Med Inform Decis Mak. 2009;9:31. doi: 10.1186/1472-6947-9-31. [DOI] [PMC free article] [PubMed] [Google Scholar]
- 5.Main webpage of Googledocs. [Internet]. [cited 2013]. Available from: www.docs.google.com
- 6.Baraniuk JN, Adewuyi O, Merck SJ, Ali M, Ravindran MK, Timbol CR, Rayhan RU, Zheng Y, Le U, Esteitie R, Petrie KN. A Chronic Fatigue Syndrome (CFS) severity score based on case designation criteria. Am J Transl Res. 2013;1:53–68. [PMC free article] [PubMed] [Google Scholar]
- 7.Eapen BJ. Collaborative writing: Tools and tips. Indian J Dermato Venereol Leprol. 2007;73:439–41. doi: 10.4103/0378-6323.37078. [DOI] [PubMed] [Google Scholar]
- 8.Wink DM. Web-based collaboration tools. Nurse Educ. 2009;34:235–7. doi: 10.1097/NNE.0b013e3181bc7348. [DOI] [PubMed] [Google Scholar]
- 9.Security and privacy overview. [Internet]. [cited 2013]. Available from: http://support.google.com/