

1. Introduction
Personality, or “behavioral syndromes”, are relatively stable dispositional traits and behaviors that have now been identified in a myriad of social species (Gosling, 2001; Sih et al., 2004), and with clear consequences on fitness (Smith & Blumstein, 2008). The canalization of personality during development and relative stability thereafter, despite varying circumstances over the life course that might otherwise favor greater plasticity, is an important problem attracting much theoretical and empirical attention (Dall et al., 2004; Dingemanse et al., 2010). Further, personality is highly heritable, yet how heritable genetic variation in personality traits is maintained over generations remains another conundrum (Buss & Hawley, 2011). If selection effects on personality vary over space or time, or by organismal state or condition, then variation in personality could be adaptive. Frequency-dependence could also affect fitness if payoffs vary based on the frequency of personalities in the population. However, empirical evidence to support these adaptive explanations is sparse in humans. One approach to studying the adaptive value of personality variation considers costs and benefits of specific dispositions, and how these may maintain multiple phenotypic equilibria along personality dimensions. Extraverted individuals may be bold, sociable and may obtain greater mating access, but may also incur greater risks of injury, morbidity and mortality (Nettle, 2006). Conscientious individuals may be goal-oriented, hard working, and cautious about health, but may also miss out on short-term mating and resource opportunities (Schmitt, 2004). Neurotic individuals may be prone to greater depression, anxiety and chronic stress, but may also be more risk-averse and vigilant concerning environmental dangers (Nettle, 2006).
A theory of personality that specifies its ontogeny, the contributions of life history strategy and social norms, and the ways by which selection pressures impact personality variation over space and time, remains lacking. Furthermore, existing models of decision-making in the social sciences rarely consider dispositional traits as critical components of behavioral strategies. The standard framework underlying decision-making in optimization models assumes that situational costs and benefits impact all individuals equally, except when individuals vary by condition or state. (Almlund et al., 2011). Across many species and taxa, however, individuals often act consistently across contexts and over time when the standard approach predicts more flexible “optimal” responses (Bell et al., 2009).. What we can learn about personality variation in small-scale societies will aid our understanding of the selection pressures responsible for shaping human personality traits. It is in small-scale societies that humans have lived for the majority of our existence. Variation within and across modern small-scale societies in access to contraception, health care, formal legal systems, or the market economy present unique opportunities to understand the origins of human personality variation and how personality responds to socioecological context.
Most human personality studies to date are descriptive, aimed at testing the existence of a specific personality structure (e.g. Big Five) based on inductive factor analysis of self- or third-party reports (e.g. McCrae & Terracciano, 2005; Schmitt et al., 2007). Approaches in evolutionary psychology have traditionally focused on human universals, and with a few exceptions (e.g. Buss, 1991; MacDonald, 1995; Wilson, 1994), have only recently attempted to explain individual variability (Buss & Hawley, 2011). Almost all studies have been restricted to low-fertility, heterogeneous, modern populations. In these societies, personality variation in the “Big Five” is associated with a variety of outcomes affecting health, mortality, education and income (Ozer & Benet-Martinez, 2006). It also correlates with reproductive behavior among Australian and U.S. adults (Eaves et al., 1990; Jokela et al., 2011). Only two studies have examined fitness correlates of personality variation in natural fertility populations. Among rural Senegalese farmers, extraverted men and women with intermediate levels of neuroticism have more children (Alvergne et al., 2010). Among Ache forager-farmers, extraverted men have more children (Bailey et al., 2013). Both studies, however, have small sample sizes, do not consider potential costs of specific dispositions, nor whether dispositions co-vary with observed fitness-related behavior.
Here we investigate the relationship between personality and fitness among Tsimane forager-horticulturalists of Bolivia with four goals in mind. We first explore the relationship between reproductive success (RS) and two sets of personality dimensions: the traditional Big Five and a population-specific Big Two derived from exploratory factor analysis (“pro-sociality” and “industriousness”) for both men and women. While among Tsimane the Big Five correlate with observed behavior and are replicable, their internal consistency is lower than commonly encountered; for this reason, we provide the Big Two as an alternative and more robust personality structure (Gurven et al., 2013). Fitness is proxied as age-specific cumulative fertility, offspring survivorship, and age at first reproduction (AFR). In natural fertility populations without deliberate fertility control, these are reliable measures of future genetic representation. AFR is the most indirect fitness measure of the three, but has been linked to fitness among Tsimane and other subsistence populations (von Rueden et al., 2011).
Second, we consider potential costs of several personality traits by testing for longitudinal associations with health indicators and frequency of social conflicts among men in a society lacking modern healthcare and a formal legal system. Prospective study permits causal inference beyond simple correlation between personality and health. Third, we examine several behavioral correlates of personality that relate to fitness, such as time spent in productive tasks, direct care of offspring, social visitation and number of extramarital affairs. Fourth, we assess the heritability of personality by considering multigenerational pedigrees. Heritability describes the proportion of variance in an observable trait within a population that is due to inter-individual variance in genetic factors. Hence, the heritability of personality describes the extent to which selection can maintain variability in personality within a particular population (Falconer & Mackay, 1996). As our estimate is not based on an adoption or twin study, and so does not completely control for shared environment, we label our estimate “quasi”-heritability. We consider different modes of selection in the interpretation of personality-fitness associations: stabilizing, directional and fluctuating (in which the fittest phenotype within a population varies across time, space or by individual condition). Highest fitness at intermediate levels of personality traits is consistent with stabilizing selection on personality, while linear effects are consistent with directional selection. Variation in personality and the personality-fitness relationship by geographic region is consistent with spatially fluctuating selection. Fluctuating selection is also consistent with personality-fitness relationships differing among men and women. Men and women may be expected to differ in personality because their reproductive, social and parental investment strategies may diverge (Schmitt et al., 2008).
2. Methods
2.1. Study Population
Tsimane are semi-sedentary forager-horticulturalists of Amazonian Bolivia, inhabiting over 90 villages ranging from 50–500 individuals. They cultivate plantains, rice, corn, and sweet manioc in small swiddens, and regularly fish and hunt for meat. These foods together provide over 90% of the calories in the diet, with the remainder coming mainly from store-bought items or trade with itinerant merchants. Tsimane live in extended family clusters, where the majority of food- and labor-sharing occurs. Polygyny exists at low frequencies (~5%) and is concentrated in more remote communities. Approximately 20% of offspring never reach age 5 (Gurven et al., 2007). The Tsimane rarely use modern contraceptives and total fertility rate is very high (~9 births per woman). The population growth rate is 3.6% per year. Mean±SD age of first birth for men and women in this sample is 22.8±4.2, and 18.6±2.9 yrs, respectively.
Many villages now have schools, taught by bilingual Tsimane teachers, most of whom were trained by missionaries. Secondary schools now exist in several larger villages, and young Tsimane adults are starting to become high school graduates. However, overall adult literacy rate is low (25%). Fluency in Tsimane language is universal, and 40% of adults are moderately fluent in Spanish.
2.2. Personality Instrument
The 43-item Tsimane Big Five Inventory (BFI) was administered to 632 adults from 28 villages from Jan 2009-Dec 2010, as part of the Tsimane Health and Life History Project (THLHP) (see Gurven, et al., 2013). Average age is 47±14 yrs (range 20–88). The Tsimane BFI was conducted verbally in a private location by a male, bilingual Tsimane research assistant trained in the administration of anthropological and psychological interviews. As in the English version of the BFI, responses were given on a translated scale where 1 corresponds to “strongly disagree” and 5 corresponds to “strongly agree.” Participants were first given a quick tutorial and comprehension test on the use of the scale, after which all participants showed clear evidence of understanding the scale, and the task. Additional details are given in (Gurven, et al., 2013). The least internally consistent item was removed from each of the five personality dimensions (E, C, A, O, N), which were then scored according to standard protocol, and standardized as percentage of the maximum possible score (Benet-Martinez & John, 1998). The Tsimane-specific “Big Two” (Prosociality, Industriousness) was derived from exploratory factor analysis and validated against a separate sample of spouse-derived ratings, as described in (Gurven, et al., 2013); the Big Two are presented as z-scores. See supplementary material for factor internal reliability and inter-factor correlations (Table S1 and S2).
2.3. Fitness, behavior and health
Data on fertility and offspring survivorship come from reproductive histories, updated censuses and medical histories from 2002–2010 (Gurven, et al., 2007). Number of sex partners before and after marriage (men only) come from a subset of the demographic interviews conducted by MG (n=83). Tsimane adult men (n=208) from four villages were asked to list and describe any conflicts they had with other individuals over the past six months. Conflict frequency was operationalized as the number of times ego was named as having been involved in a conflict by all interviewees in the village. Time spent working in productive tasks, parenting and visiting was measured for a subset of individuals (n=90) using behavioral scans with 3-hr household cluster sampling, as described in Gurven, Winking, et al. (2009). Work here is defined as food production and wage labor.
Prospective measures of health status include body mass index (BMI), C-reactive protein (CRP), erythrocyte sedimentation rate and leukocyte counts, determined from serum samples collected during subsequent THLHP clinic visits. The average time of follow-up from personality assessment was 2.1 years (SD=0.8, range 1–3 years). Biomarker collection and analysis procedures are described in Gurven, Kaplan, et al. (2009). Additional covariates, such as years of schooling, Spanish fluency (none, little, fluent) and village distance to town (in km), were measured during annual census updates.
Procedures for all methods described here have been approved by the UCSB Human Subjects Review Board, Tsimane government (Gran Consejo Tsimane), village leaders, and study participants.
2.4. Data Analysis
Effects of personality on RS are analyzed using multilevel regression where geographic region is modeled with a random intercept. Models of fertility and number of surviving offspring were also analyzed using a Poisson error distribution, although no differences with the above regressions were found. For analysis of offspring survivorship, extramarital affairs and health outcomes, a control variable designating the temporal lag between personality inventory and demographic interview or medical checkup was added. Regional variation in the personality-fitness relationship was investigated treating region as a fixed effect and including interaction terms using OLS regression. Quasi-heritability was estimated using a variance components model with the software Sequential Oligonucleotide Linkage Analysis Routines (SOLAR) (Falconer & Mackay, 1996). The model takes as input pedigrees for the 632 individuals in our sample, and controls for age, age2, sex, and village affiliation. We include the age2 term due to the observed age effects shown in Figure S1.
3. Results
Descriptive statistics for personality measures and covariates by sex are provided in Table 1.
Table 1.
Descriptive statistics for independent and dependent variables
| MALES | FEMALES | |||||||
|---|---|---|---|---|---|---|---|---|
|
|
|
|||||||
| Variable | Mean± SD | Min. | Max. | N | Mean± SD | Min. | Max. | N |
|
|
|
|||||||
| Socio-demographics | ||||||||
| Age (years) | 46.9±14.5 | 21.0 | 88.0 | 326 | 46.4±14.4 | 20.0 | 88.0 | 305 |
| Years of schooling | 1.6±2.7 | 0.0 | 12.0 | 307 | 0.8±1.4 | 0.0 | 8.0 | 285 |
| Spanish fluencya | 1.0±0.8 | 0.0 | 2.0 | 308 | 0.5±0.7 | 0.0 | 2.0 | 287 |
| Village size (n) | 215.0±163.1 | 9.0 | 524.0 | 314 | 237.9±173.5 | 9.0 | 524.0 | 303 |
| Distance to San Borja (km) | 41.9±24.3 | 5.9 | 82.2 | 326 | 43.2±24.3 | 5.9 | 82.2 | 306 |
| Fitness proxies | ||||||||
| Age at birth of 1st child | 22.8±4.2 | 16.0 | 39.0 | 200 | 18.6±2.9 | 12.0 | 36.0 | 226 |
| # lifetime sexual partners | 3.4±5.1 | 0.0 | 29.0 | 83 | ----- | ----- | ----- | ----- |
| # surviving children | 6.9±4.2 | 0.0 | 21.0 | 229 | 7.4±3.4 | 0.0 | 16.0 | 299 |
| Health status | ||||||||
| BMI (kg/m2) | 23.8±2.6 | 15.6 | 36.4 | 316 | 24.1±3.6 | 17.0 | 37.9 | 297 |
| Hemoglobin (g/dL) | 14.3±7.3 | 5.9 | 143.0 | 322 | 12.7±1.1 | 9.4 | 15.8 | 296 |
| Sedimentation rate (mm/hr) | 29.6±20.8 | 1.0 | 112.0 | 241 | 40.4±20.0 | 3.0 | 105.0 | 226 |
| White blood cell count (WBC) (cells/mm3) | 10754±2507 | 4200 | 20000 | 311 | 11031±2822 | 4500 | 20700 | 293 |
| Eosinophil count (cells/mm3) | 2036±1060 | 416 | 7760 | 235 | 1976±1051 | 204 | 6072 | 224 |
| C-Reactive Protein (mg/L) | 3.1±2.3 | 0.7 | 10.5 | 54 | 3.6±4.8 | 0.6 | 31.1 | 50 |
| Cortisol-creatinine ratio | 264.3±168.6 | 6.3 | 855.1 | 160 | 269.5±172.8 | 9.1 | 1080.2 | 164 |
| Personality factors (% of maximum score, or factor score) | ||||||||
| Agreeableness | 78.9±9.9 | 47.5 | 97.5 | 326 | 71.7±10.6 | 42.5 | 97.5 | 306 |
| Conscientiousness | 74.8±10.2 | 37.5 | 95 | 326 | 64.0±11.2 | 35.0 | 92.5 | 306 |
| Extraversion | 70.9±14.2 | 34.3 | 100.0 | 326 | 58.9±13.0 | 31.4 | 100.0 | 306 |
| Neuroticism | 61.9±10.3 | 37.1 | 88.6 | 326 | 69.5±10.2 | 40.0 | 97.1 | 306 |
| Openness | 71.4±10.8 | 40.0 | 95.0 | 326 | 61.0±9.6 | 37.5 | 87.5 | 306 |
| Industriousness | 0.4±0.8 | −3.9 | 2.0 | 326 | −0.4±1.0 | −3.5 | 1.9 | 306 |
| Prosociality | 0.2±1.0 | −2.3 | 2.2 | 326 | −0.2±0.9 | −2.3 | 2.1 | 306 |
Note: San Borja is the largest town in the Tsimane area (pop’n ~24,000)
3.1. Does personality vary by age and sex?
Tsimane men are more extraverted (E), open (O), conscientious (C), agreeable (A), and less neurotic (N) than women (Table S1, Figure S1). Men also score substantially higher in prosociality (P) and industriousness (I) (Table S1, Figure S1). These sex differences are 9–17% of the maximum scores for each factor, and remain after controlling for age. We further control for Spanish fluency, literacy and schooling due to men having higher levels of each (Table 1). After these additional controls, the sex difference reduces by a range of 4% (for I) to 56% (for P), and from 11–30% for the Big Five. Sex differences persist across adulthood, but diminish slightly with age. Only C, P and I vary systematically with age (Table S3).
3.2. Is personality associated with reproductive success?
3.2.1. Men
Men with higher E, O, and C, and lower N have greater fertility and more surviving offspring, but do not start reproduction earlier (Table 2, S4). While age at first reproduction (AFR) is largely unrelated to personality using the Big Five, I is significantly associated with later reproduction (β=.86, p=0.037). These results hold after controlling for age, schooling and Spanish fluency and using region as a random effect. One SD unit difference in E, N, C, and O is associated with a difference in 0.94, −0.70, 0.85, and 0.54 additional children, respectively (Table 2). One SD unit increase in I is associated with 0.53 additional children, respectively (same controls). All results for E, N and C, and for I on total surviving children (Table S4) withstand Bonferonni corrections for multiple tests (p<0.01).
Table 2.
Association between selected reproductive success measures and personality for men and women, using mixed effects regression models. All models control for age, education, Spanish fluency and time lag between demographic and personality interview, with region as random effect (see Table S4 for additional tests and exact p-values)
| RS Measure | FERTILITY | % OFFSPRING DYING < AGE 15 | |||
|---|---|---|---|---|---|
| Personality Factor | b | p | std. beta | b | p |
| MEN | (n=215) | (n=198) | |||
| Extraversion | 0.066 | *** | 0.23 | 0.044 | ns |
| Neuroticism | −0.068 | ** | −0.17 | −0.136 | ns |
| Agreeableness | 0.024 | ns | 0.06 | −0.049 | ns |
| Conscientiousness | 0.084 | ** | 0.20 | −0.117 | ns |
| Openness | 0.051 | * | 0.13 | 0.020 | ns |
| Pro-sociality | 0.392 | ns | 0.10 | 0.640 | ns |
| Industriousness | 0.632 | ^ | 0.13 | −2.597 | ns |
| WOMEN | (n=274) | (n=274) | |||
| Extraversion | −0.009 | ns | −0.04 | −0.096 | ns |
| Neuroticism | 0.002 | ns | 0.01 | 0.019 | ns |
| Agreeableness | 0.014 | ns | 0.04 | −0.050 | ns |
| Conscientiousness | −0.003 | ns | −0.01 | −0.145 | ns |
| Openness | −0.025 | ns | −0.07 | −0.090 | ns |
| Pro-sociality | −0.325 | ns | −0.09 | −1.401 | ns |
| Industriousness | 0.166 | ns | 0.05 | 0.944 | ns |
p<.1,
p<.05,
p<.01,
p<.001
The effects of personality on RS are derived largely from fertility, as personality is not associated with the percentage of live births resulting in death before age 15 in multivariate regressions (Table 2).
Mean±SD number of non-marital sex partners is 3.4±5.1 (range: 0 to 29), 2.3±2.9 (range: 0–15) before marriage and 1.0±3.2 (range: 0–19) after marriage. Controlling for age and Spanish fluency, men with greater E, A and O have more sex partners. One SD unit increase in these personality factors is associated with 1.7 (p=0.003), 1.7 (p=0.024), and 1.2 (p=0.037) additional partners, respectively. The relationship between P and non-marital partners trends toward significance, with one SD unit increase associated with 1.0 additional partners (p=0.076).
3.2.2. Women
None of the Big Five or Big Two factors is significantly associated with fertility, number of surviving offspring, or AFR among women (Table 2, S4). Higher C is marginally associated with lower percentage of offspring dying before age 15 (Table 2).
3.3. Intermediate optima for personality?
We test for the presence of intermediate optima for personality for each fitness outcome by including a quadratic term for each personality factor in regression analyses from Tables 2 and S4 that control for age, Spanish fluency and education, and using region as a random effect. A quadratic effect is only marginally significant for I and number of surviving offspring among both men (linear term, p=0.018; quadratic term, p=0.092) and women (linear term, p=0.020, quadratic, p=0.055). Among men, highest number of surviving children is 7.2 children when I=1.1 (Figure S2a); mean±SD I for men is 0.39±0.84. Among women, there is no intermediate optimum; highest RS is associated with greatest level of I, whereas median I is much lower (I=−0.31) (Figure S2b). O and C could be confounded by education and Spanish fluency, but reduced models eliminating these two covariates did not change results.
3.4. Are there costs of high E, O, P, I, or low N?
3.4.1. Health
The relationship between personality and health was studied using seven measures collected during clinic visits: urinary cortisol, BMI, hemoglobin, CRP, leukocyte and eosinophil counts and erythrocyte sedimentation rate. We restrict analysis to E, N, O, P and I to limit the number of statistical tests, and because three of these factors have been previously linked to morbidity (Nettle, 2006). Most relationships in Table 3 are consistent with better health among those with greater E, O, P and I, and lower N. Only two cases are consistent with worse health: leukocyte count and eosinophils are higher among more industrious men (r=0.19, p=0.023, n=145; r=0.24, p=0.003, n=144, respectively) (Table 3). However, with Bonferroni corrections for multiple tests (5 factors*7 health measures), a conservative adjusted critical p-value is 0.05/35=0.0014. Both relationships showing greater health costs do not meet this criterion. In total, only 4 of the 13 significant relationships in Table 3 remain using this criterion, and all are consistent with higher E, O and I associated with better health. Controlling for measures of baseline health permits stronger causal inference, but reduces sample size; results from analyses controlling for baseline health are largely similar to those reported here (Table S5).
Table 3.
Health correlates of personality.
| Variable: | Men
|
(n) | Women
|
(n) | ||||||||
|---|---|---|---|---|---|---|---|---|---|---|---|---|
| E | N | O | P | I | E | N | O | P | I | |||
| lnCortisol | − | −− | − | 78 | − | 155 | ||||||
| BMI | ++ | ++ | + | 168 | 184 | |||||||
| Hb | + | 149 | − | + | 204 | |||||||
| lnCRP | 139 | 157 | ||||||||||
| WBC | + | 145 | − | − | 163 | |||||||
| Sed Rate | −− | 148 | 207 | |||||||||
| Eosinophil | − | ++ | 145 | − | 163 | |||||||
“+” indicates significant (p<0.05) positive relationship between personality factor and health measure; “−“ indicates significant (p<0.05) negative relationship. Double ++ or −− symbol connotes statistical significance after Bonferroni correction (p<0.002). Dark shading denotes effect size of 0.2<partial r<0.3, or 0.1<partial r<0.2 otherwise. Models control for age and time between personality assessment and subsequent clinic visit. CRP and cortisol are logged due to non-normal distribution of raw values.
lnCRP=log(C-reactive protein), Hb=hemoglobin, WBC=white blood cells
3.4.2. Conflicts
Mean±SD number of conflicts for men in the past six months is 1.4±2.1 (range 0–11, n=62). Conflicts are primarily verbal disputes but occasionally escalate into physical violence. Over one-fourth of conflicts concern disputes over access to desired land for horticulture. Arguments over insufficient contributions to community projects, disputes over reconciling debts in a timely fashion, conflicts over marital infidelity, and accusations of theft each account for 1/8 of all conflicts. Most conflicts are resolved by the parties directly involved or with arbitration from influential members of the community (e.g. village chief). Some, however, remain unresolved and/or provoke migration to other communities.
Controlling for age and region, E and O are marginally associated with greater number of conflicts. One SD unit increase in E and O is associated with 0.45 (p=0.081) and 0.42 (p=0.052) more conflicts, respectively. P is positively associated with conflicts (std. β=0.63, p=0.006), while I is negatively associated with conflicts (std β=−0.75, p=0.017). Prior research showed that larger men were judged by other Tsimane as more dominant and aggressive, and therefore more prone to conflicts (von Rueden et al., 2008). Adding BMI to these models eliminates the effects of E and O on conflicts, as BMI is positively related to both of these personality factors and to conflicts. The effects of P and I, however, remain significant after controlling for BMI (p=0.027, p=0.036, respectively).
3.5. Regional differences
Linear regressions that control for age, sex, education and schooling reveal substantial differences in personality factors across geographic regions (Table 4). Relative to those living near town, Tsimane living downriver within a protected forest reserve score higher in N, but lower in A, O and P. Those living in remote villages upriver from town score higher in A, P and I, but trend towards lower C (Table 4).
Table 4.
Regional differences in personality scores (n=281). Analyses are multiple linear regressions controlling for age, sex, age* sex, age* age, schooling and Spanish fluency. Baseline is near town.
| Downriver | Forest | Upriver | ||||
|---|---|---|---|---|---|---|
|
| ||||||
| Personality Factor | B | p | B | p | B | p |
| Extraversion | −2.31 | ns | −0.36 | ns | −0.62 | ns |
| Neuroticism | 4.09 | *** | 1.71 | ns | 0.76 | ns |
| Agreeableness | −3.32 | ** | 0.29 | ns | 2.34 | * |
| Conscientiousness | −1.36 | ns | −1.44 | ns | −1.81 | ^ |
| Openness | −3.18 | ** | 2.66 | * | 1.13 | ns |
| Prosociality | −0.26 | * | −0.04 | ns | 0.37 | *** |
| Industriousness | 0.04 | ns | 0.08 | ns | 0.21 | * |
p<.1,
p<.05,
p<.01,
p<.001
Forest, Upriver are both remote regions; Downriver refers to villages closer to town located within the Beni Biological Reserve
3.6. Does the relationship between reproductive success and personality vary by region?
If so, this would suggest that selection pressures could vary by region, consistent with models of fluctuating selection that help maintain genetic variation in personality traits. We test this by adding a region*personality factor interaction variable to each of the regression models in Table 2 and S4. For three fitness measures (fertility, percentage or total number of surviving children and AFR) and seven personality factors, there are 42 possible interaction terms to test. We find significant interaction terms in 6 of the 42 possible analyses. Figure 1 illustrates three of these, and Figure S3 shows the remaining three (see Table S6 for parameter estimates).
Figure 1.
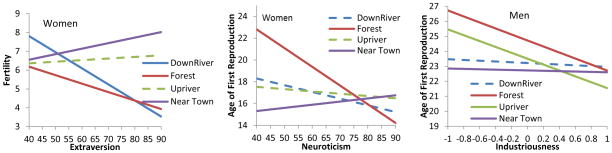
The relationship between personality and fitness varies by region. A) Extraversion and fertility among women; B) Neuroticism and age at first reproduction among women; C) Industriousness and age at first reproduction among men. All models control for age, Spanish fluency and schooling. Dashed lines refer to regions that were not significantly different from baseline (near town). Statistical models are given in Table S6, and additional relationships are graphed in Figure S3.
Despite no significant relationships between personality and fitness among women (Table 2), adding a personality*region interaction term produces four significant relationships among women. The greatest contrast is between women living near town and those in the forest. Among women near town, fertility increases with I and E, total surviving children increases with P, and AFR increases with N (Figures 1 and S4; Table S6). Among women residing in the forest, each of these relationships is in the opposite direction: fertility is lower among women scoring higher in I and E; women scoring higher in P have fewer surviving offspring, and those scoring higher in N start reproducing earlier. Women living upstream along the Maniqui River largely show similar relationships between personality factors and fitness as women near town, whereas women living downstream in the protected reserve show a mix of the forest and near town patterns. However, the N-AFR relationship is the only regional difference that remains significant with a Bonferroni corrected p-value of 0.002.
Among men, the relationship between AFR and P and I varies by region. Near town and downriver, there is no relationship between personality and AFR. In the forest, men scoring higher in I and lower in P initiate reproduction earlier (Figures 1 and S4; Table S6). Men living upriver show a mix of these two patterns.
3.7. Personality and activity budgets
To explore possible behavioral pathways by which personality may impact fitness, we examine the relationship between men’s and women’s personality traits and time spent in fitness-related activities. We test whether time spent working is positively associated with C and I, whether time spent in direct childcare is positively associated with C and negatively associated with E and O, and whether time spent socializing is positively associated with E, A, O and P, and negatively with I.
We find partial support for these predictions, and most significant relationships are borne out only among men. Controlling for age, men with greater C and I spend significantly more time working (std. β=0.445, p=0.002; β =0.433, p=0.008; n=49). Among women, only lower P is associated with work time (β =−0.331, p=0.037) (same controls, n=41). Controlling for age and number of surviving children, men with greater O spend less time in child care (β =−0.301, p=0.040). Among women, greater A is associated with less time in childcare (β =−0.267, p=0.026) (same controls). Controlling for age and village size, greater E, A, O and P are positively correlated with time spent socializing by men (β =0.247, p=0.099; β = 0.335, p=0.022; β =0.273, p=0.048; β=.317, p=.021). Higher I is associated with less time socializing for men (β =−0.342. p=0.046), but more time socializing for women (β =0.330, p=0.048).
3.8. Heritability of personality
Estimates of the additive genetic variance contributing to personality differences range from 0.08 for N to 0.60 for P, controlling for age, age2, sex, age*sex, and village of residence (n=632) (Table 5). These quasi-heritability estimates are only approximations of heritabilities since we do not control for any shared environmental effects.
Table 5.
Quasi-heritability estimates (h2) are result of quantitative genetic models conducted with Sequential Oligonucleotide Linkage Analysis Routines software (SOLAR). Models take as input pedigrees for individuals in our sample and include sex, age, age* age, age* sex, and village of residence as covariates.
| Personality Factor | h2 | SE | p |
|---|---|---|---|
| Extraversion | 0.594 | 0.100 | *** |
| Neuroticism | 0.084 | 0.071 | ns |
| Agreeableness | 0.270 | 0.083 | *** |
| Conscientiousness | 0.251 | 0.083 | *** |
| Openness | 0.264 | 0.099 | *** |
| Prosociality | 0.598 | 0.098 | *** |
| Industriousness | 0.117 | 0.075 | * |
p<.1,
p<.05,
p<.01,
p<.001
4. Discussion
In a natural fertility context with rapid population growth, we find that greater E, C, O and I, and lower N, are associated with higher fertility and reproductive success among men. Fitness differences due to personality among men are realized through increased fertility rather than offspring survival. These differences persist when other potential confounds like age, schooling and Spanish fluency are controlled. Furthermore, only men lower in I had an earlier age at first birth, so earlier initiation of reproduction is not driving the relationship between men’s personality and fitness.
Among men, personality traits were associated with more time spent working and socializing. Productivity is highly valued by potential mates and allies (Gurven, et al., 2009), and greater access to resources should increase fertility and improve offspring survivorship. Socializing is an important venue for cementing allies and social partners, gaining valuable information, organizing collective labor, and obtaining potential mates. In a previous study, we found that Tsimane men who are visited more often, have more allies, and are more influential have more surviving offspring (von Rueden, et al., 2011).
On the other hand, we find no global relationships between personality factors and fitness outcomes among women (cf. Alvergne, et al., 2010). The relationship between women’s personality and fitness is only revealed when considering regional variation. The personality-fitness relationship for several personality factors differs among forest and near town regions. Living near town in close proximity to roads and schools can provide mating and market opportunities for individuals high in E, O and P. Few relationships between personality and time usage were found among women: lower P is associated with more time spent working, yet higher I is associated with time spent socializing. The latter result is unexpected, although women are commonly observed socializing while working, and exchange of social information may enhance productivity.
Our health measures were taken on average two years after personality assessment and so permit causal inference. While greater scores in multiple personality factors are positively associated with fitness in men, we find evidence of no substantial health cost subsequently. Instead, we only found that leukocyte and eosinophil counts were higher in men with greater I, and that men with greater E and O may be more prone to conflicts. Higher eosinophils suggests a higher level of parasitism, which in adults does not usually provoke serious morbidity or drastically inhibit work effort. While many conflicts are often verbal skirmishes, conflicts carry the possibility of escalating to physical fighting and injury, residential moves, or homicide in rare cases (often during drunken binges). Finally, intermediate levels of personality factors in men are not associated with optimal fitness outcomes. Our findings are based on a large sample using a valid and reliable survey instrument to assess the traditional Big Five and Tsimane-specific Big Two (Gurven, et al., 2013).
4.1. Implications for evolutionary models of personality
The fitness effects documented here and elsewhere suggest that selective neutrality, or “mutation-drift equilibrium”, is an unlikely candidate for explaining the maintenance of personality variation. Recent evolutionary approaches argue that stable differences in personality can be fitness maximizing if they operate as behavioral “reaction norms” (Denissen & Penke, 2008; Dingemanse, et al., 2010). In this view, personality traits are motivational responses to specific stimuli that are programmed, over ontogeny, by individual variation in somatic condition, and socio-ecological experience (McElreath & Strimling, 2006; Wolf et al., 2007). Invoking such an approach, Denissen and Penke (Denissen & Penke, 2008) portray E as the reward value of social interactions, A as a disposition to react cooperatively or selfishly in resource conflicts, C as the tenacity to pursue goals despite potential distractions, O as the reward value of cognitive activity and N as sensitivity to signs of social exclusion. Similarly, our derived two-factor approach can be conceptualized as dispositions to be social and cooperative (Prosociality) and to obtain rewards from active pursuit of productive goals (Industriousness). Framed in this way, personality can be interpreted as alternative general strategies for handling a variety of recurrent adaptive problems, such as extracting resources from the physical and social environment, negotiating conflicts, forming alliances, obtaining and holding on to mates, and avoiding dangers.
While personality variation according to a reaction norm approach does not require genetic variation, we nonetheless find significant heritability in our personality measures. Quasi-heritability for E and P is high at 59% and 60%, respectively, while heritability for the other personality factors ranges from 8% to 27%. The heritability of personality traits in industrial populations is usually in the range of 40–60% (Bouchard, T.J. & Loehlin, J.C., 2001). While our quasi-heritability measures account for shared village residence, we do not control for aspects of home environment that may cause similarity among kin, such as shared experiences, social support, or material resources, thereby potentially altering our estimates of heritability if shared environment contributes to personality. Our quasi-heritability estimates should be interpreted with caution, although personality studies based on adoption and twins design typically reveal small effects for shared environment (Bouchard, T.J. & Loehlin, J.C., 2001). The comparatively low heritability estimates for A, C, N, O, and I suggest relatively greater effects of environment or gene-environment interactions. This is surprising given the political egalitarianism and limited range of social niches and productive opportunities in small-scale societies. However, the differential exposure of Tsimane individuals to schooling, healthcare, and the market economy, both within and across villages, present a significant source of environmental variation. Prior to increased rates of market participation by the Tsimane in the twentieth century, we speculate that heritability estimates may have been higher.
Understanding the evolutionary basis of heritable personality variation remains one of the major outstanding questions in evolutionary biology (Mitchell-Olds et al., 2007). One set of alternatives invokes balancing or fluctuating selection, where selection pressures can vary by sex, spatially, temporally or by condition. Selection pressures varied over time and space, and differently among male and female great tits, leading Dingemanse et al. (Dingemanse et al., 2004) to conclude that genetic variation in avian exploratory behavior was maintained through fluctuating selection. Some authors have argued that humans are adept at shaping their physical and social environments and that environmental heterogeneity is the most likely reason why fluctuating selection would maintain genetic variation in personality (Laland et al., 2001; Penke et al., 2007). Consistent with these views, we found that personality varied across Tsimane territory and that its relationship with fitness outcomes also differed by region, consistent with spatial heterogeneity in ongoing selection pressures. E, P, O and A were highest in larger villages close to town and lowest in small villages close to town (Figure 1 and S3). A recent study by Jokela (2012) shows evidence of temporal variability in selection pressures, as higher C and O predicted lower fertility only among cohorts born after 1950. While we observe evidence of directional selection on men’s personality, the effects of personality on women’s reproductive success differ by region, with positive effects of E and I on fertility, and P on number of surviving children only among women living close to town; the opposite relationships were found among women living in more remote villages (Table S5; Figure 1 and S3). One possibility for this pattern is greater female choice in sexual relationships in villages closer to town, whereas arranged marriages may be more common in more traditional villages (Gurven, et al., 2009). We have no longitudinal data on personality to test for temporal variability, but it is likely that the recent availability of novel types of wealth, schooling and wage labor (all largely restricted to men) has benefited more outgoing, adventurous, curious and risk-prone men with higher mating access (Stieglitz et al., 2012).
The sex differences in personality we identify may provide an additional source of fluctuating selection. Sex differences in personality have been identified almost everywhere they have been investigated. Sex differences in Tsimane personality, however, vary from those widely observed around the world. Across 55 nations and using the same BFI instrument to assess personality, women tend to score higher in E, A, C and N. While we also find that N is higher among women, we find that men score substantially higher in E, A, C, O, P and I (Table S4; Figure S1). While ethnographic evidence and observation of interview procedures suggest otherwise, it is possible that sex differences may be inflated due to differing self-reporting styles of men and women, especially when interviews are conducted by a male researcher. We do find that the sex differences reduce but remain robust to controls for literacy, Spanish fluency and years of schooling. Greater E and O are consistent with behavioral observations showing Tsimane men’s greater travel to other villages and town, and overt locution at village meetings. Greater P among men is consistent with higher pro-social behavior as revealed by economic games (Gurven, 2004). It has been argued that sex differences are amplified in developed societies where fewer constraints are believed to tether free expression of personality (Schmitt, et al., 2008). However, we find that sex consistently has the largest effect in most models presented here. In populations with marked divisions of labor, and where entrepreneurial opportunities are limited to one sex, sex differences in personality might also be common. Consistent with our results, E, A and O are more likely to be higher among men than women in developing countries (Schmitt, et al., 2008).
An alternative scenario to fluctuating selection focuses on the balance between accumulation of weakly deleterious mutations and selection against them, or mutation-selection balance; in this case, selection favors an optimal phenotype but does not weed out the accumulation of weak mutations (Penke, et al., 2007). A recent study of Cloninger personality traits analyzed 250,000 SNPs on 8,000 Australians and Finns, and found results consistent with mutation-selection balance (Verweij et al., 2012). Most of the genetic variation they encountered was due to rare variants and non-additive genetic effects. It is possible that several evolutionary processes can be operating simultaneously to produce the heritability in personality we find among the Tsimane: directional selection has yet to reach new phenotypic optima, the direction and strength of selection vary by geographic region and by sex, and mutation maintains variation around these local optima. A final possibility is that personality appears heritable because it is a facultative response (i.e. reaction norm) to genetic variation in condition-dependent traits (e.g. BMI) elsewhere in the phenotype. For example, genetic cues of future somatic condition trigger a reaction norm that optimally calibrates the level of extraversion (Lukaszewski & Roney, 2011).
4.2. Limitations
Our personality-fitness correlations were based on cross-sectional data or retrospective data (e.g. lifetime fertility), and so causal inference is difficult to assess without a longitudinal study design. However, the associations we find between E, N, O and fertility parallel previous findings in other populations (Alvergne, et al., 2010; Jokela, et al., 2011; Nettle, 2006). Personality is a relatively stable characteristic with most change established by adolescence (Caspi et al., 2005; Roberts & DelVecchio, 2000). While life events can affect personality, and bidirectional effects may exist between child rearing and personality, having children seems to show minimal effects on personality (Specht et al., 2011), or instead appears only to strengthen existing dispositions rather than alter personality in a substantial way. Ongoing data collection on Tsimane marriage, fertility and child survivorship will permit longitudinal follow-up in several years to test whether causal inference is warranted.
Another limitation is that we were unable to examine effects of personality on adult survivorship, and so cost measures are confined to health and conflicts, and fitness measures are restricted to reproductive outcomes. Another limitation is that due to cultural feasibility, data on EPCs and conflicts were collected among men, but not among women. Nettle suggests that mortality might be higher among men with higher E and O (Nettle, 2006), and other studies have related lower C (Martin et al., 2007) and both lower and higher N to greater mortality (Friedman et al., 2010). If there were strong relationships between E, O, C or N and mortality we would expect lower levels of these factors at later adult ages due to mortality selection. However, we did not observe late life declines in E, O or N (Figure S1; Table S3). In fact, the strongest age-related declines were found for C and I, while N and P saw slight increases in later adulthood. Although personality traits have been shown to be relatively stable and consistent over the life course, they also show systematic shifts with age and life stage (Roberts et al., 2006). Among Tsimane, I and C peak in middle age at the same time that caloric production also peaks, while I, C and caloric production decline thereafter (Gurven, et al., 2009). Prosociality is highest among young men, during the period when men are establishing reputations in their communities and extended networks. It also increases at late ages among post-reproductive aged women who may be actively helping their adult children and grandchildren. Such shifts might reflect general motivational changes due to the variable adaptive problems commonly faced by men and women during different life stages.
5. Conclusion
The evolutionary fitness consequences of human personality variation has been difficult to assess because of the main focus on modern societies with controlled fertility (Alvergne, et al., 2010; Gurven, et al., 2013). Yet even in modern societies, personality predicts income, occupation, reproduction, marital stability and other fitness-relevant outcomes in both sexes (Ozer & Benet-Martinez, 2006). Personality has equally strong effects as cognitive ability and socioeconomic status in predicting mortality, divorce and occupation (Roberts et al., 2007). Here we showed that personality varies within and among sexes, that variation carries fitness consequences under natural fertility conditions, and that those consequences may vary locally and between men and women. We also showed evidence for how personality might impact fitness through several behavioral pathways. Ongoing changes in Tsimane socioeconomic environment will likely provide additional opportunities for personality variation to impact life trajectories and outcomes.
Supplementary Material
Acknowledgments
We are grateful to all Tsimane for their participation, and to THLHP personnel. Marino Lero Vie assisted with data collection. Funding was provided by NIH/NIA (R01AG024119 and R56AG024119).
Footnotes
Publisher's Disclaimer: This is a PDF file of an unedited manuscript that has been accepted for publication. As a service to our customers we are providing this early version of the manuscript. The manuscript will undergo copyediting, typesetting, and review of the resulting proof before it is published in its final citable form. Please note that during the production process errors may be discovered which could affect the content, and all legal disclaimers that apply to the journal pertain.
References
- Almlund M, Duckworth AL, Heckman JJ, Kautz TD. Personality psychology and economics. In: Hanushek EA, Machin S, Woessmann L, editors. Handbook of the Economics of Education. Vol. 4. Waltham, MA: Elsevier; 2011. pp. 1–181. [Google Scholar]
- Alvergne A, Jokela M, Lummaa V. Personality and reproductive success in a high-fertility human population. Proceedings of the National Academy of Sciences. 2010;107(26):11745. doi: 10.1073/pnas.1001752107. [DOI] [PMC free article] [PubMed] [Google Scholar]
- Bailey DH, Walker RS, Blomquist GE, Hill KR, Hurtado AM, Geary DC. Heritability and Fitness Correlates of Personality in the Ache, a Natural-Fertility Population in Paraguay. PLoS ONE. 2013;8(3):e59325. doi: 10.1371/journal.pone.0059325. [DOI] [PMC free article] [PubMed] [Google Scholar]
- Bell AM, Hankison SJ, Laskowski KL. The repeatability of behaviour: a meta-analysis. Animal Behaviour. 2009;77(4):771–783. doi: 10.1016/j.anbehav.2008.12.022. [DOI] [PMC free article] [PubMed] [Google Scholar]
- Benet-Martinez V, John OP. Los Cinco Grandes across cultures and ethnic groups: Multitrait–multimethod analyses of the Big Five in Spanish and English. Journal of Personality and Social Psychology. 1998;75:729–750. doi: 10.1037//0022-3514.75.3.729. [DOI] [PubMed] [Google Scholar]
- Bouchard TJ, Loehlin JC. Genes, evolution, and personality. Behavior Genetics. 2001;31:243–273. doi: 10.1023/a:1012294324713. [DOI] [PubMed] [Google Scholar]
- Bouchard TJ, Loehlin JC. Genes, evolution, and personality. Behavior Genetics. 2001;31(3):243–273. doi: 10.1023/a:1012294324713. [DOI] [PubMed] [Google Scholar]
- Buss DM. Evolutionary personality psychology. Annual Review of Psychology. 1991;42:459–491. doi: 10.1146/annurev.ps.42.020191.002331. [DOI] [PubMed] [Google Scholar]
- Buss DM, Hawley PH. The evolution of personality and individual differences. Oxford Univ Pr; 2011. [Google Scholar]
- Caspi A, Roberts BW, Shiner RL. Personality Development: Stability and Change. Annual Review of Psychology. 2005;56(1):453–484. doi: 10.1146/annurev.psych.55.090902.141913. [DOI] [PubMed] [Google Scholar]
- Dall SRX, Houston AI, McNamara JM. The behavioural ecology of personality: consistent individual differences from an adaptive perspective. Ecology Letters. 2004;7(8):734–739. [Google Scholar]
- Denissen JJA, Penke L. Motivational individual reaction norms underlying the Five-Factor model of personality: First steps towards a theory-based conceptual framework. Journal of Research in Personality. 2008;42(5):1285–1302. [Google Scholar]
- Dingemanse NJ, Both C, Drent PJ, Tinbergen JM. Fitness consequences of avian personalities in a fluctuating environment. Proceedings of the Royal Society of London, Series B: Biological Sciences. 2004;271(1541):847–852. doi: 10.1098/rspb.2004.2680. [DOI] [PMC free article] [PubMed] [Google Scholar]
- Dingemanse NJ, Kazem AJN, Réale D, Wright J. Behavioural reaction norms: animal personality meets individual plasticity. Trends in Ecology & Evolution. 2010;25(2):81–89. doi: 10.1016/j.tree.2009.07.013. [DOI] [PubMed] [Google Scholar]
- Eaves L, Martin N, Heath A, Hewitt J, Neale M. Personality and reproductive fitness. Behavior Genetics. 1990;20(5):563–568. doi: 10.1007/BF01065872. [DOI] [PubMed] [Google Scholar]
- Falconer DS, Mackay TFC. Introduction to Quantitative Genetics. Harlow, UK: Longman Group, Ltd; 1996. [Google Scholar]
- Friedman HS, Kern ML, Reynolds CA. Personality and Health, Subjective Well-Being, and Longevity. Journal of Personality. 2010;78(1):179–216. doi: 10.1111/j.1467-6494.2009.00613.x. [DOI] [PubMed] [Google Scholar]
- Gosling SD. From mice to men: what can we learn about personality from animal research? Psychological Bulletin. 2001;127(1):45. doi: 10.1037/0033-2909.127.1.45. [DOI] [PubMed] [Google Scholar]
- Gurven M. Economic games among the Amazonian Tsimane: Exploring the roles of market access, costs of giving, and cooperation on pro-social game behavior. Experimental Economics. 2004;7(1):5–24. [Google Scholar]
- Gurven M, Kaplan H, Winking J, Eid D, Vasunilashorn S, Kim J, Crimmins E. Inflammation and infection do not promote arterial aging and cardiovascular disease among lean Tsimane forager-horticulturalists. PLoS ONE. 2009;4(8):e6590. doi: 10.1371/journal.pone.0006590. [DOI] [PMC free article] [PubMed] [Google Scholar]
- Gurven M, Kaplan H, Zelada Supa A. Mortality experience of Tsimane Amerindians: regional variation and temporal trends. American Journal of Human Biology. 2007;19:376–398. doi: 10.1002/ajhb.20600. [DOI] [PubMed] [Google Scholar]
- Gurven M, von Rueden C, Massenkoff M, Kaplan H, Lero Vie M. How universal is the Big Five? Testing the Five-Factor Model of personality variation among forager-farmers in the Bolivian Amazon. Journal of Personality and Social Psychology. 2013;104(2):354–370. doi: 10.1037/a0030841. [DOI] [PMC free article] [PubMed] [Google Scholar]
- Gurven M, Winking J, Kaplan H, von Rueden C, McAllister L. A bioeconomic approach to marriage and the sexual division of labor. Human Nature. 2009;20(2):151–183. doi: 10.1007/s12110-009-9062-8. [DOI] [PMC free article] [PubMed] [Google Scholar]
- Jokela M. Birth-Cohort Effects in the Association Between Personality and Fertility. Psychological Science. 2012;23(8):835–841. doi: 10.1177/0956797612439067. [DOI] [PubMed] [Google Scholar]
- Jokela M, Alvergne A, Pollet TV, Lummaa V. Reproductive behavior and personality traits of the Five Factor Model. European Journal of Personality 2011 [Google Scholar]
- Laland KN, Odling-Smee J, Feldman MW. Cultural niche construction and human evolution. Journal of Evolutionary Biology. 2001;14(1):22. doi: 10.1046/j.1420-9101.2001.00262.x. [DOI] [PubMed] [Google Scholar]
- Lukaszewski AW, Roney JR. The origins of extraversion: Joint effects of facultative calibration and genetic polymorphism. Personality and Social Psychology Bulletin. 2011;37(3):409–421. doi: 10.1177/0146167210397209. [DOI] [PubMed] [Google Scholar]
- MacDonald K. Evolution, the five factor model, and levels of personality. Journal of Personality. 1995;63:525–568. [Google Scholar]
- Martin LR, Friedman HS, Schwartz JE. Personality and mortality risk across the life span: the importance of conscientiousness as a biopsychosocial attribute. Health Psychology. 2007;26(4):428. doi: 10.1037/0278-6133.26.4.428. [DOI] [PubMed] [Google Scholar]
- McCrae RR, Terracciano A. Universal features of personality traits from the observer’s perspective: data from 50 cultures. Journal of Personality and Social Psychology. 2005;88(3):547–561. doi: 10.1037/0022-3514.88.3.547. [DOI] [PubMed] [Google Scholar]
- McElreath R, Strimling P. How noisy information and individual asymmetries can make ‘personality’ an adaptation: a simple model. Animal Behaviour. 2006;72(5):1135–1139. [Google Scholar]
- Mitchell-Olds T, Willis JH, Goldstein DB. Which evolutionary processes influence natural genetic variation for phenotypic traits? Nat Rev Genet. 2007;8:845–856. doi: 10.1038/nrg2207. [DOI] [PubMed] [Google Scholar]
- Nettle D. The evolution of personality variation in humans and other animals. American Psychologist. 2006;61(6):622. doi: 10.1037/0003-066X.61.6.622. [DOI] [PubMed] [Google Scholar]
- Ozer DJ, Benet-Martinez V. Personality and the prediction of consequential outcomes. Annual Review of Psychology. 2006;57:401–421. doi: 10.1146/annurev.psych.57.102904.190127. [DOI] [PubMed] [Google Scholar]
- Penke L, Denissen JJA, Miller GF. The evolutionary genetics of personality. European Journal of Personality. 2007;21(5):549–587. [Google Scholar]
- Roberts BW, DelVecchio WF. The rank-order consistency of personality from childhood to old age: a quantitative review of longitudinal studies. Psychological Bulletin. 2000;126:3–25. doi: 10.1037/0033-2909.126.1.3. [DOI] [PubMed] [Google Scholar]
- Roberts BW, Kuncel NR, Shiner R, Caspi A, Goldberg LR. The power of personality: The comparative validity of personality traits, socioeconomic status, and cognitive ability for predicting important life outcomes. Perspectives on Psychological Science. 2007;2(4):313–345. doi: 10.1111/j.1745-6916.2007.00047.x. [DOI] [PMC free article] [PubMed] [Google Scholar]
- Roberts BW, Walton KE, Viechtbauer W. Patterns of mean-level change in personality traits across the life course: a meta-analysis of longitudinal studies. Psychological Bulletin. 2006;132(1):1. doi: 10.1037/0033-2909.132.1.1. [DOI] [PubMed] [Google Scholar]
- Schmitt D. The Big Five related to risky sexual behaviour across 10 world regions: Differential personality associations of sexual promiscuity and relationship infidelity. European Journal of Personality. 2004;18:301–319. [Google Scholar]
- Schmitt DP, Allik J, McCrae RR, Benet-Martínez V. The geographic distribution of Big Five personality traits patterns and profiles of human self-description across 56 nations. Journal of Cross-Cultural Psychology. 2007;38(2):173–212. [Google Scholar]
- Schmitt DP, Realo A, Voracek M, Allik J. Why can’t a man be more like a woman? Sex differences in Big Five personality traits across 55 cultures. Journal of Personality and Social Psychology. 2008;94(1):168–182. doi: 10.1037/0022-3514.94.1.168. [DOI] [PubMed] [Google Scholar]
- Sih A, Bell AM, Johnson JC, Ziemba RE. Behavioral syndromes: an integrative overview. The Quarterly Review of Biology. 2004;79(3):241–277. doi: 10.1086/422893. [DOI] [PubMed] [Google Scholar]
- Smith BR, Blumstein DT. Fitness consequences of personality: a meta-analysis. Behavioral Ecology. 2008;19(2):448–455. [Google Scholar]
- Specht J, Egloff B, Schmukle SC. Stability and change of personality across the life course: The impact of age and major life events on mean-level and rank-order stability of the Big Five. Journal of Personality and Social Psychology. 2011;101(4):862. doi: 10.1037/a0024950. [DOI] [PubMed] [Google Scholar]
- Stieglitz J, Blackwell A, Quispe Gutierrez R, Cortez Linares E, Kaplan H, Gurven M. Modernization, sexual risk-taking and gynecological morbidity among Bolivian forager-horticulturalists. PLoS ONE. 2012 doi: 10.1371/journal.pone.0050384. [DOI] [PMC free article] [PubMed] [Google Scholar]
- Verweij KJH, Yang J, Lahti J, Veijola J, Hintsanen M, Pulkki-Råback L, Widen E. Maintenace of genetic variation in human personality: testing evolutionary models by estimating heritability due to common causal variants and investigating the effect of distant inbreeding. Evolution. 2012:no–no. doi: 10.1111/j.1558-5646.2012.01679.x. [DOI] [PMC free article] [PubMed] [Google Scholar]
- von Rueden C, Gurven M, Kaplan H. The Multiple Dimensions of Male Social Status in an Amazonian Society. Evolution and Human Behavior. 2008;29:402–415. doi: 10.1016/j.evolhumbehav.2008.05.001. [DOI] [PMC free article] [PubMed] [Google Scholar]
- von Rueden C, Gurven M, Kaplan H. Why do men seek status? Fitness payoffs to dominance and prestige. Proceedings of the Royal Society B: Biological Sciences. 2011;278(1715):2223–2232. doi: 10.1098/rspb.2010.2145. [DOI] [PMC free article] [PubMed] [Google Scholar]
- Wilson DS. Adaptive genetic variation and human evolutionary psychology. Ethology and Sociobiology. 1994;15:219–235. [Google Scholar]
- Wolf M, Van Doorn GS, Leimar O, Weissing FJ. Life-history trade-offs favour the evolution of animal personalities. Nature. 2007;447(7144):581–584. doi: 10.1038/nature05835. [DOI] [PubMed] [Google Scholar]
Associated Data
This section collects any data citations, data availability statements, or supplementary materials included in this article.