
Figure 5.
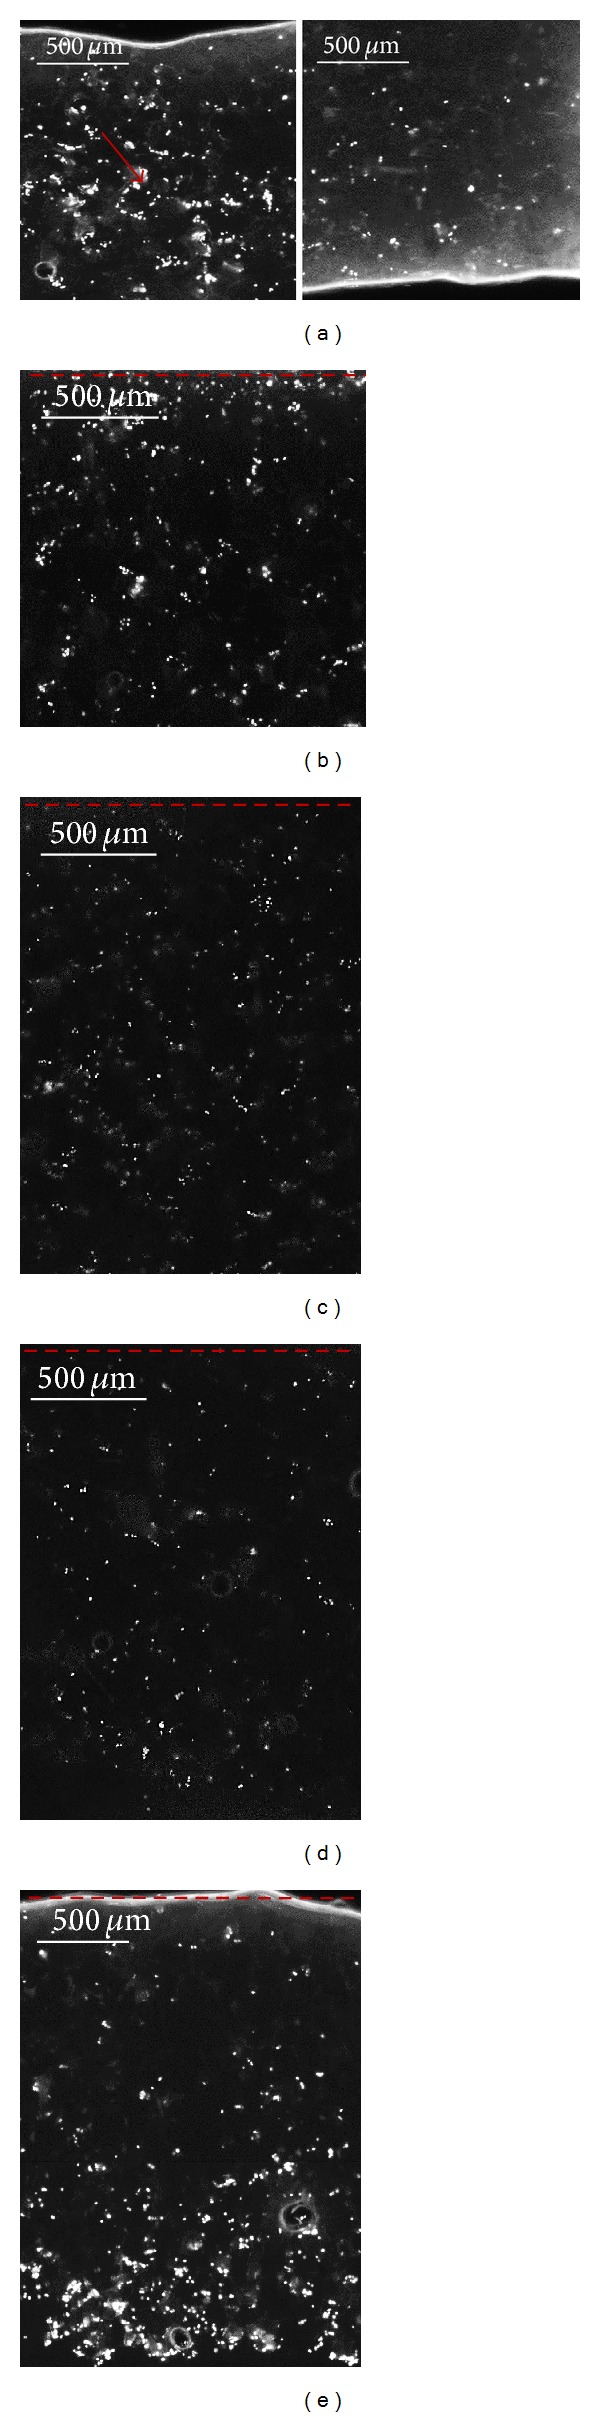
Representative fluorescence microscopy images of MC3T3-E1 cell nuclei stained with DAPI. Longitudinal sections of injection ((a) upper region on the left and lower region on the right), dropwise-seeded scaffolds (b) and perfusion-seeded scaffolds ((c) flow rate 0.03 mL/min, (d) flow rate 0.1 mL/min and (e) flow rate 0.3 mL/min). The red arrow indicates the injection area, and the red dashed lines represents the seeding surfaces.