

Abstract
We have estimated the prevalence of FMR1 premutation and gray zone CGG repeat expansions in a population-based sample of 19,996 male and female adults in Wisconsin and compared the observed sex ratios of the prevalence of FMR1 CGG premutation and gray zone expansions to theoretical sex ratios. The female premutation prevalence was 1 in 148 and comparable to past research, but the male premutation prevalence of 1 in 290 is somewhat higher than most previous estimates. The female:male premutation prevalence ratio is in line with the theoretically predicted sex ratio. The prevalence of CGG repeats in the gray zone (45–54 repeats) was 1 in 33 females and 1 in 62 males. The prevalence of the “expanded” gray zone (defined here as 41–54 CGG repeats) was 1 in 14 females and 1 in 22 males, leading to a female:male ratio of 1.62 (95% confidence interval 1.39–1.90). This female:male ratio was significantly lower than the expected ratio of 2.0. We examined results from three previously published FMR1 prevalence studies and found similar female:male ratios for CGG repeats in this “expanded” gray zone range (pooled female:male ratio across all four studies 1.66, 95% confidence interval 1.51–1.82). Further research is needed to understand the apparent excess prevalence of males with CGG repeats in this range.
Keywords: Fragile X, gray zone, premutation, FMR1
Introduction
Fragile X syndrome is the second-most common known genetic cause of intellectual disability (after Down syndrome) and the most common known inherited cause of intellectual disability. Fragile X syndrome is caused by the expansion of an unstable CGG trinucleotide sequence located in the 5′ untranslated region of the FMR1 gene (>200 CGG repeats, the “full mutation”). The vast majority of the population has FMR1 alleles with CGG repeats of 40 or less, and these normal-length CGG repeats are generally stable as they are inherited from parent to offspring. CGG repeats of length 55–200 are classified as the Fragile X “premutation.” Premutation-length CGG repeats are at increased risk for repeat-length expansion and instability when passed to offspring, and maternally inherited premutation alleles may expand into the full mutation (Fragile X syndrome) [Rousseau et al., 2011]. Compared to individuals with normal-length CGG repeats, premutation carriers appear to be at increased risk for a variety of health conditions including Fragile X Tremor and Ataxia Syndrome (FXTAS), Fragile X Primary Ovarian Insufficiency (FXPOI) in women, and psychiatric or cognitive problems [Hagerman and Hagerman, 2004; Bailey et al., 2008; Hall and Jacquemont, 2010; Cornish et al., 2011]. CGG repeat lengths of 45–54 are classified as “gray zone” by the American College of Medical Genetics [Maddalena et al., 2001], although other studies have used a variety of boundaries to define this “intermediate” category, including 41–54 CGG repeats or 41–60 CGG repeats [Nolin et al., 1996, 2003; Bretherick et al., 2005; Hall et al., 2011]. There is inconsistent evidence of an associated health-related phenotype for carriers of these gray zone or intermediate-length alleles [Bretherick et al., 2005; Loesch et al., 2007; Kronquistetal., 2008]; however, these alleles are at increased risk for CGG-repeat expansion and instability when passed to subsequent generations compared to shorter CGG repeats [Nolin et al., 1996, 2003; Sullivan et al., 2002].
Overall, there is a paucity of information about the population prevalence of CGG repeat expansions. In 2008, the National Institutes of Health Research Plan on Fragile X Syndrome and Associated Disorders [Eunice Kennedy Shriver National Institute of Child Health and Human Development, 2009] identified prevalence studies of FMR1 CGG expansions as an intermediate or long-term objective, and concluded that there were no unbiased estimates for premutation frequency in any large-scale population in the United States. Since this time, there have been several US-based studies reporting prevalence including one by our group [Seltzer et al., 2012]. However, some of the study samples were composed of women referred for prenatal screening or cystic fibrosis screening [Hantash et al., 2010], or specifically consented to newborn screening for FMR1 CGG expansions [Tassone et al., 2012]. These studies have also differed in terms of racial composition, and there is evidence that the prevalence of FMR1 CGG expansions varies by race or ethnicity [Hagerman, 2008].
Sex Ratios
Because FMR1 CGG expansions reside on the X chromosome, females should be approximately twice as likely as males to carry a premutation-length CGG expansion. Hagerman [2008] refined the estimated female:male ratio to 2.2:1 after incorporating the observation that the premutation-to-full mutation expansion occurs only in maternally inherited alleles (daughters of premutation fathers will always have the premutation—not the full mutation; this leads to a female:male premutation prevalence ratio slightly higher than 2:1). On occasion, Hagerman's mathematical model has been used to estimate male prevalence from an all-female study [Hantash et al., 2010].
In contrast to the theoretical sex ratio of 2.2:1, two of the three largest prevalence studies to include both men and women have reported female:male premutation prevalence ratios of 3.1:1 [Rousseau et al., 1995; Dombrowski et al., 2002; Seltzer et al., 2012]. Reasons for differences between the hypothesized and observed premutation prevalence sex ratios could include inadequate sample sizes, ascertainment bias, or sex differences in the transmission and expansion of FMR1 CGG repeats. A recent study of newborns in the United States [Tassone et al., 2012] observed a sex ratio of 2.05:1, and it was the first study to obtain an estimate this close to Hagerman's theoretical sex ratio.
There have also been attempts to pool premutation prevalence estimates across multiple studies. Song et al. [2003] pooled studies and estimated a premutation prevalence sex ratio of 4.1:1 (1 in 149 females and 1 in 649 males) and Beckett et al. [2005] included fewer studies and reported a 6.3:1 sex ratio (1 in 129 females and 1 in 809 males). The skewed sex ratios may be a consequence of pooling single-sex studies across populations with large differences in prevalence. For instance, an all-female study from Israel [Toledano-Alhadefet al., 2001] (with a reported premutation prevalence of 1 in 113) and an all-male study from Thailand [Tzeng et al., 2005] (with a reported prevalence of 1 in 1,674), if pooled, would lead to a female:male prevalence ratio of 14.8:1. Large studies that simultaneously measure men and women from the same population will be able to avoid bias or confounding due to regional/ethnic variation that occurs when multiple single-sex studies are pooled together.
Few studies have directly examined the sex ratio and prevalence of gray zone CGG expansions. Many studies of the premutation do not report gray zone findings, and some had low sensitivity for gray zone-length alleles. Presumably, the female:male gray zone prevalence ratio should be approximately 2:1 under the assumption that CGG alleles are independently inherited. In a previous study of older adults in Wisconsin [Seltzer et al., 2012], the gray zone (of 45– 54 CGG repeats) prevalence was 1 in 35 women and 1 in 42 men. This 1.2:1 female:male prevalence ratio is significantly lower than the expected 2:1 ratio. Similarly, the recent US newborn screening study [Tassone et al., 2012] reported a female:male gray zone prevalence ratio of 1.05:1 among white newborns—also much lower than the expected 2:1 ratio. The reason for the apparent excess male prevalence of gray zone-length alleles in these studies is unclear and was not a focal point of either study.
The purpose of this article is to report the prevalence of CGG expansions in a large and homogenous population-based sample of adults. A second objective is to compare observed sex ratios of the prevalence of FMR1 CGG premutation and gray zone expansions to the sex ratios predicted by theory.
Materials and Methods
Study Population
This study utilized the Marshfield Clinic Personalized Medicine Research Project (PMRP), which is an ongoing population cohort study with stored DNA, plasma, serum, and is linked to nearly comprehensive electronic medical records. Recruitment for PMRP began in 2002 and eligible participants were adults (18 years or older) that lived in 1 of 19zip codes near Marshfield, Wisconsin, representing approximately 40% of the eligible population. This area has relatively low in- and out-migration and its residents are served almost exclusively by the Marshfield Clinic. The PMRP participants are also racially homogenous with 98.4% of the PMRP participants self-reported to be White Caucasian. The participants reported whether their parents or children were also participating in PMRP, and we created pedigrees from these parent–offspring relationships.
At the time of the present study there were 20,109 participants in the PMRP and 19,996 had DNA samples available to us for measuring CGG repeats. The sample set included 11,527 women and 8,469 men. The participants were diverse in terms of age, with birth years ranging from pre-1922 to 1991, and approximately 7% of the participants were deceased by the year 2012. Additional details of the PMRP design and demographics have been published previously [McCarty et al., 2005].
Measurement of CGG Repeats
All 19,996 DNA samples of PMRP members were assayed for FMR1 CGG repeat length. The procedures used to measure CGG repeat length were based on those used in a recent population-based prevalence study [Seltzer et al., 2012]. DNA samples first underwent an FMR1 CGG repeat screening assay, in which the forward PCR primer is located upstream of the CGG repeat region, while the reverse PCR primer is within the CGG repeat region. This primer set generates multiple PCR amplicons with a length difference of three bases. The screening assay is extremely sensitive and identifies virtually all CGG repeats of 40 or more. When the screening assay detected CGG repeats of length 40 or longer, they were further evaluated for CGG repeat length using a FMR1 CGG repeat sizing assay. In the sizing assay, the number of CGG repeats was determined using a PCR-based protocol that includes gene-specific primers that flank the CGG repeat region of the FMR1 gene, sex-specific primers, a polymerase mixture, and a reaction buffer optimized for amplification of GC-rich DNA. The gene-specific primers provided the CGG length of all gray zone and pre/full mutation samples. The sex-specific primers detected the presence of X and Y chromosomes, enabling sex confirmation and identifies female samples with a single detectable CGG repeat (apparent homozygosity). All PCR reagents were developed and manufactured by the Celera Corporation.
Statistical Analysis
We calculated the prevalence of gray zone and premutation expansions in females and males, and the female:male prevalence ratio. Previous studies have defined the “gray zone” in a multiple ways; some use the American College of Medical Genetics' definition of 45–54 CGG repeats [Maddalena et al., 2001], while others consider the “gray zone” to include CGG repeats lengths of 41–54 [Berry-Kravis et al., 2007; Loesch et al., 2007; Hall et al., 2011; Seltzer et al., 2012]. In this article, we chose consistent terms to refer to different repeat-length ranges that are sometimes described as the “gray zone.” For comparability with other studies, we estimated the frequency of CGG expansions in the 45–54 range (gray zone) and also the 41–44 range (which we refer to as the “light gray zone”), and the entire 41–54 repeat range (the “expanded” gray zone).
Using the pedigree information, we observed that 8,488 PMRP members did not have any family members participating in PRMP, but that the others (n = 11,508) were part of “families” (either parent– child, both parents–child, etc.). These 11,508 PMRP members formed 2,911 multi-person families, leading to a total of 11,399 “family” groups in PMRP. Estimated allele frequencies and prevalences were based on a subsample of the subjects, selecting all “singletons” and a single random individual from each family. Confidence intervals for the female:male allele frequencies were derived by a bootstrap [Efron and Tibshirani, 1993]. For each iteration of the bootstrap, we selected 11,399 “families,” with replacement, and randomly selected a single person from each family, and then derived allele frequency estimates and female:male ratios from these data. We repeated this process 10,000 times. For each parameter of interest, the interval from the 2.5% quantile to the 97.5% quantile of the corresponding bootstrap estimates were taken as a 95% confidence interval.
The overall estimates of the prevalences and sex ratios were calculated as the mean of the 10,000 bootstrapped samples for each parameter. For this reason, we report female:male prevalence ratios that are slightly different from the ratio of the reported prevalence estimates.
Comparison of Gray Zone Prevalence Sex Ratios to Previous Findings
We searched the literature for all studies reporting gray zone prevalence information for both males and females. We extracted or calculated the gray zone sex ratios in each study, and confidence intervals were calculated according to the sampling designs and statistical approaches used in each study. To perform a simple meta-analysis of the overall sex ratios across studies, we used Rothman's EpiSheet [Rothman, 2011], which is based on the meta-analytic methods described by Fleiss [1993].
This study was approved by the Marshfield IRB. According to the IRB protocol, the results of CGG screening and sizing were not reported to participants, nor were they included in the medical record.
Results
A total of 19,996 samples were assayed for CGG repeat number. Five samples were removed: two samples produced inconclusive results, two samples were possible full mutation women (a mother and daughter) and require further confirmation, and one sample had an inconclusive result on the sex calling. Of the remaining 19,991, 98 people had a premutation allele (72 females and 26 males), 512 carried a gray zone allele (45–54 CGG repeats) and 705 carried a light gray zone allele (41–44 CGG repeats). The longest premutation-length CGG expansion from a female was 190 repeats and the longest from a male was 97 repeats. The sex-specific frequency and distribution of all CGG repeats of length 41 or longer is shown in Figure 1.
Fig. 1.
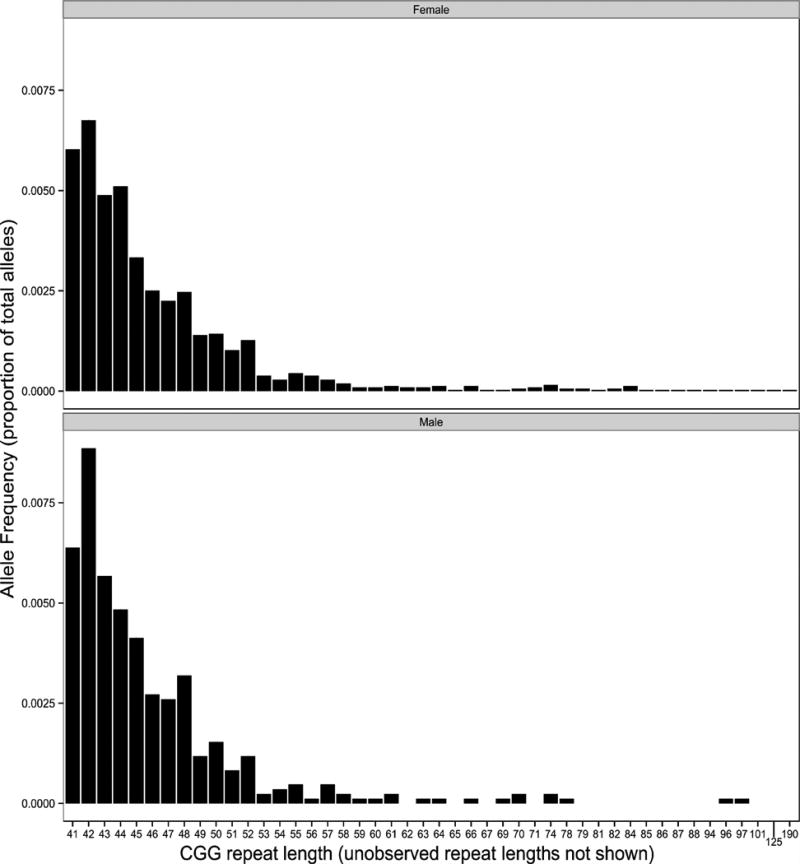
Frequency of specific CGG repeat lengths >40 for men and women.
Prevalence and Sex Ratios
The permutation prevalence was 1 in 148 women (95% CI: 1 in 207 to 1 in 113) and 1 in 290 men (95% CI: 1 in 530 to 1 in 194). These prevalence estimates and confidence intervals utilize the bootstrap procedure, and the prevalence estimates are very similar to the “crude” prevalence estimates. The female to male premutation prevalence ratio was 2.09 (95% CI: 1.15–3.75). The gray zone (45–54 repeats) prevalence was 1 in 33 females (95% CI:1 in 39 to 1 in 29) and 1 in 62 males (95% CI:1 in 78 to 1 in 50) and the female to male prevalence ratio was 1.87:1 (95% CI: 1.43–2.41). The prevalence of CGG repeats in the light gray zone (41–44) was 1 in 23 for females and 1 in 35 for males and the prevalence ratio was 1.50 (95% CI: 1.22–1.82). For the “expanded” gray zone (41–54 repeats), the prevalence was 1 in 14 females and 1 in 22 males resulting in a prevalence ratio of 1.62 (95% CI: 1.39–1.90; Table I).
Table I. Prevalence and Prevalence Sex Ratios of CGG Repeat Expansions of Different Lengths.
| Category | Female prevalence (95% CI) |
Male prevalence (95% CI) |
Female:male prevalence ratio (95% CI) |
|---|---|---|---|
| Light gray zone (41–44) | 1 in 23 (1 in 26 to 1 in 21) | 1 in 35 (1 in 41 to 1 in 30) | 1.50 (1.22–1.82) |
| Gray zone (45–54) | 1 in 33 (1 in 29 to 1 in 39) | 1 in 62 (1 in 78 to 1 in 50) | 1.87 (1.43–2.41) |
| Premutation (≥55) | 1 in 148 (1 in 113 to 1 in 207) | 1 in 290 (1 in 530 to 1 in 194) | 2.09 (1.15–3.75) |
Allele Frequencies and Sex Ratios
The sex-specific allele frequencies of the CGG repeat categories and the sex ratio for each category of CGG repeat lengths is displayed in Table II. The interpretation of the sex ratio for allele frequencies is analogous to the prevalence ratios; however, an allele frequency ratio of 1 would indicate no difference between males and females. The slight differences between the allele frequencies and the prevalences are due to the small number of women carrying two CGG repeat expansions (n = 16 women with both CGG repeats >40). The frequency of premutation-length allele frequencies was essentially the same in women and men (female:male ratio: 1.05, 95% CI: 0.58–1.87) and compatible with Hagerman's prediction. Light gray zone (41–44 repeat) expansions were significantly less common in women than men (female:male ratio: 0.77; 95% 0.63–0.93). Gray zone (45–54 repeats) were slightly less frequent in women than men, but the difference was not statistically significant (female:male ratio: 0.95, 95% CI: 0.72–1.22). As might be expected, given the dependency between the proportions of participants in the CGG repeat categories, normal-length alleles were slightly more common in women than men (sex ratio: 1.009, 95% CI: 1.001–1.016; Table II).
Table II. Allele Frequencies and Sex Ratios of CGG Repeat Expansions of Different Lengths.
| Category | Female allele frequency | Male allele frequency | Female:male ratio (95% CI) |
|---|---|---|---|
| Normal (≤40) | 0.959 (0.956–0.963) | 0.951 (0.945–0.957) | 1.01 (1.00–1.02) |
| Light gray zone (41–44) | 0.022 (0.020–0.025) | 0.029 (0.024–0.034) | 0.77 (0.63–0.93) |
| Gray zone (45–54) | 0.015 (0.013–0.017) | 0.016 (0.013–0.020) | 0.95 (0.72–1.22) |
| Premutation (≥55) | 0.0034 (0.0024–0.0044) | 0.0034 (0.0019–0.0052) | 1.05 (0.58–1.87) |
Comparison to Previous Studies and Meta-Analysis
We identified other prevalence studies that include gray zone or light gray zone repeats for both men and women. In all studies, the female:male prevalence ratio was less than 2.0 (Fig. 2). Two studies reported gray zone prevalence with female:male ratios more extreme than the present study; one study of older Wisconsin adults (almost entirely non-Hispanic white) reported a female:male ratio of 1.2, and the newborn screening study observed a female:male ratio of 1.71 for all newborns, and a ratio of 1.05 among white newborns. After pooling the three studies, the overall female:male prevalence ratio was 1.61 (95% CI: 1.36–1.90). When only the white children in the newborn screening study were pooled with the other two studies, overall female:male prevalence ratio was 1.47 (95% CI: 1.23–1.77). We also pooled sex ratios for the “expanded” gray zone (41–54 repeats; 40–54 repeats in the newborn screening study) and observed an overall female:male ratio of 1.68 (95% CI: 1.52–1.86). Another prevalence study was conducted among children in special education in Atlanta, GA and it reported the prevalence of CGG repeats between 41 and 60 repeats. If the Atlanta study was pooled with the others, the overall female:male ratio would be 1.66:1 (95% CI: 1.51:1 to 1.82:1).
Fig. 2.
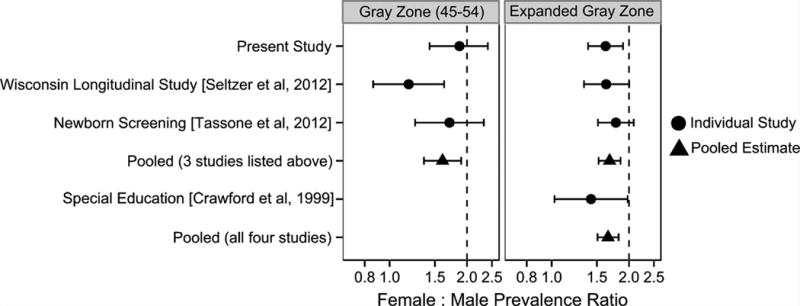
Gray zone prevalence female:male ratios; present study compared to previous findings. Error bars represent 95% confidence intervals. Note that the “Expanded Gray Zone” refers to 41–54 CGG repeats in present study and Seltzer et al. [2012]; 40–54 CGG repeats in Tassone et al. [2012]; and 40–60 CGG repeats in Crawford et al. [1999].
Discussion
To our knowledge, this is the second-largest population-based study in the world literature to measure FMR1 CGG expansions in both men and women. The premutation prevalence we observed (1 in 148 females and 1 in 290 males), along with two other recent studies [Seltzer et al., 2012; Tassone et al., 2012], provide converging evidence that the prevalence of the premutation is higher in white females and males in the United States than what was reported in a pair of frequently cited French Canadian studies (1 in 259 females; 1 in 813 males) [Rousseau et al., 1995; Dombrowski et al., 2002]. The female:male prevalence ratio (2.09) was also very close to the expected ratio predicted by Hagerman's model. Applying our estimated premutation prevalence to the entire non-Hispanic white population in the United States (197 million people, 63% of total US population) [United States Census Bureau, 2011] would suggest approximately 1,006,000 premutation carriers (666,000 females and 340,000 males). This estimate is comparable to another study that projected 584,000 white female carriers from women referred for carrier screening for cystic fibrosis or other diseases [Hantash et al., 2010]. Thus, the total number of male and female premutation carriers in the United States (2011 population: 311 million) is likely well over one million people.
While the sex ratio of the premutation prevalence was near its predicted value, the female:male prevalence ratio for shorter repeats (41–54 CGG repeats) was significantly less than the expected 2:1 prevalence ratio. This finding was consistent with the prevalence ratios calculated from data reported in three previous studies. It is unclear whether the excess male prevalence differs by race; the two Wisconsin-based studies (Seltzer et al. [2012] and the present study) are predominantly composed of non-Hispanic white adults. In the newborn screening study [Tassone et al., 2012], the difference in the female:male gray zone prevalence sex ratio was most extreme in white newborns, but not significantly different than 2.0 in Hispanic or Black newborns. A study of children in special education in Atlanta reported a female:male ratio for African Americans (1.06:1) that was somewhat more extreme than for white children (1.46:1) although the sample size was small in the African American group.
There are several potential explanations that could account for the relative excess of males with light gray or gray zone CGG repeats: (1) aspects of the gray zone phenotype affect participation in the studies; (2) sex differences in transmission or expansion of gray zone or intermediate-length CGG repeats; (3) sex differences in pre- or post-fertilization loss, and (4) other un-identified sources of bias, or a false-positive finding due to chance. In order to be plausible, any explanation offered must address not only the male excess but also why it is greatest in the gray zone or light gray zone and is not observed in permutation carriers. While the occurrence of Fragile X Tremor and Ataxia Syndrome (FXTAS) in males with the premutation, but not in those with the full mutation [Brouwer et al., 2009], is usually attributed to toxic effects of abnormal protein produced only by premutation alleles, no comparable biologic mechanism has been proposed to explain differences between gray zone and premutation alleles.
An associated phenotype affecting study participation could account for the excess prevalence of gray zone or intermediate-length alleles among males. While several reports of individuals with CGG repeats between 39 and 54 experiencing FXTAS or Fragile X Primary Ovarian Insufficiency (FXPOI) symptoms [Bretherick et al., 2005; Hall et al., 2012] have contributed to uncertainty regarding the CGG repeat length threshold at which individuals are susceptible to symptoms usually associated with the premutation, no symptoms specific to the gray or intermediate zone have been proposed. Furthermore, males are more likely to be affected by symptoms of Fragile X including FXTAS (which may reduce participation in studies of adults); a behavioral phenotype in males would result in deficiency rather than excess of males participating in studies. Additionally, the onset of FXTAS and FXPOI symptoms are in adulthood, and would not affect the participation of infants in the newborn screening [Tassone et al., 2012] or children in special education [Crawford et al., 1999] studies. While it is theoretically possible that male gray zone (but not premutation) carriers have a unique phenotype that affects study participation, there is currently no evidence to support this hypothesis.
Fragile X is known to influence fertility differently according to sex, with full mutation males and premutation females experiencing reproductive problems [Johannisson et al., 1987]. In order for differences in fertility to explain an excess of males with gray zone alleles, but not premutations, it is necessary to postulate that among individuals with gray zone alleles, females have increased fertility relative to males. There is currently no evidence for increased fertility in gray zone females and in fact there might be a slight decrease if some experience premature menopause. Recent mouse-model studies have similarly shown a pattern of reproductive problems in premutation females [Hoffman et al., 2012; Lu et al., 2012], and report a reduction of the number of follicles grown, or a faster loss of follicles, in the ovaries. In an exploratory analysis of the PMRP data, we observed that males with offspring who also participated in PMRP had a lower prevalence of light gray zone alleles than males without offspring in PMRP (allele frequency of 1.8% vs. 2.8%, chi-square P-value 0.014), but further investigation is needed to determine whether this may indicate a difference in actual number of offspring (as opposed to merely a difference in having offspring participate in PMRP). This observation deserves additional study because decreased fertility in gray zone males would result in fewer gray zone females in the next generation.
Differences in allele stability and transmission based on sex and repeat length clearly do affect the sex ratio for the premutation, resulting in the theorized ratio of slightly over 2:1. Previous studies have reported sex differences in the expansion of premutation and full-mutation alleles and have proposed different mechanisms for different CGG repeat lengths. The expansion from premutation to full mutation happens only for maternally transmitted CGG repeats [Rousseau et al., 2011], but paternally transmitted alleles of 40–59 CGG repeats may be more unstable than maternally inherited alleles of this length [Sullivan et al., 2002]. Contraction of paternally inherited alleles, causing gray zone men to father daughters with normal repeat lengths, could bring about a disproportionately higher prevalence of males with gray zone or intermediate-length repeats without a concomitant increase in female premutation prevalence, but in subsequent generations this effect would become less pronounced due to the shortage of gray zone females leading to fewer gray zone male offspring. There are also inconsistent findings concerning a differential risk of inheriting maternal CGG expansions, depending on the sex of offspring [Loesch et al., 1995; Nolin et al., 1996; Ashley-Koch et al., 1998]. If confirmed, differential transmission of repeat numbers, with gray zone females producing more gray zone males or fewer gray zone females than expected, could potentially explain the observed excess of gray zone males.
A third potential explanation is sex differences in pre- or post-fertilization loss, with greater loss among female gametes, embryos, or fetuses. While there has been sufficient study of premutation carriers to exclude the possibility of major increases in miscarriage or in skewing of the sex ratio of their offspring, comparable data do not exist for the gray zone. If, for example, sperm carrying a gray zone allele have a decreased probability of fertilizing the egg, this could result in a shortage of gray zone females. There is, however, no data available to support or refute this mechanism.
A final potential explanation for the findings is an unidentified source of bias. The studies showing the skewed female:male expanded gray zone prevalence ratios varied in terms of study design and age of participants. The (present) PMRP sample was recruited by the sole health care provider in a largely rural area and enrolled a substantial proportion (40% thus far) of the eligible adult population; the Wisconsin Longitudinal Study is comprised of older adults who continued to participate in an ongoing survey since they were in high school [Seltzer et al., 2012]; the newborn screening study was a multi-site study in which parents consented to newborn Fragile X screening [Tassone et al., 2012]; and the study in Atlanta was comprised entirely of children in special education [Crawford et al., 1999]. The CGG repeat assays could affect the female:male ratios if there was preferential amplification for the shorter allele among females (such as amplification of the smaller allele at the expense of the larger); however, each study used different methods for ascertaining CGG repeats. All of these studies have potential biases, but not necessarily the same ones. We were unable to identify a type of bias that could be applied to each of the study designs and sampling frames. Replication in additional populations could help confirm the presence and magnitude of this effect, as well as the range of CGG repeat lengths that seem to be more common among males.
This study is not without limitations. There are numerous relatives within the PMRP sample, requiring statistical approaches to calculate appropriate standard errors and confidence intervals. It is unlikely that we had information describing all inter-related individuals. However, we were able to construct pedigrees spanning up to four generations and including first cousin relationships. The PMRP sample likely includes a small but unknown number of participants who were also included in the previous prevalence study [Seltzer et al., 2012] using a different Wisconsin-based sample (the Wisconsin Longitudinal Study). Considering the birth years of the participants in the Wisconsin Longitudinal Study and its sampling strategy, we would anticipate that the proportion of PMRP participants in both studies is under 1%.
Specific CGG repeat length information was limited to alleles with repeats >40, as only those individuals with a CGG repeat length >40 were sized exactly. Therefore, we are unable to examine sex-differences in among shorter CGG repeats. Additionally, it is conceivable that the sample includes women with premutation–full mutation mosaicism, and only the premutation was detected by the sizing assay. Because the full mutation is much less prevalent than the premutation, this would minimally effect the prevalence estimates and female:male prevalence ratios.
This study also has a number of strengths, including the utilization of a well-defined population-based sample. Because of known differences in the absolute frequencies of expanded CGG repeats across different racial or ethnic groups, the racially homogenous PMRP sample is advantageous for this prevalence study. Additionally, very few participants were likely to be aware of their CGG repeat status. The observed premutation prevalence sex ratio (of 2.09:1) was in line with Hagerman [2008] prediction and suggests that there was not differential participation of premutation carriers by sex.
Conclusion
This population-based study of adults of European descent provides further evidence that the frequency of expansions of the FMR1 gene is higher in this group than in many other racial or ethnic groups. Additional studies are needed to confirm and understand the apparent excess prevalence of males with CGG repeats in the gray zone or expanded gray zone range.
Acknowledgments
This research was supported by the Centers for Disease Control and Prevention through the Association of University Centers on Disability (M.R. Mailick, PI), Waisman Center IDDRC Core Grant; Grant number: P30 HD03352, and T32 HD007489-04) the National Institute of Child Health and Human Development at the National Institutes of Health. The project described was also partially supported by the Clinical and Translational Science Award (CTSA) program, through the NIH National Center for Advancing Translational Sciences (NCATS), grant UL1TR000427 and an NIH grant under the eMERGE network: U01HG004608 to Marshfield Clinic and U01HG006389 to Essentia Institute of Rural Health. The content is solely the responsibility of the authors and does not necessarily represent the official views of the NIH.
Grant sponsor: Centers for Disease Control and Prevention; Grant number: P30 HD03352, T32 HD007489-04; Grant sponsor: National Institute of Child Health and Human Development; Grant sponsor: Clinical and Translational Science Award (CTSA) Program; Grant sponsor: NIH National Center for Advancing Translational Sciences (NCATS); Grant number: UL1TR000427, U01HG004608, U01HG006389.
References
- Ashley-Koch AE, Robinson H, Glicksman AE, Nolin SL, Schwartz CE, Brown WT, Turner G, Sherman SL. Examination of factors associated with instability of the FMR1 CGG repeat. Am J Hum Genet. 1998;63:776–785. doi: 10.1086/302018. [DOI] [PMC free article] [PubMed] [Google Scholar]
- Bailey DB, Raspa M, Olmsted M, Holiday DB. Co-occurring conditions associated with FMR1 gene variations: Findings from a National Parent Survey. Am J Med Genet Part A. 2008;146A(16):2060–2069. doi: 10.1002/ajmg.a.32439. [DOI] [PubMed] [Google Scholar]
- Beckett L, Yu Q, Long AN. The numbers behind fragile X: Prevalence and economic impact. The National Fragile X Foundation Quarterly. 2005;21:18–21. [Google Scholar]
- Berry-Kravis E, Goetz CG, Leehey MA, Hagerman RJ, Zhang L, Li L, Nguyen D, Hall DA, Tartaglia N, Cogswell J, Tassone F, Hagerman PJ. Neuropathic features in fragile X premutation carriers. Am J Med Genet Part A. 2007;143A:19–26. doi: 10.1002/ajmg.a.31559. [DOI] [PubMed] [Google Scholar]
- Bretherick KL, Fluker MR, Robinson WP. FMR1 repeat sizes in the gray zone and high end of the normal range are associated with premature ovarian failure. Hum Genet. 2005;117(4):376–382. doi: 10.1007/s00439-005-1326-8. [DOI] [PubMed] [Google Scholar]
- Brouwer JR, Willemsen R, Oostra BA. The FMR1 gene and fragile X-associated tremor/ataxia syndrome. Am J Med Genet Part B. 2009;150B:782–798. doi: 10.1002/ajmg.b.30910. [DOI] [PMC free article] [PubMed] [Google Scholar]
- Crawford DC, Meadows KL, Newman JL, Taft LF, Pettay DL, Gold LB, Hersey SJ, Hinkle EF, Stanfield ML, Holmgreen P. Prevalence and phenotype consequence of FRAXA and FRAXE alleles in a large, ethnically diverse, special education-needs population. Am J Hum Genet. 1999;64:495–507. doi: 10.1086/302260. [DOI] [PMC free article] [PubMed] [Google Scholar]
- Cornish KM, Hocking DR, Moss SA, Kogan CS. Selective executive markers of at-risk profiles associated with the fragile X premutation. Neurology. 2011;77(7):618–622. doi: 10.1212/WNL.0b013e3182299e59. [DOI] [PMC free article] [PubMed] [Google Scholar]
- Dombrowski C, Levesque S, Morel M, Rouillard P, Morgan K, Rousseau F. Premutation and intermediate-size FMR1 alleles in 10 572 males from the general population: Loss of an AGG interruption is a late event in the generation of fragile X syndrome alleles. Hum Mol Genet. 2002;11:371. doi: 10.1093/hmg/11.4.371. [DOI] [PubMed] [Google Scholar]
- Efron B, Tibshirani RJ. An introduction to the bootstrap. New York: Chapman & Hall/CRC; 1993. [Google Scholar]
- Eunice Kennedy Shriver National Institute of Child Health and Human Development, NIH, DHHS. NIH research plan on fragile X syndrome and associated disorders (NA) Washington, DC: U.S. Government Printing Office; 2009. [Google Scholar]
- Fleiss JL. The statistical basis of meta-analysis. Stat Methods Med Res. 1993;2:121–145. doi: 10.1177/096228029300200202. [DOI] [PubMed] [Google Scholar]
- Hagerman PJ. The fragile X prevalence paradox. J Med Genet. 2008;45:498. doi: 10.1136/jmg.2008.059055. [DOI] [PMC free article] [PubMed] [Google Scholar]
- Hagerman PJ, Hagerman RJ. The fragile-X premutation: A maturing perspective. Am J Hum Genet. 2004;74:805–816. doi: 10.1086/386296. [DOI] [PMC free article] [PubMed] [Google Scholar]
- Hall DA, Jacquemont S. The epidemiology of FXTAS. In: Tassone F, Berry-Kravis EM, editors. The fragile X-associated tremor ataxia syndrome (FXTAS) New York, NY: Springer New York; 2010. pp. 17–30. [Google Scholar]
- Hall DA, Berry-Kravis E, Zhang W, Tassone F, Spector E, Zerbe G, Hagerman PJ, Ouyang B, Leehey MA. FMR1 gray-zone alleles: Association with Parkinson's disease in women? Mov Disord. 2011;26(10):1900–1906. doi: 10.1002/mds.23755. [DOI] [PMC free article] [PubMed] [Google Scholar]
- Hall D, Tassone F, Klepitskaya O, Leehey M. Fragile X-associated tremor ataxia syndrome in FMR1 gray zone allele carriers. Mov Disord. 2012;27:297–301. doi: 10.1002/mds.24021. [DOI] [PMC free article] [PubMed] [Google Scholar]
- Hantash FM, Goos DM, Crossley B, Anderson B, Zhang K, Sun W, Strom CM. FMR1 premutation carrier frequency in patients undergoing routine population-based carrier screening: Insights into the prevalence of fragile X syndrome, fragile X-associated tremor/ataxia syndrome, and fragile X-associated primary ovarian insufficiency in the United States. Genet Med. 2010;13:39–45. doi: 10.1097/GIM.0b013e3181fa9fad. [DOI] [PubMed] [Google Scholar]
- Hoffman GE, Le WW, Entezam A, Otsuka N, Tong ZB, Nelson L, Flaws JA, McDonald JH, Jafar S, Usdin K. Ovarian abnormalities in a mouse model of fragile X primary ovarian insufficiency. J Histochem Cytochem. 2012;60:439–456. doi: 10.1369/0022155412441002. [DOI] [PMC free article] [PubMed] [Google Scholar]
- Johannisson R, Rehder H, Wendt V, Schwinger E. Spermatogenesis in two patients with the fragile X syndrome. Hum Genet. 1987;76:141–147. doi: 10.1007/BF00284911. [DOI] [PubMed] [Google Scholar]
- Kronquist KE, Sherman SL, Spector EB. Clinical significance of tri-nucleotide repeats in fragile X testing: A clarification of American College of Medical Genetics guidelines. Genet Med. 2008;10:845–847. doi: 10.1097/GIM.0b013e31818b0c8a. [DOI] [PMC free article] [PubMed] [Google Scholar]
- Loesch DZ, Huggins R, Petrovic V, Slater H. Expansion of the CGG repeat in fragile X in the FMR1 gene depends on the sex of the offspring. Am J Hum Genet. 1995;57:1408. [PMC free article] [PubMed] [Google Scholar]
- Loesch DZ, Bui QM, Huggins RM, Mitchell RJ, Hgerman RJ, Tassone F. Transcript levels of the intermediate size or grey zone fragile X mental retardation 1 alleles are raised, and correlate with the number of CGG repeats. J Med Genet. 2007;44:200–204. doi: 10.1136/jmg.2006.043950. [DOI] [PMC free article] [PubMed] [Google Scholar]
- Lu C, Lin L, Tan H, Wu H, Sherman SL, Gao F, Jin P, Chen D. Fragile X premutation RNA is sufficient to cause primary ovarian insufficiency in mice. Hum Mol Genet. 2012;21:5039–5047. doi: 10.1093/hmg/dds348. [DOI] [PMC free article] [PubMed] [Google Scholar]
- Maddalena A, Richards CS, McGinniss MJ, Brothman A, Desnick RJ, Grier RE, Hirsch B, Jacky P, McDowell GA, Popovich B. Technical standards and guidelines for fragile X: The first of a series of disease-specific supplements to the standards and guidelines for Clinical Genetics Laboratories of the American College of Medical Genetics. Genet Med. 2001;3:200–205. doi: 10.1097/00125817-200105000-00010. [DOI] [PMC free article] [PubMed] [Google Scholar]
- McCarty CA, Wilke RA, Giampietro PF, Wesbrook SD, Caldwell MD. Marshfield Clinic Personalized Medicine Research Project (PMRP): Design, methods and recruitment for a large population-based biobank. Personalized Med. 2005;2:49–79. doi: 10.1517/17410541.2.1.49. [DOI] [PubMed] [Google Scholar]
- Nolin SL, Brown WT, Glicksman A, Houck GE, Jr, Gargano AD, Sullivan A, Biancalana V, Bröndum-Nielsen K, Hjalgrim H, Holinski-Feder E. Expansion of the fragile X CGG repeat in females with premutation or intermediate alleles. Am J Hum Genet. 2003;72:454–464. doi: 10.1086/367713. [DOI] [PMC free article] [PubMed] [Google Scholar]
- Nolin SL, Lewis FA, Ye LL, Houck GE, Jr, Glicksman AE, Limprasert P, Li SY, Zhong N, Ashley AE, Feingold E, Sherman SL, Brown WT. Familial transmission of the FMR1 CGG repeat. Am J Hum Genet. 1996;59:1252. [PMC free article] [PubMed] [Google Scholar]
- Rothman KJ. Episheet Online Tool. [accessed 13 Dec 2012];2011 Available: http://krothman.hostbyet2.com/
- Rousseau F, Rouillard P, Morel ML, Khandjian EW, Morgan K. Prevalence of carriers of premutation-size alleles of the ***FMRI gene– and implications for the population genetics of the fragile X syndrome. Am J Hum Genet. 1995;57:1006. [PMC free article] [PubMed] [Google Scholar]
- Rousseau F, Labelle Y, Bussières J, Lindsay C. The fragile X mental retardation syndrome 20 years after the FMR1 gene discovery: An expanding universe of knowledge. Clin Biochem Rev. 2011;32:135. [PMC free article] [PubMed] [Google Scholar]
- Seltzer MM, Baker MW, Hong J, Maenner M, Greenberg J, Mandel D. Prevalence of CGG expansions of the FMR1 gene in a US population-based sample. Am J Med Genet Part B. 2012;159B:589–597. doi: 10.1002/ajmg.b.32065. [DOI] [PMC free article] [PubMed] [Google Scholar]
- Song FJ, Barton P, Sleightholme V, Yao GL, Fry-Smith A. Screening for fragile X syndrome: A literature review and modelling study. Health Technol Assess. 2003;7(16):1–106. doi: 10.3310/hta7160. [DOI] [PubMed] [Google Scholar]
- Sullivan AK, Crawford DC, Scott EH, Leslie ML, Sherman SL. Paternally transmitted FMR1 alleles are less stable than maternally transmitted alleles in the common and intermediate size range. Am J Hum Genet. 2002;70:1532–1544. doi: 10.1086/340846. [DOI] [PMC free article] [PubMed] [Google Scholar]
- Tassone F, Iong KP, Tong TH, Lo J, Gane LW, Berry-Kravis E, Nguyen D, Mu LY, Laffin J, Bailey DB, Hagerman RJ. FMR1 CGG allele size and prevalence ascertained through newborn screening in the United States. Genome Med. 2012;4(12):100. doi: 10.1186/gm401. [DOI] [PMC free article] [PubMed] [Google Scholar]
- Toledano-Alhadef H, Basel-Vanagaite L, Magal N, Davidov B, Ehrlich S, Drasinover V, Taub E, Halpern GJ, Ginott N, Shohat M. Fragile-X carrier screening and the prevalence of premutation and full-mutation carriers in Israel. Am J Hum Genet. 2001;69:351–360. doi: 10.1086/321974. [DOI] [PMC free article] [PubMed] [Google Scholar]
- Tzeng CC, Tsai LP, Hwu WL, Lin SJ, Chao MC, Jong YJ, Chu SY, Chao WC, Lu CL. Prevalence of the FMR1 mutation in Taiwan assessed by large-scale screening of newborn boys and analysis of DXS548-FRAXAC1 haplotype. Am J Med Genet Part A. 2005;133A:37–43. doi: 10.1002/ajmg.a.30528. [DOI] [PubMed] [Google Scholar]
- United States Census Bureau. American Community Survey. [Accessed Jan 28, 2013];2011 Available at: http://factfinder2.census.gov/faces/tableservices/jsf/pages/productview.xhtml?pid=ACS_11_1YR_B01001H&prodType=table.