Abstract
A facile method for quantifying the concentration of the powerful and widely available hallucinogen salvinorin A (a selective kappa opioid agonist) from non-human primate cerebrospinal fluid (CSF) and human plasma has been developed using liquid chromatography-tandem mass spectrometry (LC-MS/MS) in positive electrospray ionization (ESI) mode. With CSF solid phase extraction can be avoided completely by simply diluting each sample to 10 % (v/v) acetonitrile, 1 % (v/v) formic acid and injecting under high aqueous conditions for analyte focusing. Extensive plasma sample preparation was investigated including protein precipitation, SPE column selection, and plasma particulate removal. Human plasma samples were centrifuged at 21,000 × gravity for 4 minutes to obtain clear particulate-free plasma, from which 300 μl was spiked with internal standard and loaded onto a C18 SPE column with a 100 mg mL−1 loading capacity. Guard columns (C18, hand packed 1 mm × 20 mm) were exchanged after backpressure increased above 4600psi, about 250 injections. A shallow acetonitrile/water gradient was used, 29 to 33% CH3CN over 8 minutes to elute salvinorin A. Reduction of chemical noise was achieved using tandem mass spectrometry with multiple reaction monitoring while sensitivity increases were observed using a 50 μL injection volume onto a small bore analytical column (C18, 1 mm ID × 50 mm) thus increasing peak concentration. Limits of quantification were found to be 0.0125 ng mL−1 (CSF) and 0.05 ng mL−1 (plasma) with interday precision and accuracy below 1.7 % and 9.42 % (CSF) and 3.47 % and 12.37 % (plasma) respectively. This method was used to determine the concentration of salvinorin A from an in vivo Rhesus monkey study and a trial of healthy human research participants, using behaviorally active doses.
1 Introduction
The hallucinogenic mint (Lamiaceae family) plant Salvia divinorum, has been used for centuries by the indigenous people of Oaxaca, Mexico1–3. Mazatec shamans have used S. divinoum for its hallucinogenic properties in divination ceremonies as well as ethnomedical practices. Salvinorin A1, the active component of S. divinorum, is a nonnitrogenous neoclerodane diterpene which is a selective and highly efficacious κ-opioid agonist hallucinogen4, 5. Unlike classic hallucinogens such as psilocybin, mescaline and LSD, salvinorin A effects are not meditated through the 5-HT2A serotonin receptor4–7. When the leaves of S. divinorum are smoked, or isolated salvinorin A is vaporized, resulting in a fast onset and often very strong psychoactive effects, which decline rapidly over 20 – 30 minutes2, 3, 8. The smoking of S. divinorum leaves and their extracts has become popular within certain cultures around the world. In the US S divinorum leaves and extracts are easily accessible through internet sales and local “head shops”. Since the mid-1990s the use and availability of S. divinorum has increased2, 3, 9, although use appears to have recently stabilized at non-trivial levels, with lifetime use among teens remaining approximately stable at nearly 6% for the last 3 years (2009–2011)10. With prevalent salvinorin A use and yearly increases in salvinorin A regulation throughout the US and worldwide11 the investigation of its pharmacokinetic profile has become an area of interest in clinical and translational settings8, 12. Recent studies have investigated the in vivo pharmacokinetic parameters of salvinorin A using mice13, non-human primates12, 14, 15, and humans8 however these studies have been limited by either the biological fluid tested or method sensitivity to quantify salvinorin A. Like many CNS active agents, profiling pharmacokinetic parameters involves sampling of the blood plasma or (when available) cerebrospinal fluid to quantify how much agent is in circulation, or present in central tissues, respectively (with the caveat that CSF levels are not identical to CNS tissue levels16). Repeated assessment over time permits quantification of an agent, either in CSF or plasma levels and allows for comparison to the time course of behavioral effects16. While a method has been developed for the quantification of salvinorin A in plasma17, 18, it only presents results from salvinorin A spiked into pooled plasma. In our hands, we found a marked difference between plasma samples obtained from individual participants and plasma that has been pooled and processed by commercial vendors. The individual donor samples required a robust plasma work up to quantitate salvinorin A and note individual donor samples are probably more challenging than pooled. Herein we describe a method for the detection of salvinorin A from CSF that is both sensitive and requires modest sample preparation as well as observations for the successful processing of individual donor human plasma samples.
2 Experimental
2.1 Experimental Subjects
Experimental studies in non-human primates were approved by the Rockefeller University Animal Care and Use Committee16. Experimental studies in humans were approved by the Institutional Review Board of the Johns Hopkins University School of Medicine. Human participants gave their informed consent before participation in trials.
2.2 Chemicals and solutions
Salvinorin A was extracted from the dried leaves of S. divinorum according to previously described methods19, 20. All solvents used were of HPLC quality and were purchased from Sigma-Aldrich chemical company. Deuterium labeled salvinorin A, (3) was prepared from salvinorin A as previously described20. Preparation of internal standard, (4), was performed according to recent semisynthetic procedures developed starting from salvinorin A21. All stock solutions were prepared at a concentration of 1.0 mg mL−1 in acetonitrile and stored at 2 °C. All stock solutions were remade after a two week period to prevent changes in concentration or degradation of the analyte. SPE column washing solution contained 10 % methanol and 90 % Millipore H2O (v/v). SPE column elution solution contained 25 % acetonitrile and 75 % dichloromethane (v/v). Reconstitution solution contained 35 % acetonitrile, 64 % Millipore H2O, and 1 % formic acid (v/v/v).
2.3 Synthesis of plasma internal standard
Internal standard 5 was prepared by first converting salvinorin A to salvinorin B (via previously described methods20), which was then purified by flash column chromatography (0.5 % MeOH/99.5 % DCM). Prior experience with ‘proton’ contamination dictated a method in which all possible sources of protons were exchanged prior to derivatization and workup. A 10 mL round bottom flask was then washed with D2O/soap and rinsed with D2O before being placed in an oven to dry. Once dry the flask was quickly capped and injected with 5.0ml of CDCl3, without letting the glass cool, then flushed with argon until cool. Once cooled pure salvinorin B (50 mg, 0.128 mmol) and 4-(dimethylamino)pyridine (6 mg, 0.05 mmol) were added to the flask, which was again flushed with argon. Once dissolved, to the solution was added acetic anhydride – 13C4, d6 99 % 13C, 97 % D (55 μL, 0.64 mmol) and allowed to stir at room temperature. Although the reaction appeared to be finished by TLC after only 3 hours it was allowed to stir for 7 hours to assure the reaction had reached complete conversion to the labeled analogue 5. MeOD (2 mL) was then added to the reaction flask and the solution concentrated under reduced pressure. CDCl3 (6 mL) was added to the remaining residue before washing with DCl (35 wt. %) in D2O (4 × 4mL). The remaining organic layer was then concentrated under reduced pressure to afford a white solid (52.8 mg, 0.122 mmol) in 95.3% yield, which was used without further purification. Upon analysis by HPLC the sample was determined to be at least 97.44% pure with no traces of salvinorin B in the chromatogram. Analysis by LC/MS/MS the isotopic purity of 5 to 1 was determined to be >99.99%.
2.4 Preparation of plasma blanks
Calibration standards were made by serial diluting stock solutions of 1 and 5 which were added to pooled human plasma containing acid-citrate-dextrose (ACD) as an anticoagulant. Citric acid, sodium citrate, and dextrose function similar to ethylenediaminetetraacetic acid (EDTA) by chelating Ca2+ ions to block proper function of the coagulation cascade making the addition of other anticoagulants unnecessary. Specifically, to a 1.5 mL microcentrifuge tube was added 350 μL of plasma, 100 μL of 5 from a 10 ng mL−1 solution, and 100 μL from an individual dilution of 1. Samples were then briefly vortexed before submitting to solid phase extraction. Final standards consisted of 350 μL samples in reconstitution solution containing (1a) at 0.25, 1.0, 5.0, 10, 50 ng mL−1, and 1b at 2.86 ng mL−1.
2.5 Cerebrospinal fluid blanks
Calibration standards were made by serial diluting stock solutions of 1 and 4 which was added to sufficient artificial cerebrospinal fluid (ACSF). ACSF consisted of a 126 mM NaCl, 2.5 mM KCl, 20 mM HEPES, 1.2 mM NaH2PO4, 25 mM NaHCO3, 2.4 mM CaCl2, and 1.2 mM MgCl solution at pH 7.4.22–24 Final standards consisted of 1.0 mL samples in ACSF containing (1) at 0.125, 0.25, 1.0, 5.0, 10, 50 ng mL−1, internal standard (4) at 2.86 ng mL−1, 10 % (v/v) acetonitrile, and 1.0 % formic acid (v/v).
2.6 Preparation of human plasma samples
Seven participants inhaled vaporized doses of salvinorin A of either 18.0 (2 participant) or 21 μg kg−1 (5 participants). For each participant 12 blood samples were collected up to 90 minutes post inhalation. Samples were centrifuged in a refrigerated environment to obtain plasma. Plasma samples (stored at − 80 °C) were thawed on ice until free of any frozen particulates. Plasma samples were then prepared by adding 400 μL of plasma to a 1.5 mL microcentrifuge tube which was then centrifuged at 21000 × g for 4 minutes. The centrifugation split the plasma sample into three layers, particulates on bottom, clear plasma in the middle, and a fatty layer on top. From these layers 350 μL was carefully pipetted out of the middle layer. The 350 μL was then transferred to a new 1.5 mL microcentrifuge tube to which was added 100 μL of 5 from a 10 ng mL−1 solution in reconstitution solution. The resulting solution was then vortexed and subjected to solid phase extraction.
2.7 Preparation of rhesus monkey CSF samples
CSF samples containing salvinorin A were stored at − 80 °C until shortly before processing. Samples were thawed in an ice-bath until they were free flowing and free of ice crystals. Once thawed 300 μL of CSF sample was transferred to a high recovery sample vial and diluted to a total volume of 350 μL while containing 10 % acetonitrile, 1.0 % formic acid, and 1.0 ng of internal standard (4). Samples were then analyzed using multiple reaction monitoring (mrm) on a LC-MS/MS system.
2.8 Soild Phase Extraction
Strata C18-E 55 micron, 70 Å SPE cartridges (Phenomenex, Torrance, CA) were used during preparation of both standard and human samples. A 12-Position SPE vacuum manifold from Phenomenex was used with vacuum pressure between 1 and 10 inches of Hg, depending on consistency of plasma, to maintain a flow rate of approximately 1 mL min−1. SPE columns were conditioned by washing sequentially with 3 mL of methanol and 3 mL of Millipore H2O. Plasma samples were then loaded onto the column and rinsed with 3 mL of washing solution before being dried under gentle vacuum for 5 minutes. Salvinorin A was then extracted off the columns into 2 dram vials using 2 mL of eluting solution and evaporated to dryness under a gentle stream of nitrogen gas at room temperature. Extracts were then reconstituted into 350 μL of mobile phase and transferred to a total recovery autosample vial.
2.9 Instrumentation
Samples were injected on a Waters Acquity UPLC (Waters corp Milford, MA), however, separations were performed on conventional HPLC media at traditional flow rates. Column effluent was into a Micromass Quattro Ultima (Micromass LTD Manchester, UK) triple quadrupole mass spectrometer with an electrospray source via a divert valve that shunts the injection front to waste. A Micro-Tech Scientific 1 mm ID × 5cm Zorbax C18 300 Å 3.5 micron column preceded by a 2.0 cm × 1 mm ID guard column was used to separate salvinorin A from internal standard and impurities. The HPLC solvent gradient is outlined in Table 1. Data was collected and processed using MassLynx version 4.1 (Waters Inc.). Instrumental parameters are summarized in Table 2. Guard columns were hand packed using 1 mm “kits” (upchurch/idex P/N C-128).
Table 1.
Solvent gradient program used for elution during LC-MS/MS analysis25.
| Time (min) | Flow Rate | % Solvent A† | % Solvent B‡ |
|---|---|---|---|
| Initial | .135 | 99.0 | 1.0 |
| 1.0 | .135 | 99.0 | 1.0 |
| 2.0 | .135 | 71.0 | 29.0 |
| 10.0 | .135 | 67.0 | 33.0 |
| 10.1 | .145 | 5.0 | 95.0 |
| 11.0 | .145 | 5.0 | 95.0 |
| 12.0 | .130 | 99.0 | 1.0 |
Solvent A consisted of 99.0 % H2O and 1.0 % acetonitrile
Solvent B consisted of 99.92 % acetonitrile and 0.08 % formic acid
Table 2.
Set parameters of instrumentation
| Parameter | Set Value |
|---|---|
| Ionization Mode | ES+ |
| Injection Volume | 50.00 μL |
| Capillary | 2.81 kV |
| Source Temperature | 100 °C |
| Desolvation Temperature | 250 °C |
| Q1 & Q3 Resolution | 0.8 amu, wh |
| Collision Cell Pressure | 1.55e−3 mbar |
3 Results and Discussion
While previously it has been shown that salvinorin A (1) can be detected in CSF following i.v. administration, these procedures employed lengthy SPE procedures before the samples were ready for instrumental analysis and were limited by the use of MS1 only (no MS/MS) scanning18. By removing any SPE procedures, the turnover time from sample collection to processed data was greatly reduced taking only about one minute per sample to prepare. We had hoped a similar procedure could be followed with plasma samples, initial attempts at reproducing previously published methods18 resulted in repeated clogging of the 30 mg mL−1 SPE cartridges. While commercially processed plasma was void of any sample processing issues, it was immediately apparent there was a broad variability in the propensity to clog an SPE column with plasma across individual participants as well as individual samples within a participant sample set. Switching to a higher loading capacity column did appear to slightly remedy the issue, although it did not completely prevent the columns from becoming clogged (Table 3). Due to the desire to maintain sensitivity, amount of plasma per injection, and the concern that loading SPE columns beyond 100 mg mL−1 would require a significant increase in elution volume which would make the reconstitution step less consistent, further plasma pretreatment was explored using the most successful Strata C18-E columns.
Table 3.
SPE columns tried for the extraction of salvinorin A from human plasma.
| SPE Column | Loading Capacity | SPE Attempts | Attempts Plugged | Plasma Volume |
|---|---|---|---|---|
| Oasis HLB | 30 mg mL−1 | 5 | 5 | 200 μL |
| Strata-X | 30 mg mL−1 | 5 | 5 | 200 μL |
| Strata-X-C | 30 mg mL−1 | 5 | 5 | 200 μL |
| Strata-X-CW | 30 mg mL−1 | 5 | 5 | 200 μL |
| Strata C8 | 100 mg mL−1 | 5 | 2 | 400 μL |
| Strata C18-E | 100 mg mL−1 | 5 | 2 | 400 μL |
Plasma sample pretreatment was investigated to avoid SPE columns from becoming clogged. Solvent protein precipitation with either cold ethanol or cold acetonitrile was pursued, however, the SPE columns were still obstructed. We next attempted to removal of particulates via prolonged centrifugation. Upon centrifugation for several minutes it was noticed that samples separated into a pellet, clear plasma, and a third fatty lipid-like layer. Upon loading the clear plasma, middle layer, onto an SPE cartridge it was found that it easily passed through the column and allowed solvent to freely flow through the column with minimal vacuum pressure thus making centrifugation our standard plasma pretreatment preparation method.
Standard curve samples were prepared from ACSF due to the limited supply of natural CSF. Removing the SPE workup from the CSF sample and residual impurities in plasma samples however did slowly clog the HPLC guard column and raise the pressure within the instrument. The pressure increase over injection cycles was remedied by changing the guard column after the pressure had increased to over 4600 psi, but never until all injections had been completed from a single participant series. Usually 70 to 400 injections, depending on sample quality, could be made before the pressure warranted repacking of the guard column. The pressure limit “error” feature in the Acquity software stopped injections as needed.
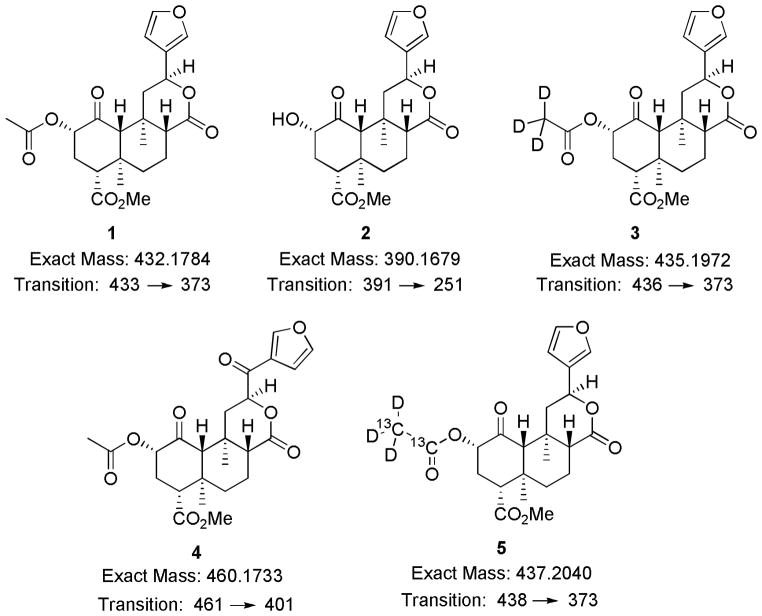
After reproducible sample preparation for both CSF and plasma was obtained we next focused on selecting an appropriate internal standard. A previous method using an APCI source and SIM acquisition or MS scans only (e.g. no MS/MS) successfully used 3 as an internal standard18. However when converting to MS/MS the increase in sensitivity revealed a slight impurity of 1 detected within the deuterated sample 3, observed as cross-talk between the mrm channels with pure internal standard injections. Presumably the small impurity comes from deuteron-proton exchange with the glassware during synthesis of 3. The previously published synthetic procedure20 was followed three times by two chemists each time using freshly prepared salvinorin A, with special attention paid to anhydrous technique to reduce the number of exchangeable protons in the system. However in each case, there was found approximately 2–3% of (433u)-salvinorin A, 1, mixed into the deuterium labeled (435u)-salvinorin A, 3. In order to avoid the need for additional mathematical manipulation during data processing to account for this impurity, internal standard 4 was used for processing CSF samples because of its structural similarity, column retention, and +28 mass units in relation to 1. A successful of a “pure” +5 mass analogue of salvinorin A used completely deuterated solvents and glass ware washes to help eliminate deuteron-proton exchange. In blank rhesus monkey cerebrospinal fluid, collected in the absence of salvinorin A, no interference was found on the chemical transitions monitored for 1 and 4. After altering the synthetic method previously used for the synthesis of (433u)-salvinorin A it was found that with extensive washing of glassware with D2O and performing the synthesis in a “perdeuterium” environment the cross-talk between channels was eliminated by > 99.99% as observed in the MS. The synthetically and isotopically pure (438u)-salvinorin A was used during the processing of human plasma samples.
It has been previously shown that salvinorin A can be metabolized to salvinorin B ex vivo by both human18 or rat plasma13, however formation of salvinorin B, 2, was not observed during the processing of human samples. As the main purpose of this study was the quantification of 1 rather than 2 we chose not to pursue a lower limit of detection and only monitored for the appearance of 2, which would indicate salvinorin B is an in vivo metabolite of salvinorin A. Linear detection of 2 above 1.0 ng mL−1 was possible, however this required the monitoring of three chemical transitions of 2 391/251, 391/145, and 391/259. It should be noted however that the metabolism of 1 to 2 has been shown to be slowed significantly at lower temperatures13. As the autosampler temperature was set to 4 °C and the time from SPE processing to placement within the autosampler was kept to a minimum, there may not have been sufficient time to produce detectable amounts of 2 due to the fast processing and reduced temperature storage between injections. Additionally even though significant quantities of 2 were not detected, there still remains a possibility that 2 may be conjugated to a sugar such as the glucuronide very rapidly. The CID transitions for the detection of conjugate derivatives of 2 were not monitored.
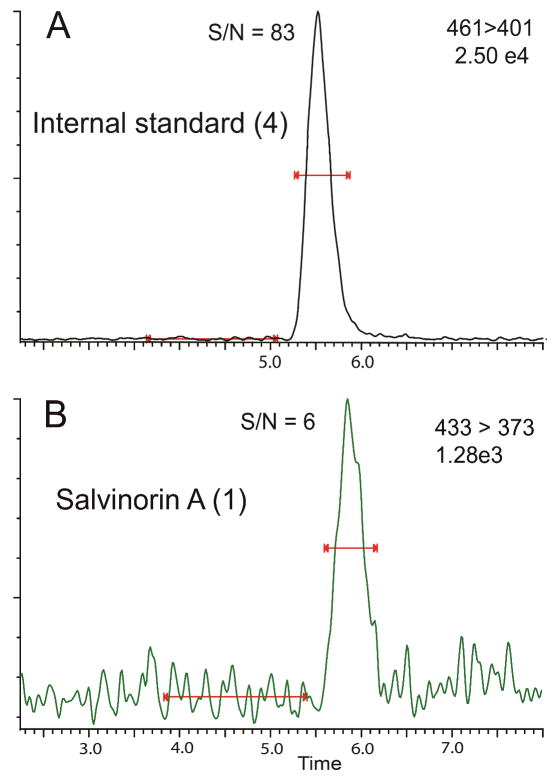
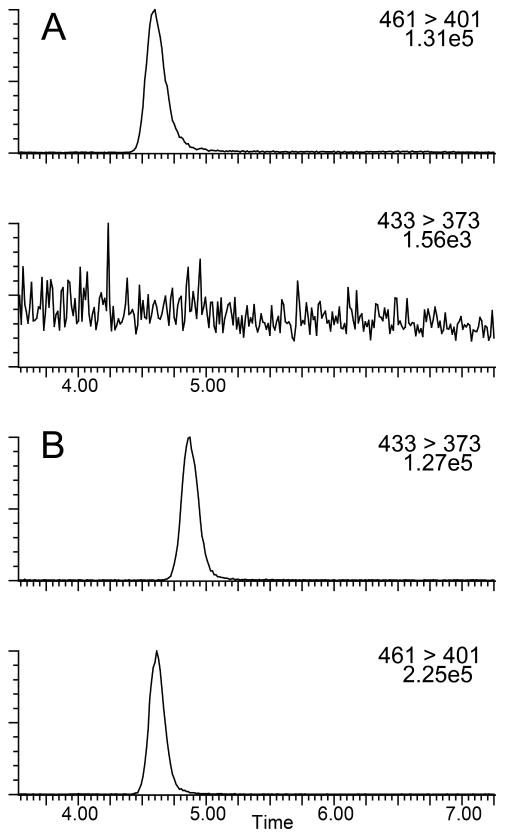
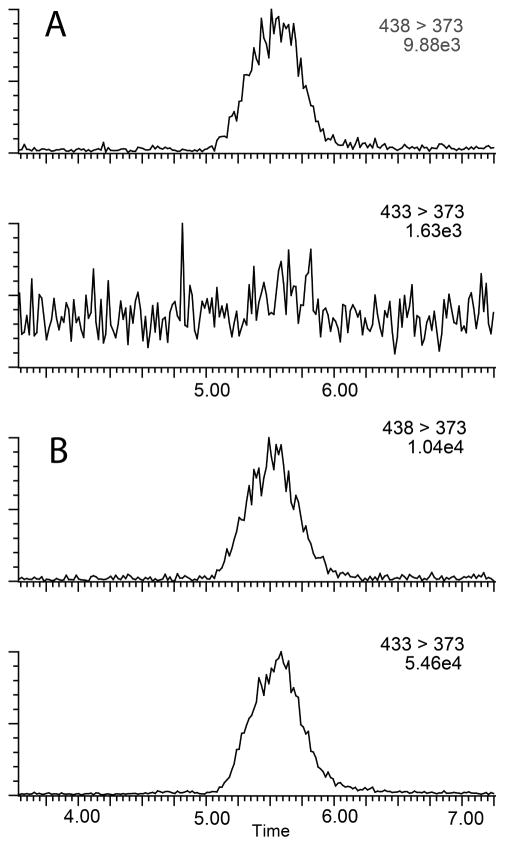
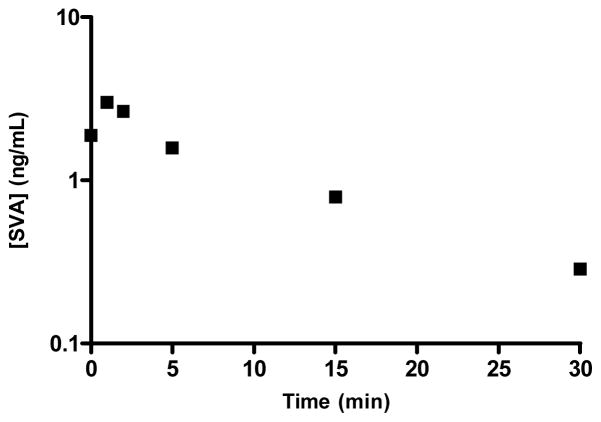
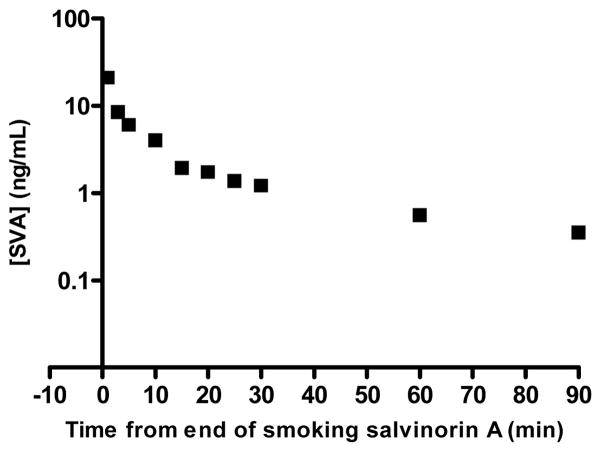
Percent recovery was calculated from integrated peak area ratios of salvinorin A undergoing SPE procedures versus salvinorin A injected from organic solvent. Precision was defined as the average standard deviation from each injection for every sample in all standard curves, calculated as the ratio of the standard deviation to the mean (81 injections for CSF, 168 injections for plasma). Accuracy was defined as the deviation of the calculated concentration from the theoretical standard concentration for each injection for every sample in all standard curves (81 injections for CSF, 168 injections for plasma). Precision and accuracy were calculated using quality control points of 0.5, 2.5, and 25 ng mL−1, table 4 summarizes statistical data compiled during sample processing. The lower limit of quantification (LLOQ) was defined as the point where signal to noise remained ≥5:1, while the precision and accuracy remained better than 20%, as seen in Figure 2. For CSF samples the LLOQ was determined to be 0.0125 ng mL−1 with precision and accuracy of 5.8 % and 10.96 % respectively. For Plasma samples the LLOQ was determined to be 0.05 ng mL−1 with precision and accuracy of 4.7 % and 7.47 % respectively. Analyte stability remained consistent in prepared samples for at least two weeks when frozen and stored at -20°C or 8 hrs when stored at ambient temperatures as that was the longest time duration between injections of a prepared sample. For CSF samples analytical standards were prepared in artificial cerebrospinal fluid due to limited access to the large volumes of authentic cerebrospinal fluid that would be required for all the standard samples. Matrix effects were not encountered in either plasma or CSF samples with excellent linearity observed in respective standard curves and recoveries were near 100% comparing matrix mixed samples to “clean” solvent standards. Chromatograms of blanks and authentic samples can be seen for both CSF and plasma in figures 3 & 4 respectively. These chromatograms were randomly selected and increased peak widths correlate to the end of guard column use. Time course graphs for a full series of in vivo data points from both CSF and plasma samples can be seen in figures 5 & 6 respectively. Here the data fit to common anecdotal profiles of salvinorin A with a rapid onset and fast extinction of behavioral effects for non-human primate CSF.12 Moreover, the profile observed in human participants fits the subjective behavioral effects and drug strength ratings of participants who have used salvinorin A.8 Full data collected on the time course of salvinorin A effects in rhesus monkey CSF linked to behavioral effects have been published16, while full data on behavioral effects of salvinorin A in human plasma are being prepared.
Table 4.
Statistical data for salvinorin A from rhesus monkey CSF and human plasma
| Parameter | Monkey CSF | Human plasma |
|---|---|---|
| Linearity | 0.0125 – 50 ng/mL1 | 0.25 – 50 ng/mL3 |
| (R2) | ≥.998 | 0.997 – .9994 |
| Limit of Quantification | 0.0125 ng/mL | 0.05 ng/mL |
| Precision (Interday, Intraday) | CV (< 1.7 %, < 1.3 %)2 | CV (< 3.47 %, < 2.85 %)5 |
| Accuracy (Interday, Intraday) | (< 9.42 %, 4.94 %)2 | (< 12.37 %, 7.08 %)5 |
| Percent Recovery | 93% – 114% |
Six-point calibration curve ran in triplicate
Calculated from 3 sets of 27 injections each
Five-point calibration curves ran in triplicate
Range of correlation coefficients over seven trials
Calculated from 7 sets of 27 injections each
Figure 2.
LC/MS/MS chromatogram with a signal to noise measurement for the internal standard (3) at a concentration of 2.86 ng mL−1 (Panel A). LC/MS/MS chromatogram and signal to noise measurement for the salvinorin A (1) at a concentration of 0.0125 ng mL−1 (Panel B).
Figure 3.
Representative chromatograms of CSF samples. Internal standard and analyte channels for a baseline blank injection (Panel A). Analyte and internal standard from an authentic CSF time course sample (Panel B).
Figure 4.
Representative chromatograms of plasma samples. Internal standard and analyte channels for a baseline blank injection (Panel A). Analyte and internal standard from an authentic plasma time course sample (Panel B).
Figure 5.
Salvinorin A in rhesus monkey CSF after a 100ug/kg dose
Figure 6.
Salvinorin A from human plasma after smoking a dose of 19 ug/kg.
Conclusions
The method described allows for the quantification of salvinorin A at behaviorally active doses16 from cerebrospinal fluid after i.v. injection in non-human primates, and from plasma after inhalation in humans. Plasma samples showed an order of magnitude increase in sensitivity from prior methods, while in CSF samples SPE procedures were successfully bypassed while increasing the level of sensitivity two orders of magnitude relative to previously published methods14, 18. Major increases in sensitivity were derived from larger injection volume with analyte focusing on a smaller inner diameter column thus increasing peak concentration, while MS/MS transitions reduced chemical noise as anticipated. However these techniques do warrant the monitoring of back pressure on the LC and guard column, reduction in sample work-up (CSF samples) and large injection volumes onto a smaller inner diameter column slowly obstructed the guard column and increased back pressure due to slow clogging during sample injection. Backpressure was relieved by repacking of the guard column as needed depending on sample cleanliness. Synthesis and use of new internal standards 4, 5 prevented cross talk between mrm channels and eliminated the need for mathematical manipulation of the data due to impurities formed from deuteron-proton exchange during chemical synthesis of 3. The method described was successfully used during the processing of plasma samples of a human study across multiple subjects, as well as a non-human primate study in which salvinorin A was quantified from CSF across multiple subjects16.
Figure 1.
Chemical structures, exact masses and mrm transitions of salvinorin A (1), salvinorin B (2), d3-salvinorin A (3), Internal standard for CSF samples (4), and d3, 13C2-salvinorin A (5)
Acknowledgments
The authors would like to thank the National Institute on Drug Abuse for financial support of ongoing research through grants (DA018151 to T.E.P., DA017369 to E.R.B., DA05130 to M.J.K. and DA03889 to R.R.G.). The content is the sole responsibility of the authors and does not necessarily represent the official views of the National Institute on Drug Abuse or the National Institutes of Health.
References
- 1.Valdes LJ., III Journal of Psychoactive Drugs. 1994;26:277–283. doi: 10.1080/02791072.1994.10472441. [DOI] [PubMed] [Google Scholar]
- 2.Ott J. Curare. 1995;18:103–129. [Google Scholar]
- 3.Siebert DJ. Journal of Ethnopharmacology. 1994;43:53–56. doi: 10.1016/0378-8741(94)90116-3. [DOI] [PubMed] [Google Scholar]
- 4.Roth BL, Baner K, Westkaemper R, Siebert D, Rice KC, Steinberg S, Ernsberger P, Rothman RB. Proceedings of the National Academy of Sciences. 2002;99:11934–11939. doi: 10.1073/pnas.182234399. [DOI] [PMC free article] [PubMed] [Google Scholar]
- 5.Cunningham CW, Rothman RB, Prisinzano TE. Pharmacological Reviews. 2011;63:316–347. doi: 10.1124/pr.110.003244. [DOI] [PMC free article] [PubMed] [Google Scholar]
- 6.Butelman ER, Harris TJ, Kreek MJ. Psychopharmacology. 2004;172:220–224. doi: 10.1007/s00213-003-1638-0. [DOI] [PubMed] [Google Scholar]
- 7.Butelman E, Rus S, Prisinzano T, Kreek M. Psychopharmacology. 2010;210:253–262. doi: 10.1007/s00213-009-1771-5. [DOI] [PMC free article] [PubMed] [Google Scholar]
- 8.Johnson MW, MacLean KA, Reissig CJ, Prisinzano TE, Griffiths RR. Drug and Alcohol Dependence. 2011;115:150–155. doi: 10.1016/j.drugalcdep.2010.11.005. [DOI] [PMC free article] [PubMed] [Google Scholar]
- 9.S. S. A. a. M. H. S. Administration. Office of Applied Studies. Rockville, MD: 2008. [Google Scholar]
- 10.Johnston LD, O’Malley PM, Bachman JG, Schulenberg JE. Institute for Social Research, The University of Michigan; Ann Arbor: 2012. [Google Scholar]
- 11.Siebert DJ. The Salvia divinorum Research and Information Center; 2012. http://www.sagewisdom.org/legalstatus.html. [Google Scholar]
- 12.Butelman ER, Prisinzano TE, Deng H, Rus S, Kreek MJ. Journal of Pharmacology and Experimental Therapeutics. 2009;328:588–597. doi: 10.1124/jpet.108.145342. [DOI] [PMC free article] [PubMed] [Google Scholar]
- 13.Tsujikawa K, Kuwayama K, Miyaguchi H, Kanamori T, Iwata YT, Inoue H. Xenobiotica. 2009;39:391–398. doi: 10.1080/00498250902769967. [DOI] [PubMed] [Google Scholar]
- 14.Schmidt MD, Schmidt MS, Butelman ER, Harding WW, Tidgewell K, Murry DJ, Kreek MJ, Prisinzano TE. Synapse. 2005;58:208–210. doi: 10.1002/syn.20191. [DOI] [PubMed] [Google Scholar]
- 15.Hooker JM, Munro TA, Beguin C, Alexoff D, Shea C, Xu Y, Cohen BM. Neuropharmacology. 2009;57:386–391. doi: 10.1016/j.neuropharm.2009.06.044. [DOI] [PMC free article] [PubMed] [Google Scholar]
- 16.Butelman ER, Caspers M, Lovell KM, Kreek MJ, Prisinzano TE. Journal of Pharmacology and Experimental Therapeutics. 2012;341:802–808. doi: 10.1124/jpet.112.193227. [DOI] [PMC free article] [PubMed] [Google Scholar]
- 17.McDonough PC, Holler JM, Vorce SP, Bosy TZ, Magluilo J, Jr, Past MR. Journal of Analytical Toxicology. 2008;32:417–421. doi: 10.1093/jat/32.6.417. [DOI] [PubMed] [Google Scholar]
- 18.Schmidt MS, Prisinzano TE, Tidgewell K, Harding W, Butelman ER, Kreek MJ, Murry DJ. Journal of Chromatography B. 2005;818:221–225. doi: 10.1016/j.jchromb.2004.12.041. [DOI] [PubMed] [Google Scholar]
- 19.Munro TA, Rizzacasa MA. Journal of Natural Products. 2003;66:703–705. doi: 10.1021/np0205699. [DOI] [PubMed] [Google Scholar]
- 20.Tidgewell K, Harding WW, Schmidt M, Holden KG, Murry DJ, Prisinzano TE. Bioorganic & Medicinal Chemistry Letters. 2004;14:5099–5102. doi: 10.1016/j.bmcl.2004.07.081. [DOI] [PubMed] [Google Scholar]
- 21.Lovell KM, Vasiljevik T, Araya JJ, Lozama A, Prevatt-Smith KM, Day VW, Dersch CM, Rothman RB, Butelman ER, Kreek MJ, Prisinzano TE. Bioorganic & Medicinal Chemistry. 2012;20:3100–3110. doi: 10.1016/j.bmc.2012.02.040. [DOI] [PMC free article] [PubMed] [Google Scholar]
- 22.Oien DB, Ortiz AN, Rittel AG, Dobrowsky RT, Johnson MA, Levant B, Fowler SC, Moskovitz J. Journal of Neurochemistry. 2010;114:51–61. doi: 10.1111/j.1471-4159.2010.06721.x. [DOI] [PMC free article] [PubMed] [Google Scholar]
- 23.Ortiz AN, Kurth BJ, Osterhaus GL, Johnson MA. Neuroscience Letters. 2011;492:11–14. doi: 10.1016/j.neulet.2011.01.036. [DOI] [PMC free article] [PubMed] [Google Scholar]
- 24.Ortiz AN, Kurth BJ, Osterhaus GL, Johnson MA. Journal of Neurochemistry. 2010;112:755–761. doi: 10.1111/j.1471-4159.2009.06501.x. [DOI] [PMC free article] [PubMed] [Google Scholar]
- 25.Butelman E, Caspers M, Lovell KM, Kreek MJ, Prisinzano T. Journal of Pharmacology and Experimental Therapeutics. 2012 doi: 10.1124/jpet.112.193227. [DOI] [PMC free article] [PubMed] [Google Scholar]


