Abstract
Purpose
Adult human vocal tracts display considerable morphological variation across individuals, but the nature and extent of this variation has not been extensively studied for many vocal tract structures. There exists a need to analyze morphological variation and, even more basically, to develop a methodology for morphological analysis of the vocal tract. Such analysis will facilitate fundamental characterization of the speech production system, with broad implications from modeling to explaining inter-speaker variability.
Method
A data-driven methodology to automatically analyze the extent and variety of morphological variation is proposed and applied to a diverse subject pool of 36 adults. Analysis is focused on two key aspects of vocal tract structure: the midsagittal shape of the hard palate and the posterior pharyngeal wall.
Result
Palatal morphology varies widely in its degree of concavity, but also in anteriority and sharpness. Pharyngeal wall morphology, by contrast, varies mostly in terms of concavity alone. The distribution of morphological characteristics is complex, and analysis suggests that certain variations may be categorical in nature.
Conclusion
Major modes of morphological variation are identified, including their relative magnitude, distribution and categorical nature. Implications of these findings for speech articulation strategies and speech acoustics are discussed.
Introduction
Vocal tract morphology is a fundamental consideration in characterizing the human speech production system because, as with any motor system, the physical size and shape of structures that comprise the vocal tract underlie many aspects of articulation and control. Morphology has additional importance for the speech production system due to its role in shaping speech sounds. The vocal tract's acoustical properties (e.g., resonant characteristics) are determined by its shape, which is determined not only by active shaping and articulation, but also by the vocal tract's inherent morphology. At the same time, morphology varies widely across individuals, which has at least two major implications. First, morphological variation is a potential source of variability in both the articulatory and acoustic domains. Second, a detailed understanding of morphological differences between individuals can facilitate fresh insights into many aspects of inter-speaker variability, speech motor control and speech production modeling.
Many studies (e.g., Hiki & Itoh, 1986) have observed differences in palatal concavity (i.e., whether the palate is flat or has a high, domed shape), but little beyond concavity has been noted or quantified. Even with this basic understanding of morphological differences, it has become clear that palate shape influences many aspects of speech production, particularly for coronal consonants (Fuchs et al., 2006). Many aspects of sibilant fricative articulation are related to palate shape, including laminal versus apical articulation (Dart, 1991), medial groove formation (McCutcheon et al., 1980) and tongue placement strategies (Toda, 2006; Weirich & Fuchs, 2011). Moreover, when palate shape is artificially altered, articulation of sibilant fricatives has been shown to adapt over time (Baum & Mc-Farland, 1997; Honda et al., 2002; Thibeault et al., 2011). Sonorant articulation is also variable depending on whether the palate is domed or flat in shape. Tiede et al. (2005) demonstrated that altering palate shape with a prosthesis can switch subjects from producing “bunched” to “retroflex” American English /r/. Speakers with flat palates have been shown to exhibit less articulatory variability during vowel production than speakers with domed palates (Perkell, 1997; Mooshammer et al., 2004; Brunner et al., 2005, 2009). Vowel production also adapts over time to artificial changes in palate shape (Brunner et al., 2007). These changes are likely due to the fact that palate shape alters the resonant properties of the vocal tract, particularly for high front vowels (Lammert, Proctor, Katsamanis, & Narayanan, 2011).
Most attention toward morphological variation in the vocal tract has been focused on overall length and proportions along a single dimension defined by the midsagittal vocal tract midline, from the lips to the glottis. Overall length of the vocal tract varies significantly through development and between adult individuals (Fant, 1960; Vorperian et al., 2005, 2009). Proportions of the vocal tract also vary, particularly the relative length of the oral and pharyngeal cavities (Chiba & Kajiyama, 1941; King, 1952; Fitch & Giedd, 1999; Vorperian et al., 1999; Arens et al., 2002; Boë et al., 2006, 2008; Lammert, Proctor, & Narayanan, 2011). The purpose of this study is to provide an in-depth quantification and analysis of key morphological variations orthogonal to the midline in adult speakers. The width of the vocal tract orthogonal to its midline is central to articulatory descriptions of phonetic segments (e.g., vocal tract area functions, manner of articulation, constriction degree), yet morphological variation in this direction has not been extensively investigated. This study focuses specifically on the hard palate and the posterior pharyngeal wall, which determine much of the morphology orthogonal to the midsagittal midline. The hard palate, because it is immovable, constitutes a cornerstone of the articulatory environment in which speech production takes place. The pharyngeal wall is movable, but is similarly important because of its large size and because its movements during speech are small relative to its size.
Despite several studies showing that hard palatal morphology impacts speech production, very little is known about the extent and variety of morphological variation in that structure. Even less is known about morphological variation of the posterior pharyngeal wall, which may have a related influence on speech production. The current investigation aims to address this gap in knowledge by developing and applying a methodology to automatically determine the principal varieties of shape variation in the hard palate and posterior pharyngeal wall across individuals, referred to here as modes, along with the proportion of total observed variance explained by each of these modes. As an illustration, consider the differences in palatal concavity that have been previously observed by researchers (see above). Differences in palatal concavity constitute one possible mode of variation in palate shape, but may not constitute the most prominent mode, and there may be other prominent modes to consider. The proposed methodology addresses these issues, and it does so in data-driven fashion, rather than imposing prior notions regarding what kinds of variation are expected.
Given the modes of shape variation, it is also possible to examine whether categorical distinctions are suggested by the data, independent of any known groups. For instance, do individuals exhibit a tight, unimodal distribution with regard to palatal concavity? If they do, then one can reasonably say what the ‘typical’ shape is. If, however, speakers exhibit a more complex, multimodal distribution, then it might be better to say that they fall into distinct categories (i.e., that they form clusters). A second set of statistical analysis aims to automatically estimate the distribution of individuals according to the major modes of shape variation, and whether any clusters are indicated by the data.
Because speech is the primary interest of this study, a group of speakers who have no history of speech, language, or hearing pathology is investigated. Any subject who met this criterion was included in the study, regardless of factors such as race and language background. The motivation for assembling a diverse group was to understand the extent and variety of morphological variations that can still result in normal speech. Many factors influence cranio-facial morphology, including sex (Xue & Hao, 2006), dental pathology (Ishii et al., 2002), race (Morgan et al., 1995; Evereklioglu et al., 2002; Xue et al., 2006; Wu et al., 2010; Wamalwa et al., 2011; Gu et al., 2011), and history of mouthbreathing (Gross et al., 1994; Harari et al., 2010), but normal speech can result in any of these conditions. The primary interest motivating this study is not the sources and correlates of morphological variability, but rather the breadth of morphological variation that exists in a normal-speaking group of individuals, and particularly those morphological variations that may impact speech production.
Methods
Subjects
A group of 36 healthy adult subjects with no reported history of speech, language, or hearing pathology were considered. The average age of subjects was 27.0 years with a standard deviation of 4.3 years (range between 19 and 37). Subjects included 30 individuals who self-identified their race as White, Non-Hispanic, and 6 Asians. One subject exhibited a Class III malocclusion (a white male speaker of German), and all other subjects showed normal dental occlusion patterns. Subjects were from diverse language backgrounds, including 22 native speakers of American English, 8 native German speakers, 5 native Mandarin speakers, and 1 native speaker of Hindi.
Image Acquisition
Midsagittal vocal tract images of all subjects were collected using real-time magnetic resonance imaging (rtMRI) as part of a larger study assessing the explicit connection between variation in the morphological, articulatory and acoustic domains. The use of rtMRI reflects the goals of this larger study, which will require imaging techniques that capture articulatory dynamics and the corresponding acoustic signal in conjunction with each subject's morphological features.
Image acquisition was performed at Los Angeles County Hospital on a Signa Excite HD 1.5T scanner (GE Healthcare, Waukesha, WI) with gradients capable of 40 mT/m amplitude and 150 mT/m/ms slew rate. A custom 4-channel upper airway receiver coil array, with two anterior coil elements was used for radio frequency (RF) signal reception. A 13-interleaf spiral gradient echo pulse sequence (TR = 6.164 msec, FOV = 200 mm × 200 mm, flip angle = 15°) was used. The scan slice had a thickness of approximately 5 mm. Resolution of reconstructed images was 68 pixels × 68 pixels, which equates to a pixel width of approximately 3.0 mm × 3.0 mm. New image data were acquired at a rate of 12.5 frames per second, and reconstructed using a sliding window technique to produce a video rate of 23.18 frames per second. Further details about the rtMRI image acquisition protocol can be found in Narayanan et al. (2004). Data considered in this work were acquired over scan sessions starting in March of 2006 and ending in December of 2011. All work was approved by the University of Southern California institutional review board prior to acquisition.
Images used in this study showed subjects at rest with mouths closed, breathing through the nose. All subjects were instructed to lie comfortably in the scanner in supine position. Subjects' heads were oriented along the midline of the body and padded in place to prevent lateral motion during the scan. The midsagittal plane was localized by real-time examination of slices orthogonal to the midsagittal plane (e.g., an oblique axial slice) (Santos et al., 2004). By visualizing these planes, localization markers could be placed over landmarks such as the nose tip and the pharyngeal cross-sectional airway and iteratively refined to ensure accurate localization.
A potential confound in studying morphology of the posterior pharyngeal wall is that is can deform somewhat by active articulation and passive conditions in the pharynx. The posterior pharyngeal wall can be actively recruited for swallowing and other functions of the vocal tract (Magen et al., 2003). It can also deform due to extreme flexion/extension of the neck (Penning, 1988) and due to pressure buildup in the pharynx (Proctor et al., 2010). To ensure an accurate reflection of the posterior pharyngeal wall's inherent morphology, these sources of deformation were controlled for in several ways. Subjects were imaged during rest position for breathing in order to avoid effects from active articulation or pharyngeal pressure buildup. Flexion/extension of the neck was controlled for by instructing subjects to lie comfortably in the scanner. Subject comfort has previously been used to define a natural reference position for flexion/extension of the head and neck for studying the shape of the pharynx (Mohammed et al., 1994). Note that asking subjects to assume a pre-defined amount of flexion/extension (e.g., in terms of degrees) is problematic because (a) it may be uncomfortable for some subjects to hold the pre-defined position and (b) it may not reflect a subjects' natural posture and thereby potentially violate ecological validity. The results section of this paper presents further statistical analysis, related to this point, with the aim of identifying any significant relationship between flexion/extension of the head and the modes of pharyngeal wall deformation.
Image Processing
Five images were identified for each subject, capturing rest position during breathing and with the tongue pressed against the teeth and hard palate. These images were averaged to improve the signal-to-noise ratio and to ensure a representative rest position. Canny edge detection (Canny, 1986) was used with manual linking and correction to trace the hard palate and posterior pharyngeal wall (see Figure 1). Traces of the hard palate began at the upper dentition and extended along the palate to the posterior nasal spine (i.e., hard-soft palate junction). Pharyngeal wall traces extended from its highest point in the nasopharynx,down to the entry of the esophagus, a reliable anatomical landmark.
Figure 1.
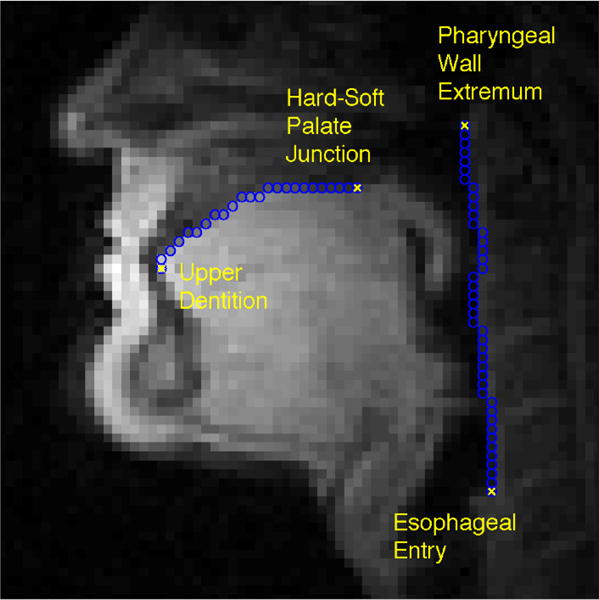
Midsagittal image of a male subject used in the analysis. The image shows the subject at rest, with mouth closed and breathing through the nose. Automatically-derived traces of the hard palate and posterior pharyngeal wall have been overlaid, along with anatomical landmarks used to delimit those structures.
Traces of each structure were aligned at their end-points through rotation, translation and uniform scaling. This allowed each contour to be regarded as a single vector of distance measurements along and perpendicular to the line defined by its end-points. All vectors were subsequently resampled to 100 elements and compiled into the sets and , for each of the 36 subjects, i.
Analysis
The analysis was designed to be as data-driven as possible, providing a description of the statistical aspects of shape variations present in the data with minimal assumptions and maximum generality. Analysis was aimed at the following aspects of the data: (1) the principal modes of shape variation in the hard palate and posterior pharyngeal wall, and what proportion of the total observed variance can be explained by each of these modes, (2) the distribution of individuals according to the modes of shape variation and (3) any general categorical distinctions in shape (i.e., clusters of speakers) suggested by the data, independent of any known groups.
To address the first question, Principal Component Analysis (PCA) was applied. Given a set of observations, xphar and xpal, PCA finds the orthogonal modes of variation present in the data, and also numerical values representing an individual's shape according to those modes, often called scores. The analysis is defined such that each successive mode accounts for as much of the variance as possible, and such that the proportion of the variance accounted for by each mode can be calculated. Moreover, because the largest few modes account for most of the variance in the data, one can describe complex shapes using the scores from only a small number of modes. Thus, PCA directly addresses the first question, and also facilitates further analyses by consideration of the scores.
The second question requires accurate estimation of the probability distribution of individuals according to the largest modes of variation. Distributions were estimated by employing Kernel Density Estimation, using a Gaussian kernel to estimate the probability density at 100 points. The width of the Gaussian kernel, corresponding to the standard deviation of the Gaussian, was set to 0.3σ, where σ is the standard deviation of the specific feature in question.
The third question is best addressed through cluster analysis. Clusters were found by applying the K-means algorithm to the PCA scores. All cluster optimizations were done with random centroid initializations and 100 repetitions to avoid convergence to a local minimum (the lowest-cost solution was selected). In choosing the number of clusters, a size constraint was imposed such that all clusters were required to have more than four individuals (i.e., 10% of the subject pool). Individuals were clustered into the largest number of clusters that did not violate this size constraint. For both palate shapes and pharyngeal wall shapes, the appropriate number of clusters, according to these criteria, was precisely three.
Results
Hard Palate
The major modes of hard palate variation, as suggested by the data, can be seen in Figure 2. The three largest modes are shown, which together account for over 85% of the variance in the data. Moreover, these modes seem to have easy interpretations in terms of their physical meaning. The first mode, accounting for 51% of the variance in the data, represents the degree of concavity of the palate (i.e., whether it is flat or domed). The second mode, which accounts for another 25% of the variance, is related to the anteriority of the palate: whether the apex of the dome is positioned toward the anterior or posterior portion of the oral cavity. An additional 10% of the variance can be attributed to the sharpness/flatness of the palate at its apex. These modes will be referred to, respectively, as concavity, anteriority and sharpness for the remainder of the discussion of palatal variation. Figure 3 shows images of individuals who represent the extremes of these three modes.
Figure 2.
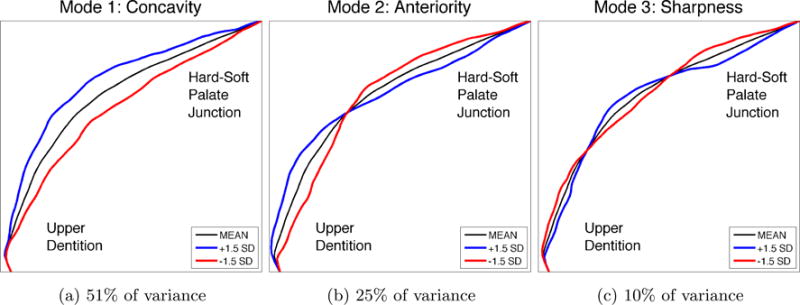
The three largest modes of variation in hard palate shape, determined in completely data-driven fashion, without imposing any prior notions about expected shape variations, by applying PCA to the observed hard palate shapes from the subject pool. Modes reflect differences in concavity, anteriority of the apex, and sharpness of the palate around the apex. The overall mean hard palate shape is shown in black, and the blue and red lines show the nature of deviations from the mean according to each mode. The magnitude of the deviations shown reflect the magnitude of variations seen in the subject pool, at precisely +/- 1.5 standard deviations from the mean shape. Because these modes account for over 85% of the overall variance, arbitrary hard palate shapes may be well-represented using only these three modes.
Figure 3.
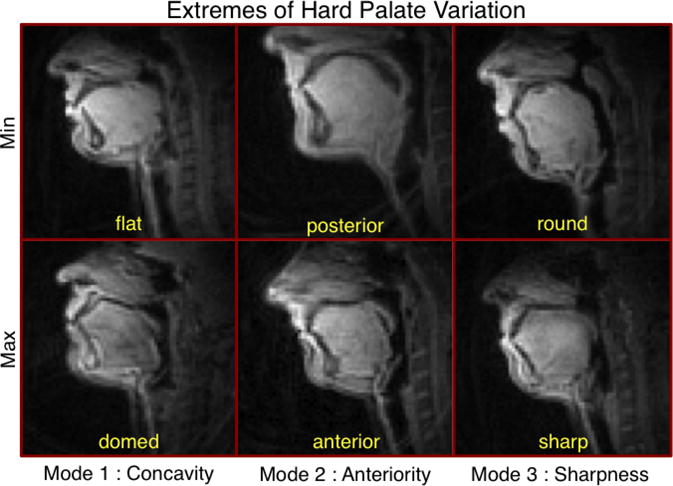
Midsagittal images of subjects representing the extremes of each mode of variation in hard palate shape. Modes reflect differences in palatal concavity, anteriority of the palatal dome's apex, and sharpness of the palate around its apex.
The distribution of individuals according to concavity, anteriority and sharpness can be seen in Figure 4. All three distributions appear to be bimodal, with both modes being approximately equally likely. Subjects are distributed most broadly according to palatal concavity, slightly less broadly according to anteriority and even less broadly according to the palatal sharpness. This pattern corresponds closely to the proportion of variance accounted for by each kind of variation. Moreover, the presence of multiple modes exhibited by all three distributions indicates that hard palate shapes may naturally separate into categories, which can be found by applying cluster analysis.
Figure 4.
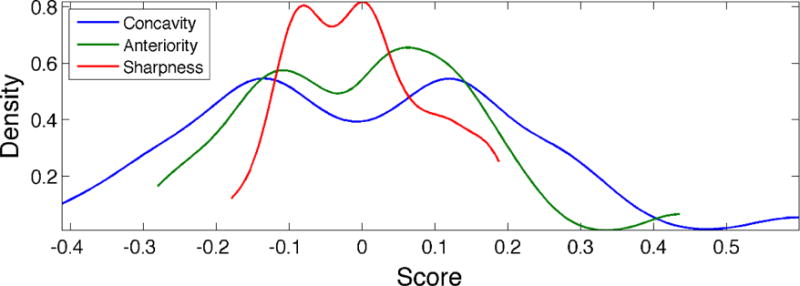
Distribution of hard palates according to the three largest modes of shape variation. Abscissa values represent scores derived from PCA, with a value of 0 representing the hard palate mean shape. Modes accounting for more of the variance in the data (e.g., concavity) display a broader distribution. The presence of multiple modes, exhibited by all three distributions, indicates that hard palate shapes may naturally separate into categories.
Cluster analysis revealed three categories of palate shapes. The mean shapes for all individuals in each cluster are visualized in Figure 5. These clusters can be interpreted as comprising individuals with (1) concave palates, (2) flat, anterior palates and (3) flat, posterior palates. Approximately half of the subjects fell into the first cluster, containing concave palates. Remaining subjects were split between the other two clusters.
Figure 5.
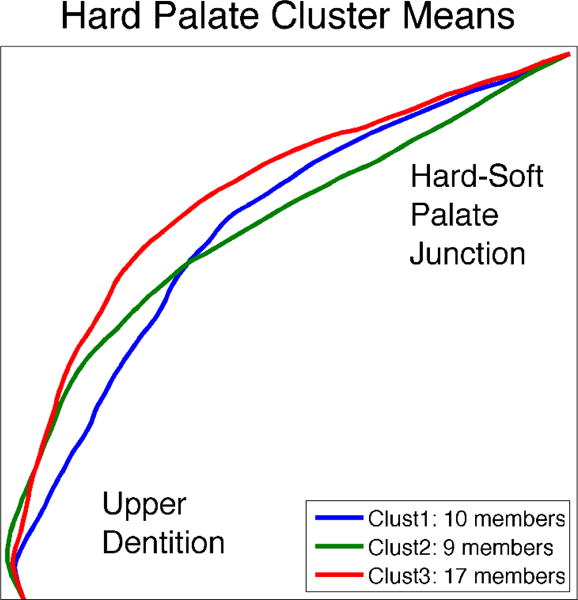
Hard palate shapes representing the three categories of hard palate shape, determined in completely data-driven fashion, by applying K-means cluster analysis to the observed hard palate shapes from the subject pool. The displayed hard palates reflect the mean shape of all hard palates contained within one cluster. Clusters can be interpreted as comprising (1) concave palates,(2) flat, anterior palates and (3) flat, posterior palates.
Posterior Pharyngeal Wall
The major modes of posterior pharyngeal wall variation can be seen in Figure 6. The two largest modes are shown, which together account for over 82% of the variance in the data. Similar to the palate shapes, the largest mode of variation in the pharyngeal wall is related to the degree of concavity (75% of the total variance). A much smaller second mode, accounting for an additional 7% of the variance, reflects differences in the inclination of the pharyngeal wall, from fairly vertical to forward-leaning. These modes will be referred to, respectively, as concavity and inclination for the remainder of the discussion of pharyngeal wall variation. Images of individuals who represent the extremes of these two modes can be seen in Figure 7.
Figure 6.
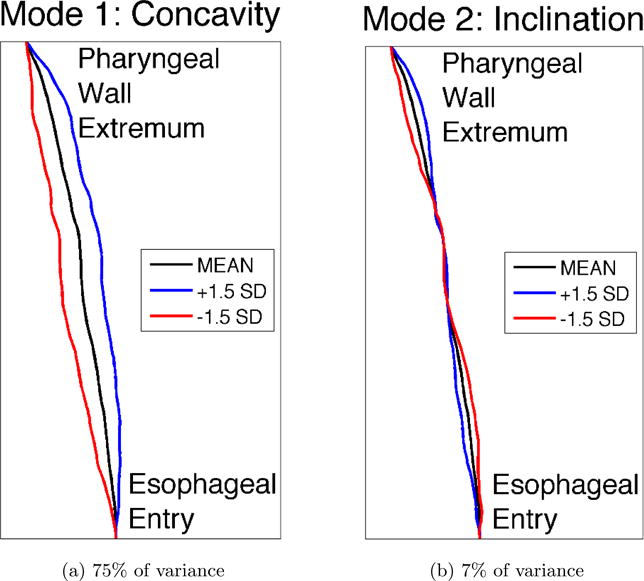
The two largest modes of variation in posterior pharyngeal wall shape, determined in completely data-driven fashion, without imposing any prior notions about expected shape variations, by applying PCA to the observed pharyngeal wall shapes from the subject pool. Modes reflect differences in concavity and inclination of the pharyngeal wall. The overall mean pharyngeal wall shape is shown in black, and the blue and red lines show the nature of deviations from the mean according to each mode. The magnitude of the deviations shown reflect the magnitude of variations seen in the subject pool, at precisely +/- 1.5 standard deviations from the mean shape. Because these modes account for over 82% of the overall variance, arbitrary pharyngeal wall shapes may be well represented using only these two modes.
Figure 7.
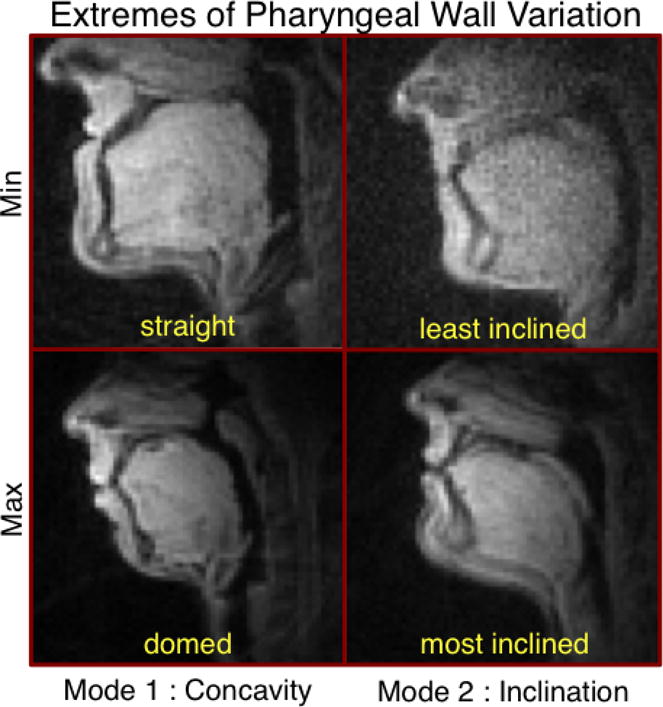
Midsagittal images of subjects representing the extremes of each mode of variation in posterior pharyngeal wall shape. Modes reflect differences in pharyngeal wall concavity and inclination of the pharyngeal wall.
Further analyses were run to establish that the observed differences in pharyngeal wall shape reflected inherent morphological differences and not differences due to neck flexion/extension. Neck extension was estimated by drawing one line each through the palate and pharyngeal wall endpoints and calculating the angle between those lines. Previous research has indicated that flexing/extending the head across a wide range (40 degrees, centered on a comfortable, neutral posture) has little effect on key upper airway dimensions (Mohammed et al., 1994). It was found that rest positions varied by only 21 degrees (from 64 to 85 degrees) across subjects in this study. Correlation coefficients were calculated between neck extension and pharyngeal wall shape (i.e., the first two principal modes). Correlation between neck extension and pharyngeal wall concavity was not statistically significant (Pearson's r = −0.01, p = 0.96), making it very likely that this mode of variation reflects inherent differences in morphology. Correlation with inclination, on the other hand, approached significance (Pearson's r = 0.31, p = 0.07). Based on this result, it is conceivable that the observed differences in posterior pharyngeal wall inclination were, at least in part, caused by neck flexion/extension.
The distribution of individuals according to concavity and inclination can be seen in Figure 8. Concavity exhibits a very broad distribution, which appears to be trimodal. Moreover, the left two modes of this distribution are both more likely than the rightmost mode. Inclination, on the other hand, displays a highly peaked, unimodal distribution, centered about the mean. The presence of multiple modes, exhibited by concavity, indicates that hard palate shapes may naturally separate into categories, which can be found by applying cluster analysis.
Figure 8.
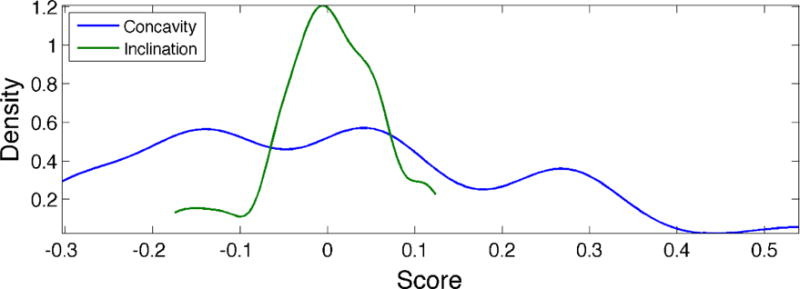
Distribution of posterior pharyngeal walls according to the three largest modes of shape variation. Abscissa values represent scores derived from PCA, with a value of 0 representing the pharyngeal wall mean shape. Modes accounting for more of the variance in the data (e.g., concavity) display a broader distribution. The presence of multiple modes, such as that exhibited by concavity, indicates that pharyngeal wall shapes may naturally separate into categories.
Cluster analysis revealed three categories of pharyngeal wall shapes. The mean shapes for all individuals in each cluster are visualized in Figure 9. These clusters can be interpreted as comprising individuals at various levels of concavity, from very straight, to slightly concave, to extremely concave. Approximately 45% of the subjects had very straight pharyngeal walls, while fewer were slightly concave (33%), and even fewer had extremely concave pharyngeal walls (22%).
Figure 9.
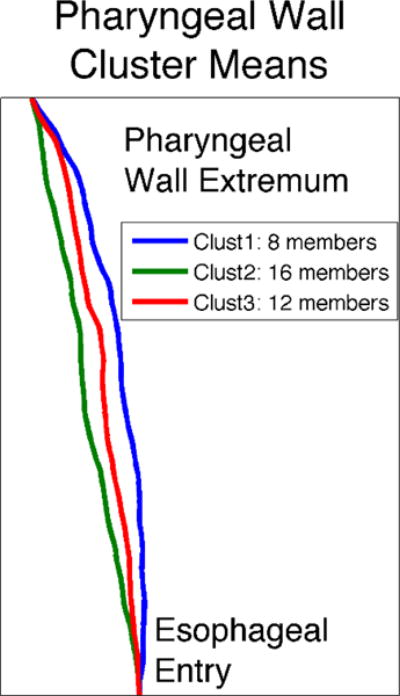
Posterior pharyngeal wall shapes representing the three categories of pharyngeal wall shape, determined in completely data-driven fashion, by applying K-means cluster analysis to the observed pharyngeal wall shapes from the subject pool. The displayed pharyngeal walls reflect the mean shape of all pharyngeal walls contained within one cluster. Clusters can be interpreted as comprising shapes of increasing concavity, from very straight, to slightly concave, to extremely concave.
Discussion
A methodology has been proposed for detailed statistical analysis of morphological differences in the vocal tract in which analysis is largely automatic and data-driven. The advantage of a data-driven approach is that it allows the data to directly express the variety and extent of variation, rather than imposing prior notions of expected variations. It is notable that the analyses here revealed highly interpretable structure in the data because the results of a data-driven approach can sometimes suffer from poor interpretability. For instance, with respect to the major modes of shape variation in the hard palate and posterior pharyngeal wall, a large majority of the variance can be cleanly interpreted.
Substantial variation was observed in the degree of concavity of the hard palate, which accounted for more of the variance than any other single mode. This reinforces the observations of previous studies (e.g., Hiki & Itoh, 1986; Brunner et al., 2009), which noted that palatal concavity is a major source of morphological variation. Two additional modes of variation were found orthogonal to concavity that accounted for substantial amounts of variability in the data. Additional dimensions include the anterior-posterior position of the apex of the palatal dome, and the sharpness/flatness of the palatal dome shape around that apex. The diversity of hard palate morphology observed in these data may have important implications for articulation strategies across individuals. Anteriority of the palatal inflection has the potential to affect place of articulation for all coronal segments. Roundness or sharpness of the palate could affect the details of tongue shaping for production of coronal fricatives. Future work will focus on these kinds of effects.
Concavity differences also constitute the largest mode of morphological variation in the posterior pharyngeal wall. Unlike the hard palate, however, these concavity differences account for the vast majority of the observed variance, with much less contribution from additional modes. The next largest mode – vertical inclination of the pharyngeal wall – accounts for an order of magnitude less variation compared to concavity, and may simply be related to differences in head flexion/extension. Differences in pharyngeal wall concavity have been shown to impact vowel production by determining the width of the pharynx, and consequently the resonant properties of the vocal tract, especially for low back vowels (Lammert, Proctor, Katsamanis, & Narayanan, 2011). There may be additional consequences for maintaining pressure gradients in the pharynx which would affect voicing, particularly for voiced fricatives where pressure buildup must be carefully controlled. For languages with pharyngeal and emphatic consonants (e.g., Semitic, Afro-Asiatic), place of articulation may also be impacted.
The current data set suggests that variations in shape may be categorical, tending to cluster into specific shape classes. For instance, hard palate shapes reliably cluster into three categories: (1) highly domed palates, (2) flatter palates, for which the small dome is more anterior, and (3) flatter palates, for which the small dome is more posterior. Posterior pharyngeal wall shapes also cluster into three categories, mostly related to concavity: (1) very straight pharyngeal walls, (2) slightly concave pharyngeal walls and (3) extremely concave pharyngeal walls. Some of these categorical differences in morphology may be accompanied by categories in the articulatory and acoustic domains, which will be investigated in future work.
As previously mentioned, most attention toward morphological variation in the vocal tract has been focused on overall length and proportions along a single dimension defined by the vocal tract midline. The interplay of acoustical and articulatory variability with respect to these differences has been of value in the domain of speech research for studying longstanding questions related to inter-speaker variability (Vilain et al., 1999; Fuchs et al., 2008; Nissen & Fox, 2009), goals of speech production (Ménard et al., 2007), speech acquisition (Ananthakrishnan, 2011) and motor control (Winkler et al., 2006, 2011). The current analysis may facilitate similar investigations into the impact of palate and pharyngeal wall structure on articulation and acoustics.
The ultimate goal of this line of research is to assess the impact of morphological variation on speech articulation and acoustics. Examining the relationships between variations in morphology, articulation and acoustics holds promise for explaining inter-speaker variability in production patterns. It should be possible to predict production patterns from observations about an individual's palatal and pharyngeal morphology. Moreover, a fundamental analysis of the speech production system's physical structure (e.g., morphology) can act as a foundation for understanding many aspects of speech motor control. Effective control demands detailed knowledge of structure, which implies that modeling of control would benefit from such knowledge, as well. Many additional questions may also be examined using morphological knowledge, such as the longstanding debate over the nature of speech production goals. The extent to which speakers minimize differences in the articulatory versus acoustic domains can offer insight into the goals of production. By finding ways to quantify and analyze morphological differences, the current study constitutes an important step toward achieving these larger goals. Future research will address those goals by combining the current analyses with the articulatory information afforded by rtMRI and the noise mitigated audio that was recorded in synchrony with the articulatory data (Bresch et al., 2006).
There are many aspects of morphological variation remaining to be studied in more detail. The morphology of movable structures (e.g., the tongue and lips) should be of particular importance for patterns of articulation. Studying these structures poses serious practical and theoretical challenges, including the need to define a reference posture as a basis for comparing morphology. Detailing morphology off the midsagittal plane – and especially 3-dimensional morphology – is also of major importance. Studying the connection between 3D morphology and articulation will be crucial, but also poses practical challenges given the limitations of current real-time imaging. Work also remains in terms of identifying systematic correlates of morphological variation, both ontogenetic and hereditary. This kind of understanding may make it possible to robustly predict production patterns and explain inter-speaker variability. Finally, future study could benefit from an even more diverse subject pool, to more accurate estimate the full range and variety of morphological differences that can result in normal speech patterns.
Acknowledgments
This work has been supported by the National Institutes of Health (Grant DC007124), and a graduate fellowship from the Annenberg Foundation.
Contributor Information
Adam Lammert, Signal Analysis & Interpretation Laboratory (SAIL), University of Southern California, 3710 McClintock Ave., Los Angeles, CA 90089, USA.
Michael Proctor, Signal Analysis & Interpretation Laboratory (SAIL), University of Southern California, 3710 McClintock Ave., Los Angeles, CA 90089, USA, Now at Marcs Institute/School of Humanities and Languages, University of Western Sydney, Locked Bag 1797, Penrith, NSW 2751, Australia.
Shrikanth Narayanan, Signal Analysis & Interpretation Laboratory (SAIL), University of Southern California, 3710 McClintock Ave., Los Angeles, CA 90089, USA.
References
- Ananthakrishnan G. Imitating adult speech: An infant's motivation. Proceedings of the International Seminar on Speech Production; Montreal. 2011. pp. 361–369. [Google Scholar]
- Arens R, McDonough J, Corbin A, Hernandez M, Maislin G, Schwab R, et al. Linear dimensions of the upper airway structure during development assessment by Magnetic Resonance Imaging. American Journal of Respiratory and Critical Care Medicine. 2002;165(1):117–122. doi: 10.1164/ajrccm.165.1.2107140. [DOI] [PubMed] [Google Scholar]
- Baum S, McFarland D. The development of speech adaptation to an artificial palate. Journal of the Acoustical Society of America. 1997;102(4):2353–2359. doi: 10.1121/1.419619. [DOI] [PubMed] [Google Scholar]
- Boë LJ, Captier G, Granat J, Deshayes M, Heim J, Birkholz P, et al. Skull and vocal tract growth from fetus to 2 years. Proceedings of the International Seminar on Speech Production; Strasbourg. 2008. pp. 157–160. [Google Scholar]
- Boë LJ, Granat J, Badin P, Autesserre D, Pochic D, Zga N, et al. Skull and vocal tract growth from newborn to adult. Proceedings of the International Seminar on Speech Production; Ubatuba. 2006. pp. 75–82. [Google Scholar]
- Bresch E, Nielsen J, Nayak K, Narayanan S. Synchronized and noise-robust audio recordings during realtime MRI scans. Journal of the Acoustical Society of America. 2006;120(4):1791–1794. doi: 10.1121/1.2335423. [DOI] [PMC free article] [PubMed] [Google Scholar]
- Brunner J, Fuchs S, Perrier P. In: The influence of the palate shape on articulatory token-to-token variability. Geng C, Brunner J, Pape D, editors. Vol. 42. ZAS Papers in Linguistics; 2005. pp. 43–67. [Google Scholar]
- Brunner J, Fuchs S, Perrier P. On the relationship of palate shape and articulatory behavior. Journal of the Acoustical Society of America. 2009;125(6):3936–3949. doi: 10.1121/1.3125313. [DOI] [PubMed] [Google Scholar]
- Brunner J, Hoole P, Perrier P. Articulatory optimisation in perturbed vowel articulation. Proceedings of the International Congress of Phonetic Sciences; Saarbrücken. 2007. pp. 497–500. [Google Scholar]
- Canny J. Computational approach to edge detection. IEEE Transactions Pattern Analysis and Machine Intelligence. 1986;8(6):679–698. [PubMed] [Google Scholar]
- Chiba T, Kajiyama M. The vowel – Its nature and structure. Tokyo: Kaiseikan; 1941. [Google Scholar]
- Dart S. In: Articulatory and acoustic properties of apical and laminal articulations. Maddieson I, editor. Vol. 79 UCLA working papers in phonetics; 1991. [Google Scholar]
- Evereklioglu C, Doganay S, Er H, Gunduz A, Tercan M, Balat A, et al. Craniofacial anthropometry in a Turkish population. Cleft Palate-Craniofacial Journal. 2002;39(2):208–218. doi: 10.1597/1545-1569_2002_039_0208_caiatp_2.0.co_2. [DOI] [PubMed] [Google Scholar]
- Fant G. Acoustic theory of speech production. The Hague: Mouton; 1960. [Google Scholar]
- Fitch W, Giedd J. Morphology and development of the human vocal tract: A study using magnetic resonance imaging. Journal of the Acoustical Society of America. 1999;106(3):1511–1522. doi: 10.1121/1.427148. [DOI] [PubMed] [Google Scholar]
- Fuchs S, Perrier P, Geng C, Mooshammer C. What role does the palate play in speech motor control? Insights from tongue kinematics for German alveolar obstruents. In: Harrington J, Tabain M, editors. Towards a better understanding of production processes. New York: Psychology Press; 2006. pp. 149–164. [Google Scholar]
- Fuchs S, Winkler R, Perrier P. Do speakers' vocal tract geometries shape their articulatory vowel space?. Proceedings of the International Seminar on Speech Production; Strasbourg. 2008. pp. 333–336. [Google Scholar]
- Gross AM, Kellum GD, Franz D, Michas K, Walker M, Foster M, et al. A longitudinal evaluation of open mouth posture and maxillary arch width in children. Orthodontist. 1994;64(6):419–424. doi: 10.1043/0003-3219(1994)064<0419:ALEOOM>2.0.CO;2. [DOI] [PubMed] [Google Scholar]
- Gu Y, McNamara JJA, Sigler LM, Baccetti T. Comparison of craniofacial characteristics of typical Chinese and Caucasian young adults. European Journal of Orthodontics. 2011;33(2):205–211. doi: 10.1093/ejo/cjq054. [DOI] [PubMed] [Google Scholar]
- Harari D, Redlich M, Miri S, Hamud T, Gross M. The effect of mouth breathing versus nasal breathing on dentofacial and craniofacial development in orthodontic patients. Laryngoscope. 2010;120(10):2089–2093. doi: 10.1002/lary.20991. [DOI] [PubMed] [Google Scholar]
- Hiki S, Itoh H. Influence of palate shape on lingual articulation. Journal of Speech Communication. 1986;5(2):141–158. [Google Scholar]
- Honda M, Fujino A, Kaburagi T. Compensatory responses of articulators to unexpected perturbation of the palate shape. Journal of Phonetics. 2002;30(3):281–302. [Google Scholar]
- Ishii N, Deguchi T, Hunt NP. Craniofacial differences between Japanese and British Caucasian females with a skeletal Class iii malocclusion. Orthodontics. 2002;24(5):494–499. doi: 10.1093/ejo/24.5.493. [DOI] [PubMed] [Google Scholar]
- King E. A roentgenographic study of pharyngeal growth. Angle Orthodontist. 1952;22(1):23–37. [Google Scholar]
- Lammert A, Proctor M, Katsamanis A, Narayanan S. Morphological variation in the adult vocal tract: A modeling study of its potential acoustic impact. Proceedings of INTERSPEECH; Florence. 2011. pp. 2813–2816. [Google Scholar]
- Lammert A, Proctor M, Narayanan S. Morphological variation in the adult vocal tract: A study using rtMRI. Proceedings of the International Seminar on Speech Production; Montreal. 2011. [Google Scholar]
- Magen H, Kang A, Tiede M, Whalen D. Posterior pharyngeal wall position in the production of speech. Journal of Speech, Language and Hearing Research. 2003;46(1):241–251. doi: 10.1044/1092-4388(2003/019). [DOI] [PubMed] [Google Scholar]
- McCutcheon M, Hasegawa A, Fletcher S. Effects of palatal morphology on /s, z/articulation. Journal of the Acoustical Society of America. 1980;67(1):94–94. [Google Scholar]
- Ménard L, Schwartz JL, Boë LJ, Aubin J. Articulatory-acoustic relationships during vocal tract growth for French vowels: Analysis of real data and simulations with an articulatory model. Journal of Phonetics. 2007;35(1):1–19. [Google Scholar]
- Mohammed A, Marshall I, Douglas N. Effect of posture on upper airway dimensions in normal human. American Journal of Respiratory and Critical Care Medicine. 1994;149(1):145–148. doi: 10.1164/ajrccm.149.1.8111573. [DOI] [PubMed] [Google Scholar]
- Mooshammer C, Perrier P, Geng C, Pape D. An EMMA and EPG study on token-to-token variability. Arbeitsberichte des Instituts für Phonetik und digitale Sprachverarbeitung der Universität Kiel. 2004;36:47–63. [Google Scholar]
- Morgan NJ, MacGregor FB, Birchall MA, Lund VJ, Sittampalam Y. Racial differences in nasal fossa dimensions determined by acoustic rhinometry. Rhinology. 1995;33(4):224–228. [PubMed] [Google Scholar]
- Narayanan S, Nayak K, Lee S, Sethy A, Byrd D. An approach to real-time magnetic resonance imaging for speech production. Journal of the Acoustical Society of America. 2004;115(4):1771–1776. doi: 10.1121/1.1652588. [DOI] [PubMed] [Google Scholar]
- Nissen S, Fox R. Acoustic and spectral patterns in young children's stop consonant productions. Journal of the Acoustical Society of America. 2009;126(3):1369–1378. doi: 10.1121/1.3192350. [DOI] [PubMed] [Google Scholar]
- Penning L. Radioanatomy of upper airways in flexion and retroflexion of the neck. Neuro-radiology. 1988;30(1):17–21. doi: 10.1007/BF00341937. [DOI] [PubMed] [Google Scholar]
- Perkell J. Articulatory processes. In: Hardcastle W, Laver J, editors. The Handbook of Phonetic Sciences. Cambridge, MA: Blackwell; 1997. pp. 333–370. [Google Scholar]
- Proctor M, Shadle C, Iskarous K. Pharyngeal articulation in the production of voiced and voiceless fricatives. Journal of the Acoustical Society of America. 2010;127(3):1507–1518. doi: 10.1121/1.3299199. [DOI] [PMC free article] [PubMed] [Google Scholar]
- Santos J, W GA, Pauly J. Flexible real-time magnetic resonance imaging framework. Conference Proceedings of IEEE Engineering in Medicine and Biology Society; San Francisco. 2004. pp. 1048–1051. [DOI] [PubMed] [Google Scholar]
- Thibeault M, Ménard L, Baum S, Richard G, McFarland D. Articulatory and acoustic adaptation to palatal perturbation. Journal of the Acoustical Society of America. 2011;129(4):2112–2120. doi: 10.1121/1.3557030. [DOI] [PubMed] [Google Scholar]
- Tiede M, Gracco V, Shiller D, Espy-Wilson S, Boyce CE. Perturbed palatal shape and North American English /r/ production. Journal of the Acoustical Society of America. 2005;117(4):2568–2569. [Google Scholar]
- Toda M. Deux stratégies articulatoires pour la réalisation du contraste acoustique des sibilantes /s/ et /S/ en français. XXVI ès Journées d'Étude de la Parole. 2006:65–68. [Google Scholar]
- Vilain A, Abry C, Brosda S, Badin P. From idiosyncratic pure frames to variegated babbling: Evidence from articulatory modeling. Proceedings of the International Congress of Phonetic Sciences; San Francisco. 1999. pp. 2497–2500. [Google Scholar]
- Vorperian H, Kent R, Gentry L, Yandell B. Magnetic resonance imaging procedures to study the concurrent anatomic development of vocal tract structures: preliminary results. International Journal of Pediatric Otorhinolaryngology. 1999;49:197–206. doi: 10.1016/s0165-5876(99)00208-6. [DOI] [PubMed] [Google Scholar]
- Vorperian H, Kent R, Lindstrom MJ, Kalina CM, Gentry LR, Yandell BS. Development of vocal tract length during early childhood: A magnetic resonance imaging study. Journal of the Acoustical Society of America. 2005;117(1):338–350. doi: 10.1121/1.1835958. [DOI] [PubMed] [Google Scholar]
- Vorperian H, Wang S, Chung M, Schimek E, Durtschi R, Kent R, et al. Anatomic development of the oral and pharyngeal portions of the vocal tract: An imaging study. Journal of the Acoustical Society of America. 2009;125(3):1666–1678. doi: 10.1121/1.3075589. [DOI] [PMC free article] [PubMed] [Google Scholar]
- Wamalwa P, Amisi SK, Wang Y, Chen S. Angular photogrammetric comparison of the soft-tissue facial profile of Kenyans and Chinese. Journal of Craniofacial Surgery. 2011;22(3):1064–1072. doi: 10.1097/SCS.0b013e31821075d8. [DOI] [PubMed] [Google Scholar]
- Weirich M, Fuchs S. Vocal tract morphology can influence speaker specific realizations of phonemic contrasts. Proceedings of the International Seminar on Speech Production; Montreal. 2011. pp. 251–259. [Google Scholar]
- Winkler R, Fuchs S, Perrier P. The relation between differences in vocal tract geometry and articulatory control strategies in the production of French vowels: Evidence from MRI and modelling. Proceedings of the International Seminar on Speech Production; Ubatuba. 2006. [Google Scholar]
- Winkler R, Fuchs S, Perrier P, Tiede M. Speaker-specific biomechanical models: From acoustic variability via articulatory variability to the variability of motor commands in selected tongue muscles. Proceedings of the International Seminar on Speech Production; Montreal. 2011. pp. 219–226. [Google Scholar]
- Wu JY, Hagg U, Pancherz H, Wong RW, McGrath C. Sagittal and vertical occlusal cephalometric analyses of pancherz: Norms for Chinese children. American Journal of Orthodontics and Dentofacial Orthopedics. 2010;137(6):816–824. doi: 10.1016/j.ajodo.2008.07.019. [DOI] [PubMed] [Google Scholar]
- Xue SA, Hao GJP, Mayo R. Volumetric measurements of vocal tracts for male speakers from different races. Clinical Linguistics & Phonetics. 2006;20(9):691–702. doi: 10.1080/02699200500297716. [DOI] [PubMed] [Google Scholar]
- Xue SA, Hao JG. Normative standards for vocal tract dimensions by race as measured by acoustic pharyngometry. Journal of Voice. 2006;20(3):391–400. doi: 10.1016/j.jvoice.2005.05.001. [DOI] [PubMed] [Google Scholar]


