Abstract
Long-period stacking ordered (LPSO) phases play an essential role in the development of magnesium alloys because they have a direct effect on mechanical and corrosion properties of the alloys. The LPSO structures are mostly divided to 18R and 14H. However, to date there are no consistent opinions about their degradation properties although both of them can improve mechanical properties. Herein we have successfully obtained two LPSO phases separately in the same Mg-Dy-Zn system and comparatively investigated the effect of different LPSO phases on degradation behavior in 0.9 wt.% NaCl solution. Our results demonstrate that a fine metastable 14H-LPSO phase in grain interior is more effective to improve corrosion resistance due to the presence of a homogeneous oxidation film and rapid film remediation ability. The outstanding corrosion resistant Mg-Dy-Zn based alloys with a metastable 14H-LPSO phase, coupled with low toxicity of alloying elements, are highly desirable in the design of novel Mg-based biomaterials, opening up a new avenue in the area of bio-Mg.
Magnesium (Mg) alloys have attracted a great deal of attention as orthopedic biodegradable implant materials due to their proper mechanical properties comparable to natural bone and good biocompatibility1. In comparison with ceramics or polymeric materials, metallic Mg materials are more suitable for load-bearing applications due to their combination of high mechanical strength and fracture toughness2. More significantly, the degradation product is a soluble, non-toxic oxides or hydroxides which can temporarily enhance osteoblast activity and decrease osteoclast number during bone remodelling3. These intriguing characteristics have made it possible for Mg alloys to be developed into degradable bio-Mg implants. However, the main bottleneck of degradable bio-Mg stents lies in its fast corrosion rate which leads to weak mechanical integrity. Therefore, during the healing process they cannot provide enough mechanical support, resulting in blood vessel restenosis4. Consequently, the development of new bio-Mg-based material becomes a critical issue.
Recently, Mg alloys with long-period stacking ordered (LPSO) phases have been found in ternary Mg-Zn-RE (RE = Y, Gd, Tb, Dy, Ho etc.) alloys5,6,7. The major types of LPSO structures involve the 18R and 14H models. The relationship between LPSO phases and mechanical properties has been well confirmed. Suzuki et al.8 reported that a small amount of Zn can increase the number of stacking faults in Mg-Y based alloys by introducing 18R-LPSO phase, wherein the movement of dislocations can be prohibited, resulting in the improvement of tensile strength. Yamada et al.9 pointed out that the addition of Zn is attributed to the formation of 18R-LPSO phase in Mg-2.1Gd-0.6Y-0.2Zr (at.%) alloy, in which both the strength and plasticity are enhanced significantly at low temperatures. These improved mechanical properties are well elucidated in terms of the increment of critical resolved shear stress of basal or non-basal slips10, the interface between LPSO phase and Mg matrix11 and the formation of kink bands9,12,13,14.
Compared to mechanical properties, the effect of LPSO phases on corrosion properties is unclear. In general, the LPSO phase acts as a heterogeneous spot, and then the pitting/galvanic corrosion might be increased15. However, Zhang et al.16 recently reported that the as-extruded Mg-Gd-Zn-Zr alloy exhibit a low and uniform corrosion rate of 0.17 mm/y in Hank's solution owing to the presence of 14H-LPSO phase. Zhao et al.17 verified that the corrosion properties of Mg-Zn-Y alloy containing 18R-LPSO phase in simulated body fluid are better than conventional engineering Mg alloys such as the AZ31, WE43, ZK60 and ZX60 alloys. Unfortunately, both studies did not provide detailed mechanisms with respect to these low degradation rates.
In addition, the presence of different LPSO structures is closely associated with solidification process and heat treatment condition. The corrosion rate of Mg97.25Zn0.75Y2 alloy containing the LPSO structure prepared by rapid cooling is significantly dependent on phase morphology18. An 18R-LPSO phase can be detected in as-cast or deformed samples, whilst a 14H-LPSO phase frequently forms after isothermal heat treatment at elevated temperatures19. Both 18R and 14H LPSO phases are of particular importance to improve the mechanical properties from the viewpoint of practice, therefore, it is very necessary to understand the difference in corrosion properties between 18R-LPSO and 14H-LPSO phases.
Based on the above analysis, two questions are proposed: (i) whether the corrosion mechanism is the same for both 18R-LPSO and 14H-LPSO phases? (ii) which phase is better to improve the corrosion properties although both of them play an essential role on improving the mechanical properties? In order to answer these questions, it is better to obtain the different LPSO phases in the same alloy system, which can eliminate the effect of different alloying elements on corrosion properties. In this work, we achieve these objectives in the Mg-2Dy-0.5Zn (at. %) alloy, in which both 18R-LPSO and 14H-LPSO phases are produced independently by tuning the heat treatment processing. The influence of LPSO phases on corrosion properties in 0.9 wt.% NaCl has been investigated and the corrosion mechanisms have been clarified in detail. These results provide some valuable clues for the explanation of degradation behaviors of different LPSO phases, as well as for the determination of suitable thermo-mechanical process in Mg-Zn-RE-based alloys containing LPSO phases in the future.
Results
Phase characterization
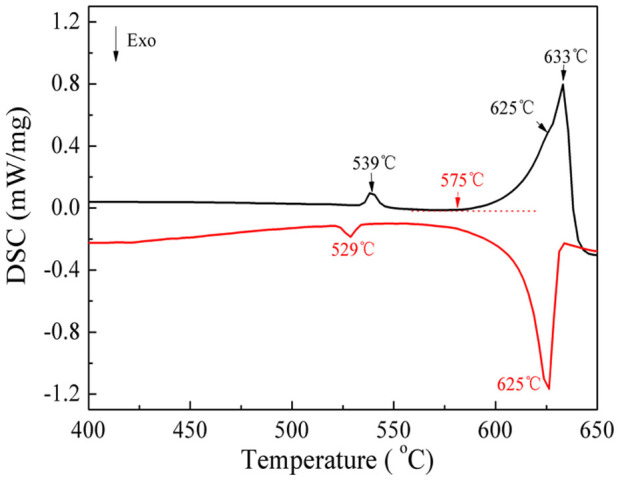
Two peaks are observed at 539°C and 633°C from the DSC heating curve (Fig. 1) of the as-cast Mg-2Dy-0.5Zn alloy (MDZ-C), wherein the secondary peak (633°C) is very wide. The DSC cooling curve also reveals the similar trend. The mere discrepancy lies in the variation of peak positions, which is mostly affected by thermal hysteresis. According to Mg-Dy binary phase diagram20, the secondary peak corresponds to melting process. In order to clarify the first peak, the sample is solid-solution treated at 545°C for 4 h (MDZ-545).
Figure 1. DSC curves of the as-cast Mg-2Dy-0.5Zn alloy at a heat rate of 6°C/min.
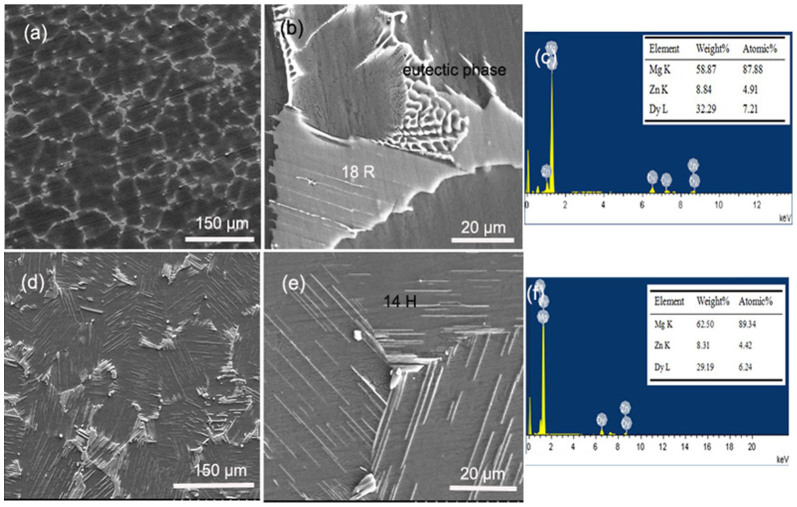
It can be seen from Fig. 2 that the MDZ-C sample is mostly composed of α-Mg matrix, a net-like eutectic phase and a sandwiched block-shaped precipitate with an approximate composition of Mg87.88Zn4.91Dy7.21 (Fig. 2c), which is consistent with previous 18R-LPSO result reported by Bi et.al.21. Comparatively, the MDZ-545 sample mainly contains α-Mg, a eutectic phase and a fine lamellar-shaped phase with an approximate composition of Mg89.34Zn4.42 Dy6.24 (Fig. 2f).
Figure 2. Typical SEM graphs of MDZ alloys under different states; (a) and (b) the MDZ-C alloy; (c) representative elemental composition of 18R-LPSO phase; (d) and (e) the MDZ-545 sample; (f) representative elemental compositions of 14H-LPSO phase.
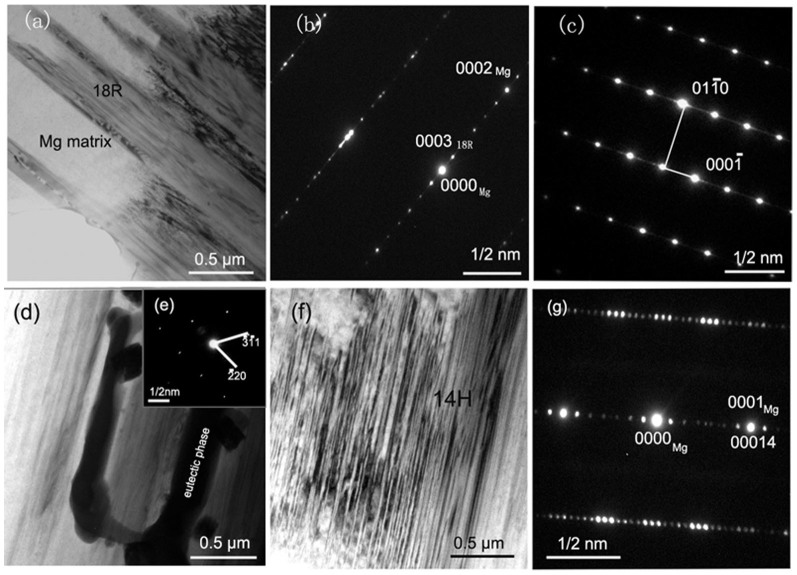
Based on the bright-field TEM micrograph of the MDZ-C alloy (Fig. 3a), we can see that a typical sandwiched structure is distributed in grain boundaries. In the corresponding selected area electron diffraction (SAED) pattern of gray phase (Fig. 3b) with the incidence of electron beam direction of [1000]Mg (Fig. 3c), some extra weaker spots are detected at positions n/6 (where n is an integer) between direct spot and (0002)Mg diffraction, indicating that the LPSO phase is 18R-type structure13,22. The rectangle precipitate is distributed along grain boundaries (Fig. 3d), which is ascribed to Mg24(Zn, Dy)5 eutectic phase with fcc crystal structure. The calculated a value is 1.023 nm (Fig. 3e), which is slightly less than that of Mg24Dy5 phase due to the substitution of Dy by Zn. The similar fine laminar-shaped configuration is also observed in the MDZ-545 alloy (Fig. 3f). However, the width is reduced and the aspect ratio is increased. According to the SAED of fine layer-shaped precipitate along [1000]Mg direction (Fig. 3g), it is found that small periodic diffraction spots at the interval of 1/14 of distance between direct spot and (0002)Mg reflection. The spots of (00014) and (0002)Mg are coincident in the same position. Based on the diffraction peak appearance along c-direction and the previous results7,23, it can be confirmed that the fine laminar-shaped LPSO phase is 14H-type structure.
Figure 3. (a) typical TEM graph of the MDZ-C sample; (b) and (c) SAED patterns of 18R-LPSO phase along [1000] direction and Mg matrix in (a), respectively; (d) eutectic phase in the MDZ-C alloy; (e) SAED pattern of eutectic phase along [114] direction in (d); (f) TEM graph of the MDZ-545 sample; (g) SAED pattern of 14H-LPSO phase along [1000] direction in (f).
Open circuit potential and immersion test
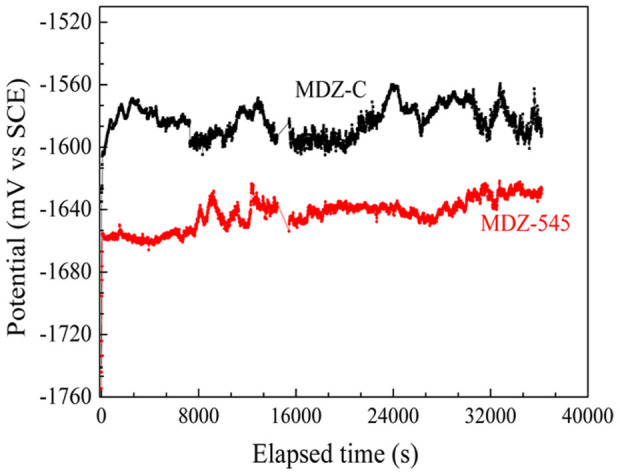
Fig. 4 depicts the evolution of corrosion potential (vs. SCE) of immersion test. The OCP of the MDZ-C alloy is increased from approximately −1750 mV to −1579 mV in 20 min. In contrast, the MDZ-545 alloy merely took 3 min to reach a relatively stable value of −1639 mV. Additionally, note that the active state dissolution potential (Ecorr) of the MDZ-C alloy fluctuates greatly in contrast to the MDZ-545 alloy, which is mainly ascribed to the rupture of oxidation film24.
Figure 4. OCP curves of MDZ alloys under different states in 0.9 wt.% NaCl solution.
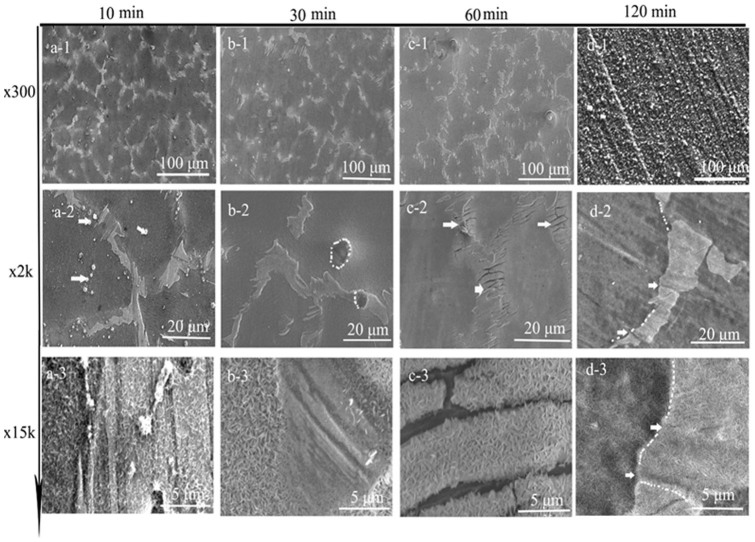
The effect of the immersion time on microstructures and surface morphologies of corrosion products are studied to understand the formation process of the oxidation film. For the MDZ-C sample, the coarse precipitates in grain boundaries are still identified clearly after immersing for 10 min or 30 min (Fig. 5a-1 and 5b-1), however, the configuration becomes unclear after immersing for 60 min and 120 min (Fig. 5c-1 and 5d-1). In addition, it was hardly observed cracks on the surface film of corrosion products after immersing for 10 and 30 min. Nevertheless, some cracks can be seen between secondary phase and the matrix after immersing for 60 min (Fig. 5c-2). Under high magnifications (Fig 5a-3, 5b-3 and 5c-3), a honeycomb corrosion film with corrosion products is detected. Moreover, a corrosion film firstly forms on the surface of Mg matrix (Fig. 5b-3). With increasing immersion time, the corrosion film grows towards a noble secondary phase. Some cracks of ~ 1 μm in width are observed in the areas between 18R-LPSO phase and matrix (white arrows, Fig. 5c-2). Nevertheless, it is worthy to note that the cracks are recovered after immersing for 120 min (Fig. 5d-2 and 5d-3), suggesting that the remediation of oxidation film occurs25. Another elucidation is that the MDZ-C alloy takes about 120 min to form a compact oxidation film26.
Figure 5. The initiation and development of the corrosion products formed on the MDZ-C alloy, (a) after immersion 10 min; (b) 30 min, (c) 60 min and (d) 120 min.
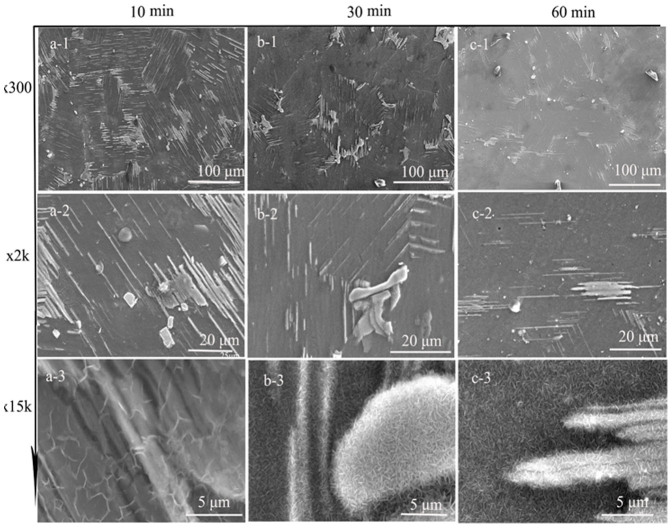
A similar corrosion process is also observed in the MDZ-545 sample. The precipitates become vague when the immersion time is 60 min (Fig. 6). Under higher magnifications (Fig. 6a-3, 6b-3 and 6c-3), a honeycomb configuration film is observed on the entire surface. As the immersion time is extended, the oxidation film becomes more and more compact. Unlike the discontinuous oxide film on surface of the MDZ-C alloy, the corrosion film forms on the surface of both Mg matrix and the 14H-LPSO phase concurrently (Fig. 6a-3).
Figure 6. The initiation and development of the corrosion products formed on the MDZ-545 alloy, (a) after immersion 10 min; (b) 30 min and (c) 60 min.
Cyclic polarization
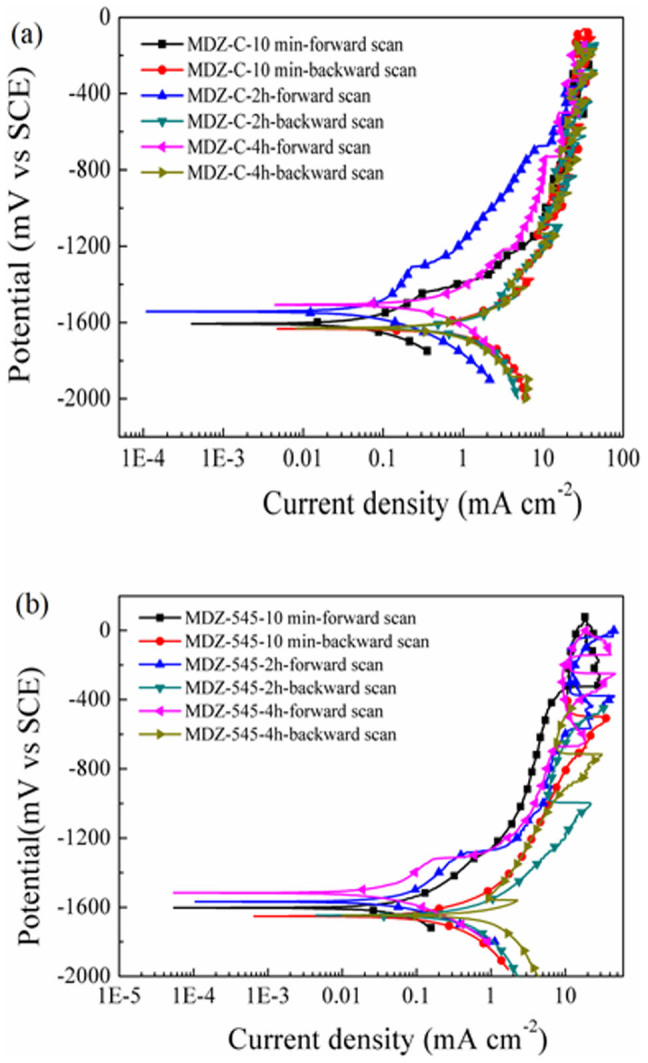
A cyclic polarization scan provides a qualitative view of pitting corrosion mechanism and determines the trend of undergoing surface pitting when a material is placed in a corrosive medium27. It is particularly suitable for Mg alloys containing LPSO phases, in which pitting corrosion occurs frequently. The cyclic polarization curves of the MDZ-C and MDZ-545 alloys after different times were shown in Fig. 7. The polarization curves were used to estimate the corrosion potential (Ecorr), pitting potential (Epp), and corrosion current density (Icorr) by the Tafel extrapolation of the cathodic branches26. The average corrosion rate (ACR, mm y−1) is calculated based on following equation:
 |
Where K is constant that defines the units of the corrosion rate (~3272 mm/A-cm-y).
Figure 7. Cyclic polarization curves of the MDZ-C and MDZ-545 alloys at a scan rate is 2.5 mV/s in 0.9 wt.% NaCl solution after immersing for 10 min, 2 h and 4 h, respectively.
Ew is equivalent weight (~12 g/equivalent).
d is density (~1.7 g/cm3).
The detailed results are summarized in Table 1. Basically, two Ecorr values shift forward positively with increasing immersion time. For the MDZ-C alloy, the EPP shows the same trend as Ecorr. However, a constant EPP of −1303 mV is observed in the MDZ-545 alloy. The Icorr of the MDZ-C alloy is increased with extending immersion time, resulting in a large ACR value (24 mm y−1). However, the opposite trend is achieved in the MDZ-545 alloy. Though the backward scan breaks the oxidation film layer down, the relatively stable Icorr and ACR values are observed. The representative SEM micrographs of the MDZ-C and MDZ-545 alloys after cyclic polarization (10 min) are shown in Fig. 8. In regards to the MDZ-C alloy, a porous band along the grain boundaries is observed, which indicates that the oxidation film is absolutely broken down during the EIS testing (also confirmed in Fig. 10). Conversely, only some isolated pitting spots are detected in the MDZ-545 alloy after cyclic polarization test.
Table 1. Electrochemical parameters of the samples derived from polarization tests in 0.9 wt.% NaCl.
| Sample | Immersed time | Ecorr (mV) | Icorr (mA cm−2) | EPP (mV) | ACR(mm y−1) |
|---|---|---|---|---|---|
| MDZ-C | 10 min | −1600 | 0.1011 | −1453 | 2.3344 |
| 2 h | −1546 | 0.1308 | −1310 | 3.0202 | |
| 4 h | −1507 | 1.0421 | −1213 | 24.062 | |
| MDZ-545 | 10 min | −1605 | 0.0951 | −1303 | 2.1951 |
| 2 h | −1571 | 0.0862 | −1303 | 1.9904 | |
| 4 h | −1516 | 0.0461 | −1303 | 1.0645 |
Figure 8. The surface pitting morphologies after cyclic polarization test (10 min), (a) the MDZ-C alloy; (b) the MDZ-545 alloy.
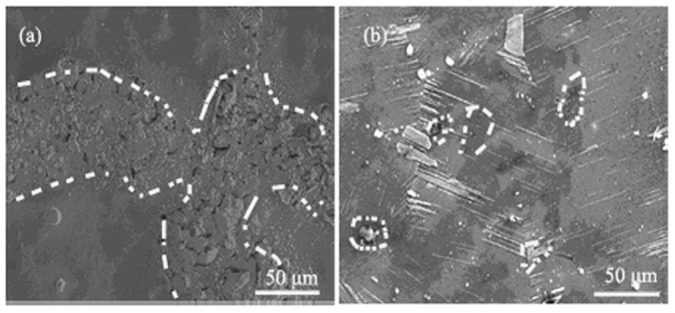
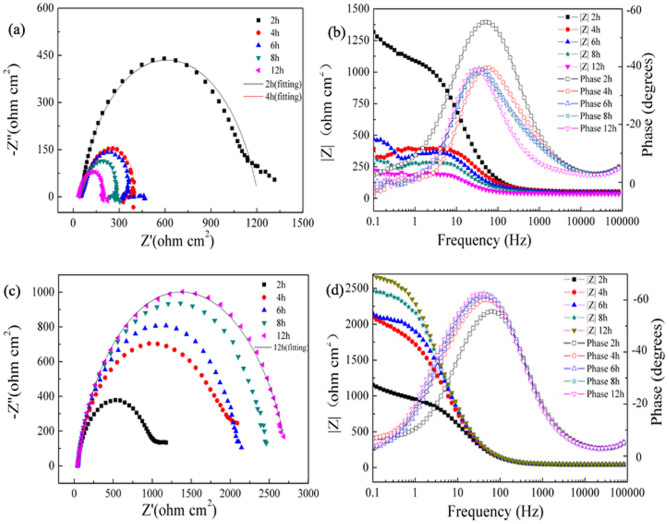
Figure 9. Impedance plots of alloys immersed in 0.9 wt.% NaCl solution for different immersion times, (a) Nyquist diagram of the MDZ-C sample; (b) Bode plots of the MDZ-C sample; (c) Nyquist diagram of the MDZ-545 sample; (d) Bode plots of the MDZ-545 sample.
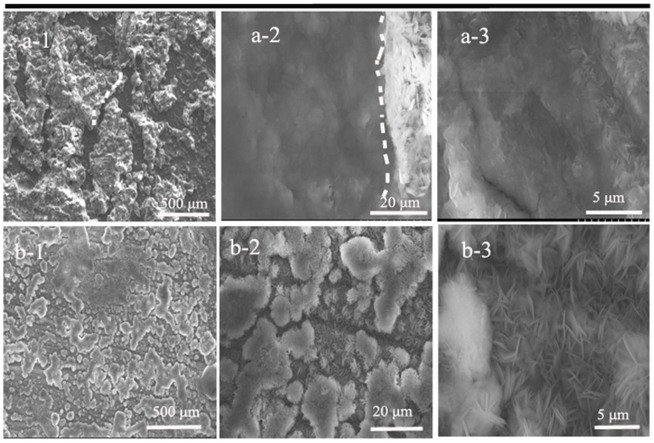
Figure 10. SEM micrographs of the MDZ-C (a-1, a-2 and a-3) and MDZ-545 (b-1, b-2 and b-3) samples after EIS test.
EIS measurement
Fig. 9a shows the Nyquist spots, measured at corrosion potential, on the MDZ-C alloy immersed in 0.9 wt.% NaCl aqueous solutions for different times. All EIS diagrams exhibit the same configurations. The Bode spots (Fig. 9b) demonstrates that the sample presents a high frequency resistive behavior followed by a high/medium (100–10 Hz) capacitive response. Additionally, a distorted inductance loop is observed at medium/low frequencies (~1–0.1 Hz). The diameter of capacitive loop is reduced as the immersion time is increased. By comparison, it is seen from the Nyquist spots (Fig. 9c) of the MDZ-545 alloy that the EIS curves of 1 h and 4 h are composed of two loops and the other curves contain merely a loop. In contrast to the MDZ-C samples, two different characteristics are observed, wherein the diameter of capacitive loop is increased with increasing immersing time and the inductance loop is hardly detected.
The SEM graphs after EIS tests are shown in Fig. 10, where it reveals that both oxidation films are ruptured during the EIS test (Fig. 10a-1 and 10b-1). However, under high magnifications of the MDZ-C (Fig. 10a-2 and 10a-3), the naked microstructure is identified in the bottom of cracks. Conversely, a new honeycomb oxidation film is observed in the MDZ-545 sample, suggesting that the ability to form an oxidation film of the MDZ-545 alloy is stronger than that of the MDZ-C one after the rupture of oxidation film.
Corrosion products
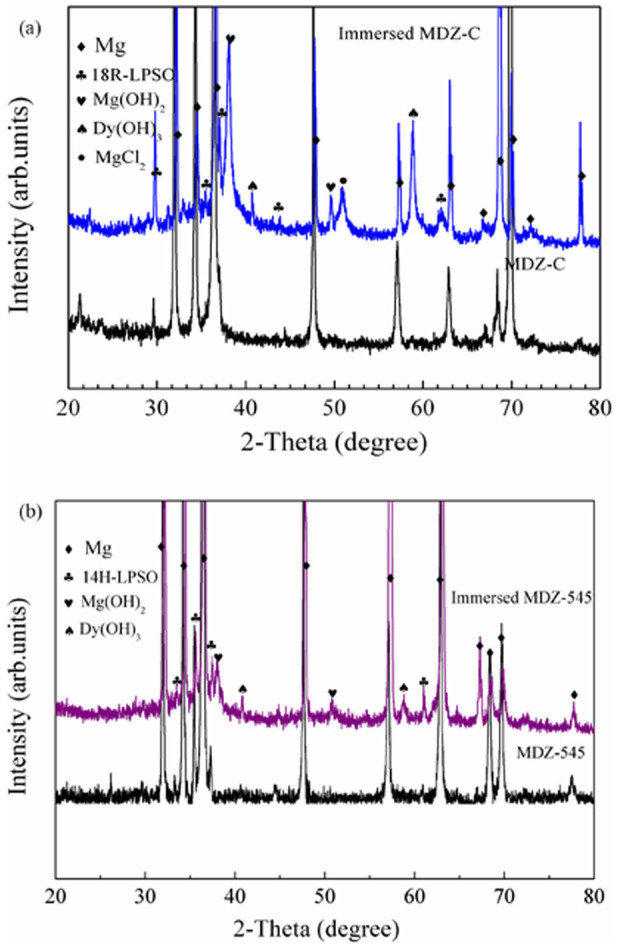
The XRD results (Fig. 11a) reveal that the phases in the un-immersed MDZ-C alloys contain Mg matrix and 18R-LPSO phase, which is consistent with the above SEM and TEM results. The low volume fraction and limitation of XRD technique is responsible for the absence of eutectic phase. Some new peaks are observed, which are well assigned to the following crystalline phase: Mg(OH)2, Dy(OH)3 and MgCl2 compounds. In the MDZ-545 alloy (Fig. 11b), the peaks are identified as Mg matrix and 14H-LPSO phase, which are present in both the un-immersed sample and in the one immersed for 12 h. Nevertheless, compared with the MDZ-C sample, the MgCl2 peaks are hardly detected in the MDZ-545 sample, while Mg(OH)2 and Dy(OH)3 compounds are still detectable.
Figure 11. XRD patterns of alloys before and after 12 h of immersion in 0.9 wt.% NaCl solution, (a) MDZ-C; (b) MDZ-545.
Discussion
In present study, the precipitates are mostly distributed in grain boundaries in the MDZ-C alloy, which is composed of α-Mg and 18R-LPSO phase. 18R-LPSO phase dissolves gradually and 14H-LPSO phase generates when it is solid-solution heat treated at 545°C. Both morphology and distribution of 14H-LPSO phase are different from those of 18R-LPSO phase. The width of 14H-LPSO phase is reduced and it is mainly distributed inside grains. These occurrences are confirmed by DSC result, together with the SEM and TEM results. It is believed that the 18R-type structure is not thermodynamically stable at/above 500°C. It is because that it contains four α-Mg atomic fault layers which provide a simple transitional pathway to form 14H-type LPSO13, which is consistent with the thermal calculations of LPSO phase transformations7.
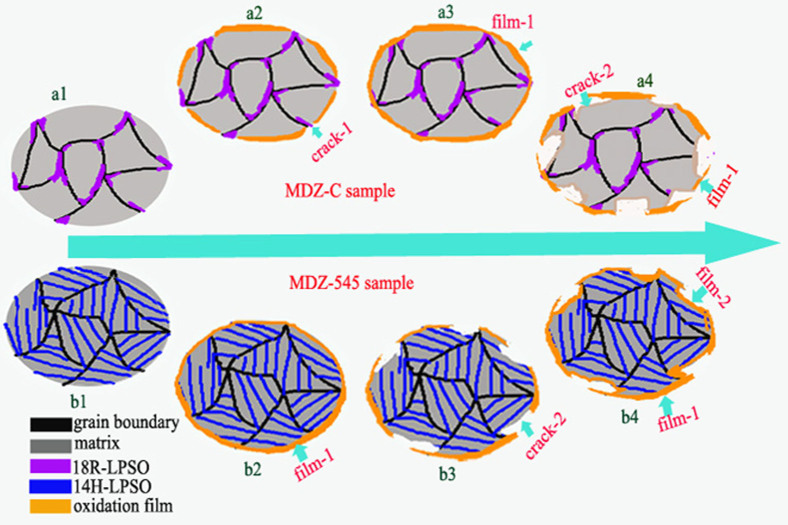
According to the above SEM and EIS results, it can be confirmed that the corrosion mechanisms are different between the MDZ-C (18R-LPSO) and MDZ-545 (14H-LPSO) alloys. Specifically, the detailed schematic diagrams for corrosion process explanation were presented in Fig. 12. In contrast to the MDZ-C (18R-LPSO) alloy, the MDZ-545 (14H-LPSO) one possesses lower corrosion rate. There are two main factors responsible for the decrease of corrosion rate. On the one hand, different from the MDZ-C sample, it is facile to form a homogeneous and compact oxidation film at the initial corrosion stage in the MDZ-545 one (Fig. 5 and Fig. 6), which is ascribed to different forming sequences of oxidation films. For the MDZ-C alloy, the oxide film generates on the surface of Mg matrix first and then expands toward the secondary phase. Thus, the thickness of film is different, which results in tensile stress27. With increasing the immersion time, the tensile stress is increased, resulting in the rupture of the oxidation film containing corrosion products in the interface between 18R-LPSO phase and Mg matrix. As a result, the formed cracks provide channels for the corrosive solution to penetrate through and reach the fresh surface, as well as for hydrogen to release. Consequently, the corrosion process occurs sequentially. This explanation is consistent with the OCP results that the MDZ-C alloy takes longer time to reaching balance potential and its potential fluctuates significantly due to the rupture of oxidation film.
Figure 12. The detailed schematic diagrams of corrosion process, a1-a4 graphs correspond to the MDZ-C alloy; b1-b4 graphs correspond to the MDZ-545 alloy.
It reveals that both rapid form film ability and remediation ability are two important reasons in enhancing the corrosion properties.
On the other hand, the oxidation film remediation ability also plays an important role in corrosion properties. It is well-known that the oxide film on the surface of Mg alloys is not compact, and then the solution can penetrate through the oxidation layer. Taking into account the release of hydrogen during corrosion process, the oxidation film will be broken down with extending immersion time. This is the reason for the continuous decomposition of Mg alloys25,28. Therefore, in view of the formation fresh surface, the oxidation film remediation ability is crucial to determine corrosion rate. Based on EIS results (Fig. 9), the capacitive resistance is reduced with increasing immersion test in the MDZ-C alloy, while it is enhanced in the MDZ-545 one monotonously. The main reason lies in the different oxidation film remediation ability (Fig. 10). After EIS testing, the pristine oxidation film is broken down and the oxidation film remediation occurs immediately in the MDZ-545 alloy (Fig. 10d -10f). A new compact oxidation film forms in the cracks, which effectively prohibits the contact between solution media and the matrix. It is consistent with the immersion test, where MDZ-C takes more time (Fig. 5d) to form a complete oxidation film. This strategy of improving corrosion properties by formation of separated layer was employed in Mg-Al alloy by Song et.al.28,29.
Theoretically, the surface film on Mg alloys is mainly composed of aqueous solution magnesium oxide or magnesium hydroxide. The corrosion reactions in neutral aqueous media are presented by the following equations30,31,32,33.
 |
 |
 |
 |
However, the following reaction possibly occurs when the environment contains chloride ion:
 |
According to corrosion products, it can be confirmed that equation 5 is more facile to proceed in the MDZ-C alloy than in the MDZ-545 one. Chloride ions are very aggressive to magnesium. Chloride ions in the interface transform Mg(OH)2 to easily soluble MgCl2. As a result, the thermodynamical equilibrium (equation 3) is readily broken down due to the existence of chloride ions, which deteriorates the corrosion properties of the alloys5. This corrosion explanation agrees well with the current opinion that the corrosion resistance of Mg alloys is determined by a partially protective surface film where the corrosion reaction occurs principally at the breaks of the film. These results are also consistent with the tendency of chloride ion causing film breakdown, which accelerates the corrosion of Mg alloy34. However, the direct evidence that the chloride ion is easier to be absorbed on the surface of alloy containing 18R-LPSO phase is not demonstrated in this work and further research works are necessary to clarify their discrepancies.
In summary, the as-cast Mg-2Dy-0.5Zn alloy mostly contains a coarse 18R-type LPSO phase along the grain boundaries in addition to eutectic phase and Mg matrix. The elimination of a 18R-type LPSO phase and the formation of a 14H-type LPSO phase in the grain interior occur simultaneously at 545°C. Compared with the alloy containing 14H-LPSO phase, it is prone to form some cracks in the interfaces between 18R-LPSO and Mg matrix at the beginning of corrosion, which is mostly related to the inhomogeneous distribution of tensile stress. In addition, as degradation process is preceded, both surface oxidation films are broken down. However, in contrast to as-cast alloy containing 18R-LPSO phase, the alloy with 14H-LPSO phase exhibits rapider oxidation film remediation ability, which effectively inhibits the contact between solution and the matrix.
Methods
Sample preparation
A normal composition Mg-2Dy-0.5Zn (at.%) alloy has been prepared by chill casting technology. The alloy had been prepared in a tantalum-crucible under a cover gas mixture of CO2 and SF6. After mixing at 720°C for 1 h, the alloy was cast to the mould preheated at 600°C. The filled mould was held at 670 °C for 1 h under the protective gas. Then, the whole tantalum crucible with the melting alloy was immersed to the flowing water at 600 ml/s. When the bottom of tantalum crucible touched the water, it stopped for 2 second. As soon as the liquid level of the inside melt was in alignment with the height of outside water, the solidification process was finished. The diameter and length of the ingot were 70 mm and 80 mm, respectively. The chemical composition of Mg-1.91Dy-0.32Zn (indexed as MDZ-C) was measured by X-ray fluorescence spectroscopy. The element composition was lower than the nominal composition owing to the element burning loss. Moreover, the total content of main impurities (Cu, Fe and Ni) is lower than 0.015 wt.%.
Microstructure and phase identification
The microstructural investigations were performed using scanning electron microscopy with afield emission gun (SEM-FEG, JEOL JSM-7001F). The standard metallographic procedures were applied, including grinding, polishing and etching. The samples were etched in a picral solution to reveal grain boundaries. The elemental concentration in the matrix and phases were investigated by SEM equipped with energy dispersive X-ray analysis (EDX) (INCA from Oxford). The average values were obtained based on at least five random spots.
Calorimetric response of the as-cast alloy was measured using differential scanning calorimetry (DSC, STA449C). A heating rate of 6°C/min was employed under argon purge at 35 ml/min. The phases have been identified by transmission electron microscopy (TEM, JEM-2010). Thin foil samples for the TEM observation were prepared using an Ion Polishing System (RES101).
Electrochemical test
Electrochemical behaviors were tested using a potentiostat/frequency response analysis system (Bio-logic, VSP). Experiments were carried out in a three-electrode electrochemical cell, in which a saturated calomel electrode (SCE) as the reference electrode, a platinum mesh as counter electrode and the specimen under investigation as the working electrode. The experiments were carried out in 0.9 wt.% NaCl aqueous solutions. In order to reduce the fluctuation of pH, the ratio of solution to surface is 80 ml to 1 mm2. During the whole test, the trays were placed in an incubator. The temperature in the incubator was maintained at 25°C. Open circuit potential (OCP) measurements were made between the working electrode and the reference electrode without current being passed to the counter electrodes. This measurement showed the potential at which the anodic and cathodic reaction currents at the working electrode/solution interface were balanced. The OCP tests were begun immediately after the specimen was immersed in the solution and were measured for 6 h duration.
The cyclic polarizations were performed after immersing for 10 min, 2 h and 4 h. The forward scanned polarization curves started from a cathodic potential of −1800 mV, where the surfaces of the alloys were not yet corroded, and extended to the vertex potential of −50 mV. The forward scan was followed by a reverse scan back to the final potential −1950 mV. The scan rate was 2.5 mV/s, the step height was 1 mV. The surface morphology after cyclic polarization test after immersing for 10 min was dried and observed by SEM immediately.
The electrochemical impedance spectroscope (EIS) was carried out at open potential with an applied signal of 10 mV rms. The scanning frequency ranged from 100 kHz down to 0.1 Hz. The samples were immersed in 0.9 wt.% NaCl solutions for different times, viz. 2 h, 4 h, 6 h, 8 h and 12 h, to investigate the corrosion process. After EIS tests, the MDZ-C and MDZ-545 samples were dried and observed by SEM immediately.
Immersion test and product analysis
The immersion tests were to investigate the corrosion mechanism and to reveal the development and growth of corrosion products of MDZ alloys in NaCl aqueous solutions. To this purpose, three cylinder (Ø10×5) specimens containing 18R-LPSO or 14H LPSO phases were immersion in NaCl aqueous solutions at different times viz. 10 min, 20 min, 60 min and 120 min. They were cleaned by rinsing with pure water, and then rinsed by ethanol and dried in air prior to SEM-FEG observation.
The phase composition of corrosion products on the samples immersed up to 12 h in the test solutions were confirmed by x-ray electron diffraction directly (XRD, Rigaku). The XRD analysis was performed by scanning from 20° to 80° with a step size of 0.02° with CuKα radiation. The filament current and acceleration voltage were 30 mA and 40 kV, respectively.
Author Contributions
Q.P. designed the experiments and contributed to the experimental analysis and interpretation of data, and wrote the manuscript. J.G. contributed to the experiments and analysis. X.C. contributed to the experiments and analysis. Y.W. contributed to the experiments and analysis. B.L. contributed to the interpretation of the experimental data and contributed to the writing of the manuscript. Z.X. contributed to the interpretation of the experimental data and contributed to the writing of the manuscript. All authors reviewed the manuscript.
Acknowledgments
This research is supported by NSFC (51101142, 50821001 and 51102206), New Century Excellent Talents in University of Ministry of Education of China (NCET-12-0690), Science Foundation for the Excellent Youth Scholars of Hebei Province (Y2012019) and Science Supporting Project of Hebei Province (13961002D).
References
- Staiger M. P., Pietak A. M., Huadmai J. & Dias G. Magnesium and its alloys as orthopedic biomaterials: A review. Biomaterials. 27, 1728–1734 (2006). [DOI] [PubMed] [Google Scholar]
- Serre C. M., Papillard M., Chavassieux P. & Boivin G. In vitro induction of a calcifying matrix by biomaterials constituted of collagen and/or hydroxyapatite: an ultrastructural comparison of three types of biomaterials. Biomaterials. 14, 97–106 (1993). [DOI] [PubMed] [Google Scholar]
- Janning C. et al. Magnesium hydroxide temporarily enhancing osteoblast activity and decreasing the osteoclast number in peri-implant bone remodelling. Acta Biomater. 6, 1861–1868 (2010). [DOI] [PubMed] [Google Scholar]
- Zberg B., Uggowitzer P. J. & Löffler J. F. MgZnCa glasses without clinically observable hydrogen evolution for biodegradable implants. Nature Mater. 8, 887–891 (2009). [DOI] [PubMed] [Google Scholar]
- Yamasaki M., Hayashi N., Izumi S. & Kawamura Y. Corrosion behavior of rapidly solidified Mg-Zn-RE element alloys in NaCl solution. Corr. Sci. 49, 255–262 (2007). [Google Scholar]
- Yokobayashi H. et al. Enrichment of Gd and Al atoms in the quadruple close packed planes and their in-plane long-range ordering in the long period stacking-ordered phase in the Mg-Al-Gd system. Acta Mater. 59, 7287–7299 (2011). [Google Scholar]
- Zhu Y. M., Morton A. J. & Nie J. F. The 18R and 14H long-period stacking ordered structures in Mg-Y-Zn alloys. Acta Mater. 58, 2936–2947 (2010). [Google Scholar]
- Suzuki M., Kimura T., Koike J. & Maruyama K. Strengthening effect of Zn in heat resistant Mg-Y-Zn solid solution alloys. Scr. Mater. 48, 997–1002 (2003). [Google Scholar]
- Kentaro Y. et al. Alloy development of high toughness Mg-Gd-Y-Zn-Zr alloys. Mater. Trans. 47, 1066–1070 (2006). [Google Scholar]
- Garcés G. et al. Effect of microstructure on creep behavior of cast Mg97Y2Zn1 (at.%) alloy. Mater. Sci. Eng. A 539, 48–55 (2012). [Google Scholar]
- Zhang J. et al. Research on long-period-stacking-ordered phase in Mg-Zn-Y-Zr alloy. J. Alloys Compd. 558, 195–202 (2013). [Google Scholar]
- Shao X. H., Yang Z. Q. & Ma X. L. Strengthening and toughening mechanisms in Mg-Y-Zn alloy with a long period stacking ordered structure. Acta Mater. 58, 4760–4771 (2010). [Google Scholar]
- Zhu Y. M., Morton A. J. & Nie J. F. Growth and transformation mechanisms of 18R and 14H in Mg-Y-Zn alloys. Acta Mater. 60, 6562–6572 (2012). [Google Scholar]
- Tong L. B., Li X. H. & Zhang H. J. Effect of long period stacking ordered phase on the microstructure, texture and mechanical properties of extruded Mg-Y-Zn alloy. Mater. Sci. Eng. A 563, 177–183 (2013). [Google Scholar]
- Ambat R., Aung N. N. & Zhou W. Evaluation of microstructural effects on corrosion behaviour of AZ91D magnesium alloy. Corr. Sci. 42, 1433–1455 (2000). [Google Scholar]
- Zhang X. et al. Biocorrosion behavior and cytotoxicity of a Mg-Zn-Y alloy with long period stacking ordered structure. Mater. Lett. 86, 42–45 (2012). [Google Scholar]
- Zhao X., Shi L. I. & Xu J. Mg-Zn-Y alloys with long-period stacking ordered structure: In vitro assessments of biodegradation behavior. Mater. Sci. Eng. C. 33, 3627–3637 (2013). [DOI] [PubMed] [Google Scholar]
- Izumi S., Yamasaki M. & Kawamura Y. Relation between corrosion behavior and microstructure of Mg-Zn-Y alloys prepared by rapid solidification at various cooling rates. Corr. Sci. 51, 395–402 (2009). [Google Scholar]
- Yin D. D. et al. Effects of heat treatments on microstructure and mechanical properties of Mg-11Y-5Gd-2Zn-0.5Zr (wt.%) alloy. J. Alloys Compd. 509, 1696–1704 (2011). [Google Scholar]
- Avedesian M. M. & Baker H. ASM Specialty Handbook: Magnesium and Magnesium Alloys. Materials Park, OH: ASM International, 1999.
- Bi G. et al. An elevated temperature Mg-Dy-Zn alloy with long period stacking ordered phase by extrusion. Mater. Sci. Eng. A. 528, 3609–3614 (2011). [Google Scholar]
- Abe E., Kawamura Y., Hayashi K. & Inoue A. Long-period ordered structure in a high-strength nanocrystalline Mg-1at%Zn-2at%Y alloy studied by atomic-resolution Z-contrast STEM. Acta Mater. 50, 3845–3857 (2002). [Google Scholar]
- Hagihara K., Yokotani N. & Umakoshi Y. Plastic deformation behavior of Mg12YZn with 18R long-period stacking ordered structure. Intermetallics. 18, 267–276 (2010). [Google Scholar]
- Atrens A. et al. Stress corrosion cracking and hydrogen diffusion in magnesium. Adv. Eng. Mater. 8, 749–751 (2006). [Google Scholar]
- Song G. & Atrens A. Understanding magnesium corrosion - a framework for improved alloy performance. Adv. Eng. Mater. 5, 837–858 (2003). [Google Scholar]
- Song G. et al. The electrochemical corrosion of pure magnesium in 1 N NaCl. Corr. Sci. 39, 855–875 (1997). [Google Scholar]
- Guo X. et al. Investigation of corrosion behaviors of Mg-6Gd-3Y-0.4Zr alloy in NaCl aqueous solutions. Electrochim. Acta. 52, 2570–2579 (2007). [Google Scholar]
- Song G. & StJohn D. H. Corrosion of magnesium alloys in commercial engine coolants. Mater. Corr. 56, 15–23 (2005). [Google Scholar]
- Song Y. L. et al. Effect of cerium addition on microstructure and corrosion resistance of die cast AZ91 magnesium alloy. Mater. Corr. 58, 189–192 (2007). [Google Scholar]
- Liu M. et al. The influence of yttrium (Y) on the corrosion of Mg-Y binary alloys. Corr. Sci. 52, 3687–3701 (2010). [Google Scholar]
- Pardo A. et al. Corrosion behaviour of magnesium/aluminium alloys in 3.5wt.% NaCl. Corr. Sci. 50, 823–834 (2008). [Google Scholar]
- Sudholz A. D. et al. Electrochemical behaviour and corrosion of Mg-Y alloys. Corr. Sci. 53, 2277–2282 (2011). [Google Scholar]
- Zhao M. C., Liu M., Song G. L. & Atrens A. Influence of pH and chloride ion concentration on the corrosion of Mg alloy ZE41. Corr. Sci. 50, 3168–3178 (2008). [Google Scholar]
- Dhanapal A., Rajendra S. & Balasubramanian V. Influence of pH value, chloride ion concentration and immersion time on corrosion rate of friction stir welded AZ61A magnesium alloy weldments. J. Alloys Compd. 523, 49–60 (2012). [Google Scholar]


