Summary
Background
Stage 2 Meaningful Use criteria require the use of clinical decision support systems (CDSS) on high priority health conditions to improve clinical quality measures. Although CDSS hold great promise, implementation has been fraught with challenges, evidence of their impact is mixed, and the optimal method of content delivery is unknown.
Objective
The authors investigated whether implementation of a simple clinical decision support (CDS) tool was associated with improved prescriber adherence to national medication-laboratory monitoring guidelines for safety (hepatic function, renal function, myalgias/rhabdomyolysis) and intermediate outcomes for antidiabetic (Hemoglobin A1c; HbA1c) and antihyperlipidemic (low density lipoprotein; LDL) medications prescribed within a diabetes registry.
Methods
This was a retrospective observational study conducted in three phases of CDS implementation (2008–2009): pre-, transition-, and post-Prescriptions evaluated were ordered from an electronic health record within a multispecialty medical group. Adherence was evaluated within and without applying guideline-imposed time constraints.
Results
Forty-thousand prescriptions were ordered over three timeframes. For hepatic and renal function, the proportion of prescriptions for which labs were monitored at any time increased from 52% to 65% (p<0.001); those that met time guidelines, from 14% to 21% (p<0.001). Only 6% of required labs were drawn to monitor for myalgias/rhabdomyolysis, regardless of timeframe. Over 90% of safety labs were within normal limits. The proportion of labs monitored at any time for LDL increased from 56% to 64% (p<0.001); those that met time guidelines from 11% to 17% (p<0.001). The proportion of labs monitored at any time for HbA1c remained the same (72%); those that met time guidelines decreased from 45% to 41% (p<0.001).
Conclusion
A simple CDS tool may be associated with improved adherence to guidelines. Efforts are needed to confirm findings and improve the timeliness of monitoring; investigations to optimize alerts should be ongoing.
Key words: Adherence to guidelines, clinical decision support, clinical guidelines, meaningful use, medication laboratory test monitoring
1. Introduction
The Health Information Technology for Economic and Clinical Health section of the American Recovery and Reinvestment Act of 2009 set the stage for national adoption of electronic health records (EHRs) by providing incentives to promote Meaningful Use [1]. Stage 1 Meaningful Use criteria include both mandates and options to improve care. Among these are to implement one clinical decision support (CDS) intervention and track compliance, report ambulatory quality measures to the Centers for Medicare and Medicaid Services, incorporate clinical laboratory test results into EHRs as structured data, and report hemoglobin A1c (HbA1c) and low density lipoprotein (LDL) control for diabetic patients [2]. Stage 2 criteria require five CDS interventions related to four or more clinical quality measures at a relevant point in patient care, and state that these CDS systems (CDSS) must be used to improve performance for high priority health conditions [3,4].
CDSS are electronic systems in which patient characteristics are used to generate clinical recommendations, which are then considered by clinicians. Examples include reminders, order sets, and dashboards. The goal of CDSS is to improve quality of care [5]. Although CDSS hold great promise, evidence of their effectiveness is mixed [6,7]. Implementation has been fraught with challenges, largely due to variability in maturity of available software [8,9,10], lack of interoperability across sites [9], and interruptions in clinician workflow [5,9,11,12]. Indiscriminate use has led to ‘alert fatigue’ among some prescribers who view most alerts as irrelevant [5,13,14].
Despite evidence that suggests CDSS can improve process measures and practitioner performance [15], evidence of their impact on clinical outcomes is minimal, and evidence supporting their widespread use is lacking. One area of inquiry is how CDSS content can be delivered most effectively – whether interruptive (e.g. pop-up reminders) or non-interruptive (e.g. order sets) are preferred. A summary of recent CDS Demonstration Projects sponsored by the Agency for Healthcare Research and Quality (AHRQ) suggests the knowledge base for developing CDSS can be strengthened by use of clinical guidelines for single conditions, and by evaluations of the effectiveness of these interventions on clinician performance and outcomes [5]. AHRQ has called for both randomized and quasi-experimental studies [5,16].
To address these challenges, this manuscript describes the efforts of one multidisciplinary medical group to implement a simple, non-interruptive CDS tool, and to investigate the association between use of the tool and prescriber adherence to national medication-laboratory test monitoring (med-lab) guidelines for safety and intermediate outcomes for antidiabetic and antihyperlipidemic medications prescribed for patients in their diabetes registry. The secondary objective was to investigate whether implementation was associated with a change in incident adverse drug events (ADEs).
2. Methods
2.1. Setting
The Everett Clinic (TEC) is the largest independent medical group in Washington State. Based in the North Puget Sound, TEC is comprised of over 400 primary and specialty care providers who provide care for 300,000 patients in 16 locations, and write 2.7 million prescriptions annually. For twelve years (1995–2007) TEC deployed a homegrown EHR, including a basic computerized provider order entry (CPOE) system. The current investigation was motivated by our previous work, wherein we found that implementation of this CPOE system was associated with a 70% reduction in adjusted odds of a medication error [odds ratio (OR): 0.30; 95% confidence interval (CI): 0.23 to 0.40], but that errors due to lack of appropriate med-lab monitoring remained unchanged (OR 0.84; 95% CI: 0.33 to 2.20) [17].
To maximize long-term EHR functionality, in late 2007 TEC transitioned to a vendor-purchased EHR - EPICare’s Ambulatory EMR® [18]. TEC immediately launched EPIC’s CPOE system. In keeping with their successful strategy of iterative implementation of new functionalities [19], TEC chose stepwise implementation of EPIC’s CDS features, initially launching EPIC’s ‘Dot Phrase’ (‘Smart Phrase’) functionality, in the context of medication ordering. No other EPIC features were implemented during the time of the study. Rather, TEC leadership made the conscious decision to delay other initiatives until users became accustomed to using the new EHR with the Dot Phrase enhancement.
EPIC’s Dot Phrase feature facilitates providers’ rapid and efficient retrieval of information stored in the EHR by simply typing a few characters from within a relevant screen. Dot Phrases may be programmed to retrieve many types of information, including, for example, a patient’s past medical history, vital signs, or current medication list. The Dot Phrase is invoked by the clinician; in this study, from within the CPOE screen. TEC first customized Dot Phrases (herein after called the CDS tool) to improve med-lab monitoring in the context of the 200 most frequently prescribed medications. Antidiabetic (e.g. ‘.metformin’) and antihyperlipidemic (e.g. ‘.simvastatin’) medications were the prototypes. Each Dot Phrase calls for the dates and results of previously reported laboratory (lab) tests required to monitor medication safety or intermediate outcomes for chronic disease management. The call also returns the date and location of the last visit, whether the patient was seen within the past year, and whether any lab work is due.
2.2. Study Design
We conducted a retrospective observational study of patients in TEC’s diabetic registry. The-dataset consisted of EHR-derived prescriptions and lab test results for antidiabetic and antihyperlipidemic medications ordered during three phases of Dot Phrase implementation. All dosage forms of all branded and generic drugs were included, and standardized to generic drug names. Prescriptions ordered before implementation (pre; April through July 2008) represented instances when dates of lab tests, but not results, were manually abstracted by medical assistants and given to prescribers in advance of patient visits or when considering refill requests. Prescriptions ordered during implementation (transition; August 2008 through March 2009) represented prescriptions ordered during rollout and education. Prescriptions ordered from April through July 2009 represented stable use (post). Prescriptions ordered during these three timeframes were considered referent prescriptions. To evaluate whether each referent prescription was associated with appropriate med-lab monitoring, we captured results and dates of results of lab tests from April 2006 through July 2011. Evaluating prescription filling/dispensing and patient adherence to medications was not within the scope of the study. The study focused on the provider’s role in prescription and laboratory ordering. As TEC does not record insurance coverage in the EHR, we used visit dates as a proxy for insurance, and ensured that patients included in the dataset had a recorded visit within the 14 months preceding and subsequent to the date of each referent prescription.
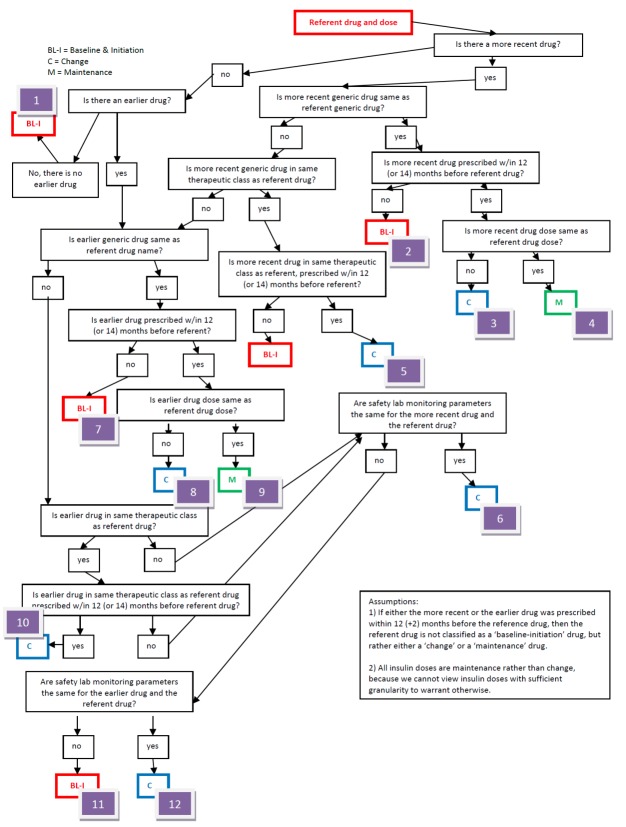
As lab monitoring guidelines are specific to whether a prescription represents a medication that is newly prescribed (baseline-initiation), a change in dose, drug, or therapeutic class (change), or a simple refill (maintenance), we evaluated up to two prescriptions ordered prior to each referent prescription and created twelve rules-algorithms to classify each, accordingly (► Figure 1). If either prior prescription was prescribed within 12 (±2) months preceding the date of the referent prescription, we classified the referent prescription as either a change or maintenance prescription; and used generic drug names and doses to decide between the two categories. Referent prescriptions for which there were no preceding prescriptions were classified as baseline-initiation prescriptions.
Fig. 1.
Rules Algorithms for Classifying Referent Prescriptions
We applied med-lab guidelines in place and approved by TEC’s Pharmacy and Therapeutics Committee. (► Figure 2) Recommendations for lab tests for safety monitoring were based on drug product labeling - tests for hepatic enzymes (aspartate and alanine aminotransferase; AST/ALT), renal function (serum creatinine; SCr), and myalgias or rhabdomyolysis (creatinine kinase; CK). Lab tests for intermediate outcomes were based on national guidelines for HbA1c and LDL control for antidiabetic and antihyperlipidemic medications, respectively [20-22]. During the study time-frame, monitoring guidelines for these two intermediate outcomes remained the same, and TEC did not undertake any initiatives to improve med-lab monitoring separate and apart from the Dot Phrase.
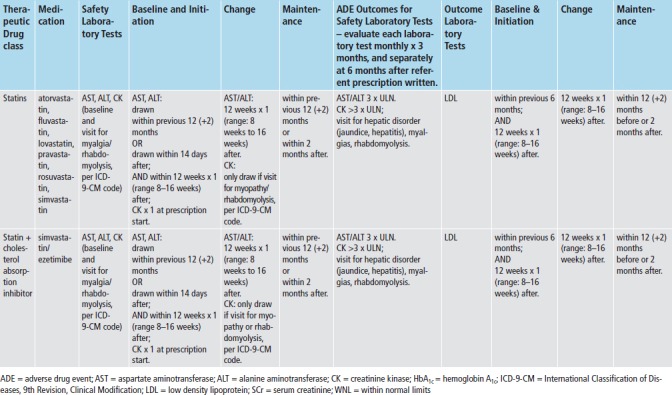
To evaluate each referent prescription for adherence to med-lab guidelines, we applied the appropriate prescription classifier (► Figure 1) and med-lab guideline (► Figure 2), and investigated whether clinicians adhered to guidelines for each referent prescription, both without and with imposing the time constraints for monitoring recommended by the guidelines. We also assessed whether each safety lab was abnormally elevated using TEC normal ranges, and whether each intermediate outcome lab met target goals (► Figure 2). To investigate whether each prescription was associated with an incident ADE, we both investigated whether each lab test was abnormally elevated, and captured International Classification of Diseases, 9th revision-Clinical Modification (ICD-9-CM) coded visits for hepatotoxicity (jaundice, hepatitis), renal disorders, pancreatitis, myalgias and rhabdomyolysis. (► Table 1) Incident was defined as the absence of evidence of either of these prior to the date of the referent prescription.
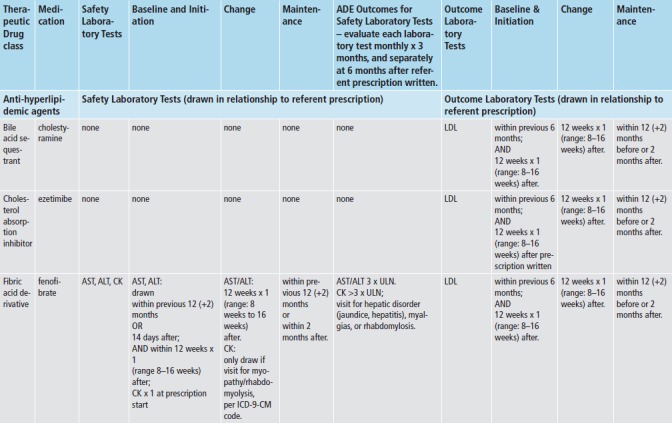
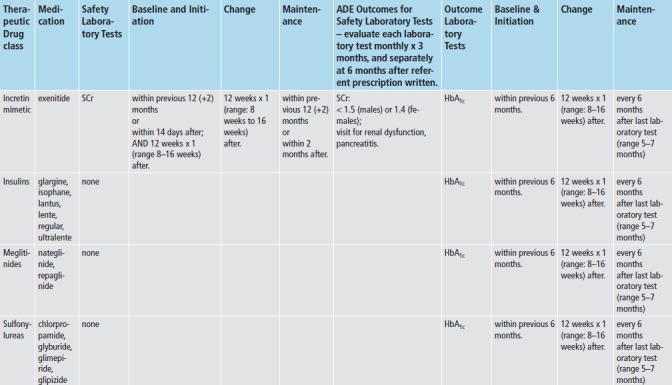
Table 1.
International Classification of Diseases, 9th Revision, Clinical Modification (ICD-9-CM). Codes for Adverse Drug Events associated with Medication-Laboratory Test Monitoring
| ICD-9 Codes for Hepatitis | |
| Hepatitis, fulminant, with hepatic coma | 070.6 |
| Hepatitis, acute (see also Necrosis, liver) | 570 |
| Hepatitis, hypertrophic, acute | 570 |
| Hepatitis, subacute (see also Necrosis, liver) | 570 |
| Hepatitis, chronic, active | 571.49 |
| Hepatitis, chronic, aggressive | 571.49 |
| Hepatitis, fibrous (chronic) | 571.49 |
| Hepatitis, hypertrophic (chronic) | 571.49 |
| Hepatitis, interstitial (chronic) | 571.49 |
| Hepatitis, lupoid | |
| Hepatitis, plasma cell | 571.49 |
| Hepatitis, postnecrotic | 571.49 |
| Hepatitis, recurrent | 571.49 |
| Hepatitis, Waldenstrom’s (lupoid hepatitis) | 571.49 |
| Hepatitis | 573.3 |
| Hepatitis, chemical | 573.3 |
| Hepatitis, diffuse | 573.3 |
| Hepatitis, drug-induced | 573.3 |
| Hepatitis, toxic (noninfectious) | 573.3 |
| ICD-9 Codes for Jaundice | |
| Jaundice, hemorrhagic (acute) | 100.0 |
| Jaundice, hemolytic (acquired) | 283.9 |
| Jaundice, hepatocellular | 573.8 |
| Jaundice, hepatocellular damage | 774.4 |
| ICD-9s for Myalgias | |
| Myalgia (intercostal) | 729.1 |
| ICD-9 for Rhabdomyolysis | |
| Rhabdomyolysis (idiopathic) | 728.88 |
| ICD-9s – for Pancreatitis – for exenitide only | |
| Pancreatitis | 577.0 |
| Pancreatitis, acute (edematous) (hemorrhagic) (recurrent) | 577.0 |
| Pancreatitis, annular | 577.0 |
| Pancreatitis, apoplectic | 577.0 |
| Pancreatitis, calcereous | 577.0 |
| Pancreatitis, gangrenous | 577.0 |
| Pancreatitis, hemorrhagic (acute) | 577.0 |
| Pancreatitis, interstitial, acute | 577.0 |
| Pancreatitis, subacute | 577.0 |
| Pancreatitis, suppurative | 577.0 |
| Pancreatitis, chronic, recurrent | 577.1 |
| Pancreatitis, interstitial (chronic) | 577.1 |
| Pancreatitis, painless | 577.1 |
| Pancreatitis, recurrent | 577.1 |
| Pancreatitis, relapsing | 577.1 |
| ICD-9 for Renal Disease | |
| Disease, diseased, kidney (functional) (pelvis) (see also Disease, renal) | 593.9 |
| Disease, diseased, kidney, chronic | 585.9 |
| requiring chronic dialysis | 585.6 |
| stage | |
| • I | 585.1 |
| • II (mild) | 585.2 |
| • III (moderate) | 585.3 |
| • IV (severe) | 585.4 |
| • V | 585.5 |
| ICD-9 for Renal Disease | |
| Disease, diseased, renal (functional) (pelvis) (see also Disease, kidney) | 593.9 |
| Disease, diseased, renal, with | |
| • edema (see also Nephrosis) | 581.9 |
| • exudative nephritis | 583.89 |
| • lesion of interstitial nephritis | 583.89 |
| • stated generalized cause – see Nephritis | |
| Disease, diseased, renal, acute | 593.9 |
| Disease, diseased, renal, basement membrane NEC | 583.89 |
| • with pulmonary hemorrhage (Goodpasture’s syndrome) | 446.21, 583.81 |
| Disease, diseased, renal, chronic (see also Disease, kidney, chronic) | 585.9 |
| Disease, diseased, renal, diabetic | 250.4, 583.81 |
| • due to secondary diabetes | 249.4, 581.81 |
| Disease, diseased, renal, due to | |
| • amyloidosis | 277.39, 583.81 |
| • diabetes mellitus | 250.4, 583.81 |
| – due to secondary diabetes | 249.4, 581.81 |
| • systemic lupus erythematosis | 710.0, 583.81 |
2.3. Statistical Analysis
The primary hypothesis was that prescriber access to the CDS tool was associated with increased adherence. The prescription was the unit of analysis. We used means and standard deviations, or counts and proportions to characterize prescriber, patient, and prescription characteristics; prescriber adherence to guidelines, and ADEs. Each outcome was binary – whether or not each recommended lab test was drawn for each referent prescription. The predictor of interest was the phase of implementation (pre-, transition-, post-). The pre/post comparison was of primary interest. Two analyses were conducted, the first, to evaluate whether each lab was ordered, regardless of the recommended monitoring timeframe; the second, to evaluate whether each lab was ordered within the recommended monitoring timeframe. Each analysis was stratified by type of lab test.
Comparisons of proportions between pre- and post- phases were made using two-sample tests of proportions. Adjusted comparisons of the effect of the CDS tool on each outcome were made using generalized estimating equations. We specified a binomial outcome and a logit link, clustered on prescriber using an independent correlation structure, and used the Huber-White (Sandwich) estimator to create robust standard errors [23]. We added a dummy variable for each month (2–16; May 2008 through July 2009), which enabled us to control for time trends, rather than simply calculating the mean proportion of prescriptions in each of the three phases. We also added a dummy variable for each clinic (clinics 2 through 9); and controlled for prescriber age and gender. We did not control for seasonality, as the pre- and post- timeframes were the same four months in two sequential years. The secondary objective was exploratory – to investigate whether implementation was associated with a change in incident ADEs. We evaluated this using simple proportions.
To calculate the needed sample size, we estimated a pre-implementation lack of adherence to guidelines of 12%, decreasing to 8% post-implementation. Using a 2-sided alpha of 0.05, 80% power, and an intraclass correlation coefficient of 0.05 to account for clustering at the prescriber level, required evaluation of 10,000 prescriptions in each of the two timeframes. All analyses were conducted in Microsoft Excel® (Redmond, WA) and Stata 12® (College Station, TX). All study activities were approved by the University of Washington Human Subjects Committee under a waiver of consent.
3. Results
► Table 1 provides detail about prescriber, patient, and prescription characteristics. Over 40,000 prescriptions were ordered during the three phases; approximately 10,000 each, during pre- and post-implementation phases, 20,000 during the transition phase. Antidiabetic prescriptions comprised 66% of orders; biguanides, insulin, and sulfonylureas, were the therapeutic classes most frequently prescribed. ‘Statins’ comprised virtually all antihyperlipidemic prescriptions. The majority of prescriptions were ordered by prescribers in family medicine or internal medicine clinics, where the majority of prescribers practiced. Prescriptions were ordered for over 8,600 unique patients, whose average age was 59 years, of whom 53% were male. Each patient logged between 7 and 9 visits in the 14 months prior to the date of the referent prescription; and 8 to 9 visits in the 14 months after.
Approximately 7,000 prescriptions in each of the pre- and post-implementation phases required monitoring for hepatic dysfunction (AST/ALT). The proportion of prescriptions for which labs were drawn at any time increased from 52% to 65% across phases (p<0.001), while the proportion that met time guidelines increased form 14% to 21% (p<0.001). Over 3,000 prescriptions in these same two phases required monitoring for renal dysfunction (SCr); the same trends were seen. A smaller number of prescriptions (2,300–2,600) required monitoring for myalgias/rhabdomyolysis (CK), and a smaller proportion were drawn (6% to 7%), most of these within recommended timeframes. Over 90% of safety labs were within normal limits. (► Table 2; ► Figure 3).
Table 2.
Prescription, Prescriber, and Patient Characteristics, by Phase of CDS Tool Implementation
| Total | Pre-implementation | Transition | Post-implementation | |
|---|---|---|---|---|
| Prescription Order Characteristics | ||||
| Total Prescription orders | 40,835 | 10,047 | 20,199 | 10,589 |
| By Specialty | ||||
| Family Medicine | 18,382 (45%) | 4,541 (45%) | 9,169 (45%) | 4,672 (44%) |
| Internal Medicine | 19,241 (47%) | 4,778 (48%) | 9,413 (47%) | 5,050 (48%) |
| Endocrinology & Nephrology | 2,790 (7%) | 631 (6%) | 1,396 (7%) | 763 (7%) |
| Cardiology | 390 (1%) | 86 (0.9%) | 212 (1%) | 92 (0.9%) |
| Obstetrics & Gynecology | 32 (0.1%) | 11 (0.1%) | 9 (0%) | 12 (0.1%) |
| By Therapeutic Class | ||||
| Antidiabetic | 26,807 (66%) | 6,639 (66%) | 13,192 (65%) | 6,976 (66%) |
| • Biguanides | 12,959 (32%) | 3,214 (32%) | 6,362 (32%) | 3,383 (32%) |
| • Biguanides Combinations | 79 (0.2%) | 20 (0.2%) | 36 (0.2%) | 23 (0.2%) |
| • Insulin | 6,285 (15%) | 1,457 (15%) | 3,173 (16%) | 1,655 (16%) |
| • Insulin Sensitizing Agents | 1,175 (3%) | 298 (3%) | 585 (3%) | 292 (3%) |
| • Sulfonylureas | 6,309 (15%) | 1,650 (16%) | 3,036 (15%) | 1,623 (15%) |
| Antihyperlipidemic | 14,028 (34%) | 3,408 (34%) | 7,007 (35%) | 3,613 (34%) |
| Statins | 13,758 (34%) | 3,336 (33%) | 6,874 (34%) | 3,548 (34%) |
| Statin Combinations | 270 (0.7%) | 72 (0.7%) | 133 (0.7%) | 65 (0.6%) |
| Prescriber Characteristics | ||||
| Number of unique prescribers | 159 | 118 | 138 | 125 |
| • Family Medicine | 86 (54%) | 59 (50%) | 71 (51%) | 65 (52%) |
| • Internal Medicine | 51 (32%) | 42 (36%) | 46 (33%) | 42 (34%) |
| Other | 22 (14%) | 17 (14%) | 21 (16%) | 18 (14%) |
| Mean (SD) number of patients per prescriber | 79 (92) | 45 (45) | 63 (68) | 45 (46) |
| Mean (SD) number of prescription orders per prescriber | 257 (326) | 85 (88) | 146 (167) | 85 (89) |
| Mean number of prescriptions per patient | 3.3 | 1.9 | 2.3 | 1.9 |
| Patient Characteristics | ||||
| Number of unique patients | 8,646 | 4,664 | 6,848 | 4,996 |
| • Mean (SD) Age | 59 (13) | 59 (13) | 59 (13) | 59 (13) |
| • Proportion ≥65 yrs | 2,888 (33%) | 1,614 (35%) | 2,426 (35%) | 1,814 (36%) |
| • Proportion Male | 4,579 (53%) | 2,452 (53%) | 3,647 (53%) | 2,634 (53%) |
| • Mean (SD) number of visits in 14 months prior to date of Prescription | 7.5 (6.4) | 8.1 (6.4) | 8.2 (6.7) | 8.9 (7.2) |
| • Mean (SD) number of visits in 14 months after date of prescription | 8.5 (7.4) | 9.0 (7.4) | 8.9 (7.6) | 9.2 (7.7) |
Fig. 3.
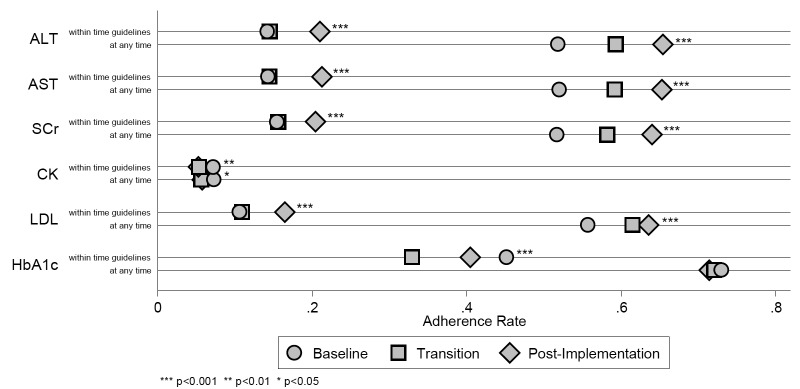
Results – Adherence Rates by Observation Period
Over 3,000 prescriptions in pre- and post- phases required monitoring of LDL. The proportion for which labs were monitored at any time increased from 56% to 64% (p<0.001); those that met time guidelines, from 11% to 17% (p<0.001). The mean LDL value was 100 mg/dL (2.59 mmol/L). Approximately 7,000 prescriptions in each phase required monitoring for HbA1c. The proportion of prescriptions with labs drawn at any time remained the same (73% versus 71%; p = 0.43); those that met time guidelines decreased from 45% to 41%; p<0.001). The mean HbA1c value was 7.8% (0.078 SI units). Trends in adherence for most labs monitored during the transition phase were in between the pre- and post-proportions, with the exception of the proportion of HbA1c labs that met time guidelines, which nadired during the transition phase (► Table 2; ► Figure 3).
For both the transition and post-implementation phases, the adjusted ORs for adherence to the majority of safety labs, and LDL, drawn at any time were statistically significant compared to pre-implementation. Results were similar for labs that met time guidelines (► Table 3). The proportion of prescriptions for which an association with an incident ADE was found was the highest for CK, but was ≤3.1% for all labs and all phases. No inferential statistics were calculated. For AST/ALT, most ADEs were identified by elevated lab values; for CK, almost all ADEs were identified by ICD-9-CM codes (► Table 4).
Table 3.
Results – Prescriptions for which Prescribers were Adherent to Drug-Laboratory Monitoring Guidelines
| Pre-implementation | Transition | Post-implementation | p-value* | |
|---|---|---|---|---|
| Prescriptions with ALT monitoring | 6,940 | 13,990 | 7,311 | |
| • Labs required, but not drawn | 3,343 (48%) | 5,693 (41%) | 2,531 (36%) | |
| • Labs required and drawn (any time) | 3,597 (52%) | 8,297 (59%) | 4,780 (65%) | <0.001 |
| • Labs drawn, not within time guideline | 2,611 (38%) | 6,267 (45%) | 3,243 (44%) | |
| – Within normal limits | 2,493 (96%) | 6,150 (98%) | 3,174 (98%) | |
| • Met time guidelines | 986 (14%) | 2,030 (15%) | 1,537 (21%) | <0.001 |
| – Within normal limits | 978 (99%) | 2,000 (99%) | 1,527 (99%) | |
| Prescriptions with AST monitoring | 6,940 | 13,990 | 7,311 | |
| • Labs required, but not drawn | 3,333 (48%) | 5,715 (41%) | 2,540 (35%) | |
| • Labs required and drawn (any time) | 3,607 (52%) | 8,275 (59%) | 4,771 (65%) | <0.001 |
| • Labs drawn, not within time guideline | 2,615 (38%) | 6,248 (45%) | 3,216 (44%) | |
| – Within normal limits | 2,496 (95%) | 6,128 (98%) | 3,144 (98%) | |
| • Met time guidelines | 992 (14%) | 2,027 (15%) | 1,555 (21%) | <0.001 |
| – Within normal limits | 987 (100%) | 2,010 (99%) | 1,546 (99%) | |
| Prescriptions with SCr monitoring | 3,234 | 6,398 | 3,406 | |
| • Labs required, but not drawn | 1,563 (48%) | 2,676 (42%) | 1,227 (36%) | |
| • Labs required and drawn (any time) | 1,671 (52%) | 3,722 (58%) | 2,179 (64%) | <0.001 |
| • Labs drawn, not within time guideline | 1,172 (36%) | 2,722 (43%) | 1,482 (44%) | |
| – Within normal limits | 1,064 (91%) | 2,569 (94%) | 1,383 (93%) | |
| • Met time guidelines | 499 (15%) | 1,000 (16%) | 697 (21%) | <0.001 |
| – Within normal limits | 452 (91%) | 931 (93%) | 651 (93%) | |
| Prescriptions with CK monitoring | 2,283 | 4,940 | 2,604 | |
| • Labs required, but not drawn | 2,116 (93%) | 4,660 (94%) | 2,453 (94%) | |
| • Labs required and drawn (any time) | 167 (7%) | 280 (6%) | 151 (6%) | 0.032 |
| • Labs drawn, not within time guideline | 2 (0.1%) | 14 (0.3%) | 13 (0.5%) | |
| – Within normal limits | 2 (100%) | 13 (93%) | 12 (92%) | |
| • Met time guidelines | 165 (7%) | 266 (5%) | 138 (5%) | 0.005 |
| – Within normal limits | 161 (98%) | 263 (99%) | 136 (99%) | |
| Prescriptions with LDL monitoring | 3,408 | 7,007 | 3,613 | |
| • Labs required, but not drawn | 1,510 (44%) | 2,701 (39%) | 1,317 (37%) | |
| • Labs required and drawn (any time) | 1,898 (56%) | 4,306 (62%) | 2,296 (64%) | <0.001 |
| • Labs drawn, not within time guideline | 1,536 (45%) | 3,537 (51%) | 1,701 (47%) | |
| – Mean (SD) LDL level (mg/dL; mmol/L) | 97 (33); 2.5 (0.9) | 98 (33); 2.5 (0.9) | 99 (34); 2.6 (0.9) | |
| • Met time guidelines | 362 (10.6%) | 769 (11%) | 595 (17%) | <0.001 |
| – Mean (SD) LDL level (mg/dL; mmol/L) | 103 (34); 2.7 (0.9) | 100.4 (35);2.59 (0.9) | 99 (33); 2.6 (0.9) | |
| Prescriptions with HbA1c monitoring | 6,639 | 13,192 | 6,976 | |
| • Labs required, but not drawn | 1,798 (27%) | 3,691 (28%) | 1,998 (29%) | |
| • Labs required and drawn (any time) | 4,841 (73%) | 9,501 (72%) | 4,978 (71%) | 0.43 |
| Prescriptions with ALT monitoring | 6,940 | 13,990 | 7,311 | |
| • Labs drawn, not within time guideline | 1,842 (28%) | 5,156 (39%) | 2,155 (31%) | |
| – Mean (SD) HbA1c level (%; proportion total Hb) | 7.9 (1.6); 0.08 (0.02) | 7.8 (1.5); 0.08 (0.02) | 7.7 (1.5); 0.08 (0.02) | |
| • Met time guidelines | 2,999 (45%) | 4,345 (33%) | 2,823 (41%) | <0.001 |
| – Mean (SD) Hb1c level (%; proportion total Hb) | 7.7 (1.4); 0.08 (0.01) | 7.7 (1.3); 0.08 (0.01) | 7.6 (1.3); 0.08 (0.01) |
Within normal limits: <3 times upper limit of normal for AST/ALT/CK; SCr <1.5 (males), <1.4 (females); Hb = hemoglobin;
*p-values compare pre-to post-implementation
Table 4.
Adherence to Laboratory Monitoring Guidelines
| Adherent to Laboratory Monitoring Guidelines (any time) | Adherent to Laboratory Monitoring Guidelines (within time guidelines) | |
|---|---|---|
| Odds Ratio (95% CI) | Odds Ratio (95% CI) | |
| Safety Laboratory Tests | ||
| AST | ||
| Transition | 1.59 (1.35, 1.87)*** | 1.19 (0.96, 1.48) |
| post-intervention | 2.29 (1.90, 2.78)*** | 1.46 (1.14, 1.87)** |
| ALT | ||
| Transition | 1.56 (1.32, 1.83)*** | 1.22 (0.99, 1.50) |
| post-intervention | 2.36 (1.95, 2.86)*** | 1.47 (1.15, 1.88)** |
| SCr | ||
| Transition | 1.39 (1.11, 1.74)** | 0.81 (0.63, 1.06) |
| post-intervention | 2.22 (1.75, 2.81)*** | 1.00 (0.77, 1.30) |
| CK | ||
| Transition | 0.35 (0.22, 0.54)*** | 0.32 (0.21, 0.51)*** |
| post-intervention | 0.42 (0.27, 0.66)*** | 0.33 (0.20, 0.55)*** |
| Surrogate Outcome Laboratory Tests | ||
| LDL | ||
| Transition | 1.362 (1.094, 1.697)** | 1.231 (0.892, 1.699) |
| post-intervention | 1.46 (1.151, 1.851)** | 1.779 (1.276, 2.481)** |
| HbA1c | ||
| Transition | 0.927 (0.756, 1.137) | 0.477 (0.401, 0.566)*** |
| post-intervention | 1.07 (0.87, 1.315) | 1.193 (1.007, 1.413)* |
Note. Compared to odds for safety lab monitoring adherence during baseline period (April 1, 2008-August 31, 2008);
* p<0.05;
** p<0.01;
***p<0.001
ALT = Alanine aminotransferase; AST = Aspartate aminotransferase; CK = creatinine kinase; HbA1c = hemoglobin A1c; LDL = low density lipoprotein; SCr = serum creatinine
4. Discussion
Results suggest that implementation of a simple, non-interruptive CDS tool may be associated with improved adherence to med-lab monitoring guidelines for both safety and intermediate outcome labs. For safety labs, post-implementation adherence for AST/ALT and SCr was reasonably high (64–65%) in the analysis that included labs drawn at any time; lower when the criteria for time guidelines were applied (14–21%). A unique pattern was seen for CK. Although CK labs were drawn for only 6–7% of the prescriptions that required them across phases, almost all of these were drawn within timeframes that met the guidelines. Almost all safety labs were within normal limits.
Adherence for the intermediate outcome lab of LDL mirrored that of the safety labs, for labs drawn at any time, and for those drawn within time guidelines. The pattern for HbA1c labs was unique. The proportion of HbA1c labs drawn anytime was consistently between 71–73%, regardless of phase; that adherence was highest for HbA1c suggests that prescribers are appropriately focused on disease management. The notable aberration was for HbA1c labs that met the time guideline, for which there was a decline in adherence during the transition-phase, and then an improvement in the post-phase (45% to 33% to 41%). We attribute the aberration to prescribers becoming accustomed to the new CDS tool. Mean LDL and HbA1c values reflected very good control of disease processes.
The incidence of most ADEs was initially low and remained low throughout all phases. No association was found between CDS implementation and incident ADEs. The incidence of ADEs was highest in the CK group, but still no more than 3.1%. Although we were interested in investigating whether abnormally elevated lab values were associated with ADEs, low numbers precluded this evaluation.
At the time of the study, the EPIC system lacked the functionality to track use of the Dot Phrase. Therefore, our results are not definitive and must be interpreted with caution. Even so, our results are promising and suggest there may be an association between use of the CDS tool and improved adherence to med-lab monitoring guidelines. Our evaluation also suggests there is further room for improvement in adherence to med-lab monitoring guidelines, especially adherence within time-frames specified in national guidelines.
Similarly, there is room for improvement in the CDS alerts intended to improve this adherence. In its simplicity, the EPIC Dot Phrase tool uses structured clinical data to inform decision making. Numerous more sophisticated CDS tools are available. These involve development of statistical algorithms to guide decision making at the point of care. These algorithms often incorporate free text data using natural language processing techniques, or patient-specific phenotypic information along with calendar dates. Using these tools may improve guideline adherence to a greater extent, thereby advancing practitioners along the Meaningful Use continuum from Stage 1, to 2, to 3. However, these algorithms are largely developed by informaticists, statisticians and computer scientists working within health-systems, and may not be available to practitioners in all settings. A simple, non-interruptive CDS tool, such as the Dot Phrase, may be a useful first step on the path to adopting more sophisticated CDSS.
Others have conducted similar work, with mixed results. In the setting of a health maintenance organization, Smith found interruptive safety alerts effective in reducing prescribing and contraindicated medication orders in an elderly population [24]. In contrast, enrolling 22 ambulatory clinics, Lo found that non-interruptive med-lab alerts did not improve recommended baseline lab testing for several medication classes, including antidiabetic medications and statins [25]. Singh investigated follow-up of automatic clinician notification of non-life-threatening, but abnormal outpatient lab test results (including HbA1c), found that 10% were unacknowledged, and that timely follow-up was lacking in 6.8% of alerts [26]. Agrawal evaluated clinician adherence to clinical reminders across multiple ambulatory care practices in an integrated delivery network and found that the adherence rate for all reminders varied significantly, ranging from 29% to 100% [27].
In a study of two federally qualified community health centers, Bundy evaluated the proportion of patients receiving National Committee for Quality Assurance-recommended med-lab monitoring guidelines, and assessed the effect of an EHR-derived, paper-based feedback bulletin on prescriber adherence. He found 42% of patients were overdue for monitoring at some point during the study; and that being listed on the monitoring bulletin doubled the odds of a patient receiving the required monitoring at follow-up. He concluded, however, that multi-modal interventions are likely needed to achieve high rates of adherence [28].
In a systematic review of CDSS to improve med-lab monitoring for ambulatory patients, Fischer found a small but significant improvement in adherence in five of eight studies; studies with lower baseline rates reported greater improvements. He noted studies that found significant results were more likely to have used analytic strategies that addressed clustering and confounding [29]. Recent AHRQ-supported efforts have translated written clinical guidelines for chronic disease care into computable format, and presented these within CDSS in ambulatory settings. These efforts spanned health-systems and types of EHRs. Among other challenges, investigators found written guidelines are ambiguous, unclear, and difficult to translate into computable code [16]. Although a simple Dot Phrase tool may be helpful, evidence to date suggests that further investigation is needed to design CDSS that will optimize adherence to med-lab guidelines.
Our study had several limitations. It was conducted using one registry in one medical group and limited to drugs for two disease states. Results may not be generalizable to other settings, disease states, medications, or guidelines. Because the EPIC system lacked a feature to track use of the Dot Phrase, we were unable to establish a stronger correlation between use of the Dot Phrase feature and improved adherence to guidelines. Lack of tracking features is a common limitation of commercial EHRs, and one that is just now being addressed [30]. Mitigating this limitation is our confidence in the fact that no other initiatives to improve med-lab monitoring were underway during the study timeframe. Finally, although we made several attempts to identify a suitable control group, we were unable to find one due to TEC’s pragmatic implementation schedule.
Our study has several strengths. It investigates a policy issue of national importance – use of a CDS tool to improve adherence to med-lab monitoring guidelines for patients in a chronic disease registry. The EHR evaluated is one of the most widely used in the US; the Dot Phrase, one of its fundamental functionalities. Prescriptions were written by primary care providers, who care for most patients with diabetes. Our longitudinal study design, robust analyses, and adequate statistical power provided ample opportunity to evaluate adherence. Such strengths may broaden interest in our results. In future work, inquiring whether the CDS tool integrated well into prescriber workflow, and evaluating prescriber satisfaction, would provide valuable information and enhance our understanding of the tool’s usefulness.
5. Conclusion
Use of a simple, non-interruptive CDS tool may be associated with improved adherence to med-lab monitoring guidelines, and may be a good first step in implementing CDS alerts. Further investigation is warranted to confirm results and to optimize adherence to med-lab monitoring guidelines.
Clinical Relevance Statement
We investigated whether use of a non-interruptive clinical decision support (CDS) tool was associated with improved prescriber adherence to medication-laboratory monitoring guidelines for safety and intermediate outcome laboratory tests for antidiabetic and antihyperlipidemic medications prescribed for diabetic patients. Our findings suggest that invoking the CDS tool from within the computerized provider order entry screen may be associated with improved adherence to guidelines for test ordering, but infrequently within recommended timeframes. The CDS tool was useful; even so, further investigation is warranted to confirm findings and to optimize adherence to med-lab monitoring guidelines.
Conflict of Interest
All investigators declare they have no conflicts of interest in the research.
Protection of Human Subjects
This study was approved by the University of Washington Institutional Review Board.
Fig. 2a, Fig. 2b.
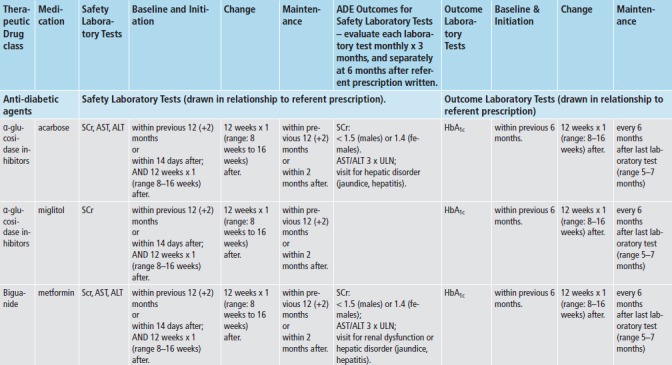
The Everett Clinic’s Clinical Guidelines for Medication-Laboratory Monitoring for Antidiabetic and Antihyperlipidemic Medications
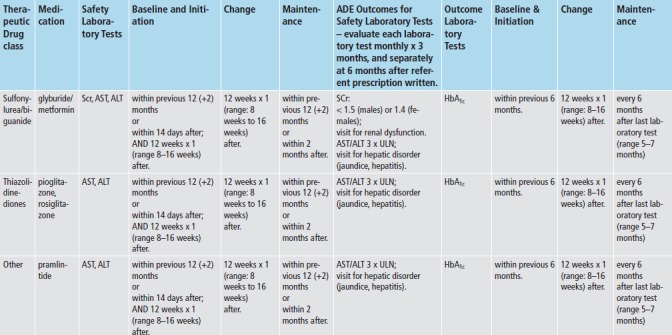
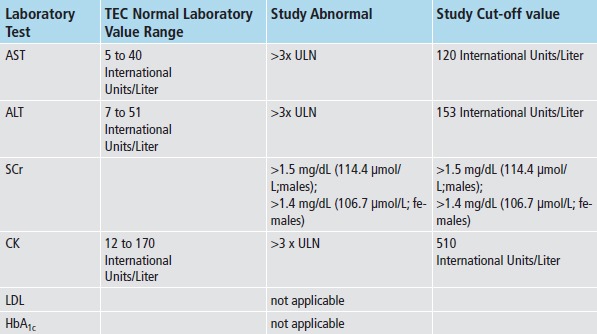
Table 5.
Adverse Drug Events
| Baseline | Transition | Post-Implementation | |
|---|---|---|---|
| AST | 139 (2.0%) | 159 (1.1%) | 94 (1.3%) |
| ALT | 139 (2.0%) | 164 (1.2%) | 93 (1.3%) |
| SCr | 0(0.0%) | 0(0.0%) | 0(0.0%) |
| CK | 71 (3.1%) | 142 (2.9%) | 68 (2.6%) |
ALT = Alanine aminotransferase; AST = Aspartate aminotransferase; CK = creatinine kinase; HbA1c = hemoglobin A1c; ICD-9-CM = International Classification of Diseases, 9th Revision, Clinical Modification; LDL = low density lipoprotein; SCr = serum creatinin
Acknowledgments
This work was supported by AHRQ 5K08 HS014739 (Devine); AHRQ T32 HS013853 (Lau); NIH/NLM T15 LM07442, NIH/NHGRI T15 Hg000035, NIH NCCR, UL1RR025014 (Overby) The authors wish to thank J. Liu and N. Lawless of The Everett Clinic for their assistance in preparing the dataset and in interpreting the results; Colleen Sitlani for providing biostatistical guidance; and the four reviewers for their helpful comments.
References
- 1.American Reinvestment and Recovery Act of 2009, Public Law III-5. [accessed on September 28, 2013]. Available at: http://www.gpo.gov/fdsys/pkg/PLAW-111publ5/pdf/PLAW-111publ5.pdf [Google Scholar]
- 2.Centers for Medicare and Medicaid Services 2012. Meaningful Use. [accessed on September 28, 2013] Available at: http://www.cms.gov/Regulations-and-Guidance/Legislation/EHRIncentivePrograms/Mean ingful_Use.html [Google Scholar]
- 3.Centers for Medicare and Medicaid Services. 2012. Stage 2. [accessed on September 28, 2013] Available at: http://www.cms.gov/Regulations-and-Guidance/Legislation/EHRIncentivePrograms/Stage_2.html [Google Scholar]
- 4.Centers for Medicare and Medicaid Services 2012. Stage 1 versus Stage 2 comparison table for eligible professionals. Last updated: August 2012. [accessed on September 28, 2013] Available at: http://www.cms. gov/Regulations-and-Guidance/Legislation/EHRIncentivePrograms/Downloads/Stage1vsStage2CompTablesforEP.pdf [Google Scholar]
- 5.Lobach D, et al. April 2012. Enabling Health Care Decision making Through Clinical Decision Support and Knowledge Management. Evidence Report No. 203. (Prepared by the Duke Evidence-based Practice Center under Contract No. 290-2007–10066-I.) AHRQ Publication No. 12-E001-EF. Rockville,MD: Agency for Healthcare Research and Quality [Google Scholar]
- 6.Romano MJ, Stafford RS. Electronic health records and clinical decision support systems: Impact on national ambulatory care quality. Archives of Internal Medicine 2011; 171(10): 897–903 [PubMed: 21263077] [DOI] [PMC free article] [PubMed] [Google Scholar]
- 7.Walsh MN, et al. Lack of association between electronic health record systems and improvement in use of evidence-based heart failure therapies in outpatient cardiology practices. Clinical Cardiology 2012; 35(3): 187–196 [PubMed: 22328100] [DOI] [PMC free article] [PubMed] [Google Scholar]
- 8.Wright A, et al. Clinical decision support capabilities of commercially-available clinical information systems. Journal of the American Medical Informatics Association 2009; 16(5): 637–644 [PubMed: 19567796] [DOI] [PMC free article] [PubMed] [Google Scholar]
- 9.Chaffee BW. Future of clinical decision support in computerized prescriber order entry. American Journal of Health-System Pharmacy 2010; 67(11): 932–935 [PubMed: 20484218] [DOI] [PubMed] [Google Scholar]
- 10.Eberhardt J, Bilchik A, Stojadinovic A. Clinical decision support: potential with pitfalls. Journal of Surgical Oncology 2012; 105(5): 502–510 [PubMed: 22441903] [DOI] [PubMed] [Google Scholar]
- 11.Sittig DF, Wright A, Osheroff JA. Grand challenges in clinical decision support. Journal of Biomedical Informatics 2008; 41(2): 387–392 [PubMed: 18029232] [DOI] [PMC free article] [PubMed] [Google Scholar]
- 12.Moxey A, et al. Computerized clinical decision support for prescribing: provision does not guarantee update. Journal of the American Medical Informatics Association 2010; 17(1): 25–33 [PubMed: 20064798] [DOI] [PMC free article] [PubMed] [Google Scholar]
- 13.Cash JJ. Alert fatigue. American Journal of Health-System Pharmacy 2009; 66(23): 2098–20101 [PubMed: 19923309] [DOI] [PubMed] [Google Scholar]
- 14.Anderegg SV, Gumpper KF. What meaningful use means for pharmacy. American Journal of Health-System Pharmacy 2012; 69(10): 890–894 [PubMed: 22555086] [DOI] [PubMed] [Google Scholar]
- 15.Garg AX, et al. Effects of computerized clinical decision support systems on practitioner performance and patient outcomes. A systematic review. JAMA 2005; 293(10): 1223–1228[PubMed: 15755945] [DOI] [PubMed] [Google Scholar]
- 16.Das M, Eichner J. March 2010. Challenges and barriers to clinical decision support (CDS) design and implementation experienced in the Agency for Healthcare Research and Quality CDS Demonstrations. (Prepared for the AHRQ National Resource Center for Health Information Technology under Contract No. 290-04–0016.) AHRQ Publication No. 10-0064-EF Rockville, MD: Agency for Healthcare Research and Quality [Google Scholar]
- 17.Devine EB, et al. The impact of computerized provider order entry on medication errors in a multispecialty group practice. Journal of the American Medical Informatics Association 2010; 17(1): 78–84[PubMed: 20064806] [DOI] [PMC free article] [PubMed] [Google Scholar]
- 18.EPICare’s Ambulatory EMR® (Verona, WI) [accessed on September 28, 2013] Available at: http://www. epic.com/software-ambulatory.php [Google Scholar]
- 19.Devine EB, et al. August 2008. Implementing an ambulatory e-prescribing system: strategies employed and lessons learned to minimize unintended consequences. In: Henriksen K, Battles JB, Keyes MA, Grady ML. Advances in Patient Safety: New Directions and Alternative Approaches (Vol. 4: Technology and Medication Safety). Rockville (MD): Agency for Healthcare Research and Quality; [PubMed] [Google Scholar]
- 20.Standards of Medical Care in Diabetes-2008 (Executive Summary). Diabetes Care 2008; 31(Suppl. 1): S5–S11 [DOI] [PubMed] [Google Scholar]
- 21.Standards of Medical Care in Diabetes-2008 (Executive Summary). Diabetes Care 2009; 32(Suppl. 1): S6–S12 [DOI] [PMC free article] [PubMed] [Google Scholar]
- 22.Third Report of the National Cholesterol Education Program on Detection, Evaluation and Treatment of High Blood Cholesterol in Adults (Adult Treatment Panel III). (Executive Summary). May 2001. National Cholesterol Education Program, National Heart, Lung, and Blood Institute, National Institutes of Health; NIH Publication No. 01-3670. [Google Scholar]
- 23.Liang KY, Zeger SL. Longitudinal Data Analysis Using Generalized Linear Models. Biometrika 1986; 73(1): 13–22 [Google Scholar]
- 24.Smith DH, et al. The impact of prescribing safety alerts for elderly persons in an electronic medical record. Archives of Internal Medicine 2006; 166(10): 1098–1104[PubMed: 16717172] [DOI] [PubMed] [Google Scholar]
- 25.Lo HG, et al. Impact of non-interruptive medication laboratory monitoring alerts in ambulatory care. Journal of the American Medical Informatics Association 2009; 16(1): 66–71[PubMed: 18952945] [DOI] [PMC free article] [PubMed] [Google Scholar]
- 26.Singh H, et al. Modification of abnormal lab test results in an electronic medical record: do any safety concerns remain? American Journal of Medicine 2010; 123(3): 238–244[PubMed: 20193832] [DOI] [PMC free article] [PubMed] [Google Scholar]
- 27.Agrawal A, Mayo-Smith MF. Adherence to computerized clinical reminders in a large healthcare delivery network. Studies in Health Technology Informatics 2004; 107(Pt 1): 111–114[PubMed: 15360785] [PubMed] [Google Scholar]
- 28.Bundy DG, et al. Electronic health record-based monitoring of primary care patients at risk of medication-related toxicity. Jt Comm J Qual Patient Saf 2012; 38(5): 216–223[PubMed: 22649861] [DOI] [PubMed] [Google Scholar]
- 29.Fischer SH, Tjia J, Field TS. Impact of health information technology interventions to improve medication laboratory monitoring for ambulatory patients: a systematic review. Journal of the American Medical Informatics Association 2010;17:631–636[PubMed: 20962124] [DOI] [PMC free article] [PubMed] [Google Scholar]
- 30.Cowansage CB, et al. An application for monitoring order set usage in a commercial electronic health record. AMIA Annu Symp Proc 2012: 1184–1190[PubMed: 23304395] [PMC free article] [PubMed] [Google Scholar]


