

Abstract
Background
The aim of this study was to determine the effect of initial therapy with some disease modifying antirheumatic drugs (DMARDs) (Methotrexate and Ketoprofen) on glomerular and tubular integrity in patients with Rheumatoid arthritis (RA).
Objectives
Objectives: To determine whether there is a change in clinical and laboratory indicators of renal function in course of the follow up of treatment and whether that change correlates with the dynamics of the quantity of enzymes excreted in urine and reactants of the acute phase.
Materials and Methods
Using colorimetric method for determination of NAG, samples of 70 participants were examined (35 RA patients treated with Ketoprofen only, 35 RA patients treated with combined use of Methotrexate and Ketoprofen). The follow up was 5 time-intervals in the course of 24 weeks.
Results
There was moderate correlation between NAG and microalbuminuria (r=0,34) in the group of patients treated with Ketoprofen only, while statistically significant correlation (r=0,21) was seen in group of patients with combined use of Methotrexate and Ketoprofen. NAG enzymuria in size, number of patients registered, and time of appearance were greater and appears earlier in the group with the combined use of Methotrexate and Ketoprofen compared with the mono-therapy with Ketoprofen. Mean urinary NAG induction was increasing with the concomitant use of Methotrexate and Ketoprofen.
Conclusions
Methotrexate is more potent NAG inductor than Ketoprofen and provokes greater tubular enzymuria than Ketoprofen.
Keywords: N-acetyl-D-glucosaminidase, Symmetric dimethyl arginine, Rheumatoid arthritis, Immunosuppressive drugs
1. Background
Traditional treatment of rheumatoid arthritis (RA) includes non-steroid anti-inflammatory drugs (NSAIDs), drugs that modify the disease (DMRADs), steroids and immunosuppressive cytotoxic drugs.
Methotrexate in low dose regimen is the most subscribed drug of the DMRADs, while in the group of NSAIDs Ketoprofen is the usually prescribed. Lysosomal system of the tubules is dynamic system, and low level of lysosomal enzymes, found in normal urine, is result of normal exocytotic and pinocytotic activity of the tubular endothelial cells (1). Enzymuria depends on the place and intensity of damage. Increased enzyme activity is a reflection of disease activity and residual functional capacity of kidney (2). Perturbation in renal tubules initially affects lysosomal membrane system in cells, resulting in increased loose of enzyme in the urine in early stadium. Latter increase of enzyme excretion is connected to structural damage of cells resulting in cell necrosis. With the absence of the toxic stimulus, decrease of the urinary enzyme activity will be followed by regeneration of tubular cell function.
Criteria that make urinary enzymes suitable for determination of certain abnormalities in renal function are:
Low level of enzymes in physiologic conditions.
Sensitive methods for determination of enzyme activities in urine.
High concentration of examined enzymes in renal tissue.
Visible increase of enzyme activity in urine in renal damage.
Increase of urine enzyme activity could show the place of the primary renal tubular damage because of their localization in brush border region (microsomal alanine amino peptidase (AAP), E.C.3.4.11.2) and tubular lysozymes (NAG E.C.3.2.1.30). They can be useful in early diagnose of acute renal damage as nephrotoxicity caused by immunosuppressive drugs, contrast substances, antibiotics and cadmium exposition (3-10). Urinary enzyme activity normally is very low in urine and is increased in renal tubular cell damage (11). Urinary enzymes, especially N-Acetyl-b-D-glucosaminidase (NAG), AAP and Alkaline Phosphatase (AP) are very sensitive indicators of renal parenchymal damage in comparison with functional measurements as GFR, creatinine and inulin clearance. Relatively low sensitivity of GFR could be explained with great functional reserve of the kidney and its great capability of compensation. The use of urinary enzymes is relatively simple, cheap, quick and non-invasive method in detection of disease early stadium and renal failure follow up. In last 30 years a great attention has been paid in evaluation of urinary enzymes as non-invasive markers for determination of tubular damage. Urinary activity of NAG is one of the most evaluated urinary enzymes and is very sensitive marker for renal tubular damage (12,13).
Dosing of most drugs must be adapted in renal insufficiency, making accurate assessment of renal function an essential component of diagnostics in clinical medicine. Furthermore, even modest impairment of renal function has been recognized as a cardiovascular risk factor. As the most commonly used marker of renal excretory function, serum creatinine concentration, does not adequately respond to mild or moderate impairment of renal function. More sensitive markers for renal excretory function are urgently seeked, especially in mild stages of renal impairment. Symmetric dimethyl arginine (SDMA) is a methylated derivative of the amino acid L-arginine. SDMA is eliminated from the body exclusively by renal excretion, therefore, SDMA plasma concentration is tightly related to renal function. Thus, quantification of plasma SDMA is an adequate mean to assess renal function, as could be demonstrated in a series of recent clinical trials. In 18 clinical studies involving more than 2,100 patients’ systemic SDMA concentrations were highly correlated with inulin clearance as well as with various clearance estimates and better corresponded to mild renal function impairment than serum creatinine. Thus, SDMA exhibits properties of a reliable marker of renal function. Furthermore, there is evidence showing that elevated SDMA level, which usually occurs in renal function impairment, may prospectively indicate future risk of cardiovascular disease and mortality independentl of the level of renal impairment (14-16).
1.1. Renal damage in Methotrexate and Ketoprofen use
Possible mechanism of Methotrexate nephrotoxicity could be due to the interference of normal lysosomal digestion which causes lysis of the lysosomal membrane, pass of the acid hydrolases in cell cytosol of the proximal tubules, manifested latter with necrotic changes. Possible pathways of entrance in epithelial cells of proximal tubules are:
Apical membrane transport with pinocytosis with adequate drug attachment (cytostatics, aminoglycosides, cephalosporins, diuretics and other toxic substances) inside lysosomes.
Apical membrane transport, which in some unknown way fill in the process of pinocytosis.
Baso-lateral membrane transport.
If Methotrexate is transported in proximal tubular cells with pinocytosis, the hypothesis could be confirmed that nephrotoxicity caused by it, is a result of lysosomal dysfunction as the direct result of its sedimentation in lysosomes. Vacuoles fulfilled with proteins are transported to the middle part of the cell where are connected with previously existing lysosomes. Hydrolytic enzymes catalyze it, and newly formed products are suitable for re-circulation. In the mechanism of Methotrexate nephrotoxicity two moments are important:
1. Active secretion in proximal tubular spaces with the same degree of re-absorption.
2. Active transport inside in proximal tubular cells from the anti-luminal side with limited movements in tubular liquids.
It is proved that the toxic agents could pass through the cell membranes entering in lysosomes in non-ionized form, captured by acid pH in these organelles (17). There is possibility for Methotrexate to block the key lysosomal degradation function, which leads to accumulation of the toxic product ordeterioration of vital metabolism inside cells.
1.2. Some pharmacological aspects of kinetics and dynamics of Methotrexate and Ketoprofen
1. Methotrexate only in 50-60% is attached to the plasma proteins. Increase in free Methotrexate depends on the competition for albumin with other drugs with greater affinity for attachment with albumin as aspirin or somr other NSAIDs and sulfonamides.
2. Ketoprofen and Methotrexate are competing for attachment with plasma proteins, and their concomitant use leads to increase in the non-allied-free Methotrexate and significant increase of its toxicity (18).
3. Excretion of Methotrexate as free or its metabolite is through the kidneys i.e. through glomerular filtration and proximal tubular secretion. Organ acids as phenylbutasone, penicillin, sulfonamides, salicylates, probenecid and NSAIDs (fenoprofen, naproxen, tolmetin) (19,20) competitively inhibit tubular secretion influencing Methotrexate clearance. Toxic effects of Methotrexate on normal tissue are more connected with the length of exposition than with the level of dose.
There are opposite results from the mutual interaction of co-administration of low dose of Methotrexate and other NSAIDs in patients suffering from RA. Some reports suggest that there is no significant interaction from the combined use of low dose Methotrexate with piroxicam, naproxen and sulindac, but others suggest possible interaction in patients who suffer from RA treated with naproxen and ibuprofen (21-31), which needs the problem to be solved. Impairment of the renal function is noted in patients suffering from malignant diseases treated with high doses of Methotrexate, but it is unknown whether administration of low dose of Methotrexate could manifest similar effects.
2. Objectives
To determine whether there is a change in clinical and laboratory indicators of renal function in course of the follow up of treatment and whether that change correlates with the dynamics of the quantity of enzymes excreted in urine and reactants of the acute phase.
3. Patients and Methods
3.1. Patients
In the patients examined for this study, the diagnosis of the disease was established on the basis of revised diagnostic criteria for the classification of RA, suggested in 1987 by the American Association for Rheumatism (ARA) (32). In order for a patient to be diagnosed with rheumatoid arthritis, he or she must fulfill at least four out of seven criteria. Criteria from one to four are present for at least six month. In this study 70 patients are examined, divided in 2 groups. In the group treated with Ketoprofen only are included 35 patients with RA. Of them 27 (77%) are women, 8 (23%) are men. Mean age of patients in this group is 53.7±10.4 years (min=28, max=65 years). The disease lasted mean 72.2±52.7 months (min=1, max=360 months). In the group with combined use of Methotrexate and Ketoprofen are included 35 patients with RA. Of them 29 (83%) are women, and 6 (17%) are men. Mean age of patients in this group is 53.9±9.7 years. The disease lasted mean 121.3±109.3 months (min=3, max=456 months).None of the patients included in this study has medical record for past or present renal disease. 6 patients are previously treated with oral steroids in the group of patients treated with combined use of Methotrexate and Ketoprofen before the beginning of follow up. Steroids as bridge therapy in combined use of these two drugs are not used during follow up. The rest negate use of previous NSAIDs, golden salts and other drugs, especially antibiotics before use of Ketoprofen and Methotrexate. Samples are collected in the period of 2 years.
3.2. Criteria for inclusion
The study included patients suffering from RA, age 18-65 years, not treated with NSAIDs or DMARDs.
3.3. Criteria for excluded from the research
From the research were excluded all the patients with a disease or condition which could directly or indirectly influence a change in results including:
1. Patients with previous medical record for diseases of the spleen, thyroid gland, hepatic damage, renal, hematologic, cardiovascular, neurologic, lung damage, autoimmune diseases, AIDS and aged <18 years.
2. Patients with diabetes mellitus, acute infections, malignant neoplasm and febrile conditions.
3. Patients treated with antibiotics and salicylate in the period of six months prior to the beginning of the study.
4. Patients with hypertension, gouty arthritis, infections, SLE, Sjögren, mixed conjunction texture disease and vasculitis.
5. Patients treated with antihypertensive or antidiabetic drugs.
6. Patients with anamnesis for transfusion of blood and overweight.
7. Hypersensitive to some of the medicines or their components.
3.4. Clinical evaluation of disease activity
A subspecialist in this field did the clinical evaluation. The activity of the disease was evaluated using DAS 28 index (33-36). The index is a mathematical formula that allows us to get a uniquely composed quantitativescore, which constitutes from palpation painful sensitive joints (max number 28), swollen joints (maxnumber 28), Westergren ESR, and the patient’s global assessment of the activity of disease (0–100 mm Visual Analogous Scale, (VAS)) and the morning rigid (minutes). DAS 28 index is ranked from 0 to 10 and a score under 3.2 ranks the disease as low-active. The assessment of GFR was calculated using the Cockroft-Gault equation
3.5. Laboratory assessment
For clinical estimation of the disease it was necessary to take in consideration following laboratory variables: blood count, differential, reactants of the acute phase: CRP, RF and ESR, anti-CCP 2 antibodies, alkaline phosphatase (AP), aspartate aminotransferase (AST), alanine aminotransferase (ALT), creatine kinase (CK), lactate dehydrogenase (LDH), urea and creatinine in serum. Examples of urine were taken not only for routine urine analysis, but also for detection of NAG, creatinine in urine and microalbuminuria. For processing are used samples from second urine, not frozen, immediately processed, preserving the rules for good laboratory practice.
3.6. ELISA technology of DLD-Diagnostika-GMBH for detection of symmetric dimethyl arginine (SDMA)
Principle of the assay
The competitive SDMA-ELISA uses the micro titer plate format. SDMA is bound to the solid phase of the micro titer plate. SDMA in the samples is acylated and competes with solid phase bound of SDMA for a fixed number of rabbit anti-SDMA antiserum binding sites. When the system is in equilibrium, free antigen and free antigen-antiserum complexes were removed by washing. The antibody bound to the solid phase SDMA was detected by anti-rabbit/peroxidase. The substrate TMB/peroxidase reaction was monitored at 450 nm. The amount of antibody bound to the solid phase SDMA was inversely proportional to the SDMA concentration of the sample.
Reference value: 0,3-0,7μmol/L
3.7. Colorimetric assay for the determination of n-acetyl-β-d glucosaminidase (NAG) in urine (ROCHE)
Principle of the assay
3-Cresolsulfonphthaleinyl-N-Acetyl-β-D-glucosaminide, sodium salt, was hydrolyzed by N-Acetyl-β-D-glucosaminidase (NAG) with the release of 3-cresol-sulfonphthalein, sodium salt (3-cresol purple), which was measured photometrically at 580nm using Roche Mancheim tests. Turbid urines centrifuged and the supernatant was decanted. Reference value: NAG urine 0.27-1.18 U/mmol creatinine.
3.8. Immunoturbidimetric assay for the determination of urinary albumin (RANDOX LABORATORIES LIMITED)
Principle of the assay
An undiluted sample was added to a buffer containing the antibody specific for human serum albumin. The absorbance (340 nm) of the resulting turbid solution was proportional to the concentration of albumin in the sample urine. By constructing a standard curve from the absorbance of standards, the albumin concentration was determined. The assay carried out manually (at room temperature) (37,38).
Sample collection and storage
For random urinary albumin measurement, an early morning mid-stream specimen was used. The samples were centrifuge before use and analyzed the clear supernatant in the assay.
Reference value: 2.0-20.0 mg/L.
3.9. Urea in serum
Urea was detected with the method of «Kassirer». Reference values are 3–7.8 mmol/L.
3.10. Creatinine in serum and urine
Creatinine was detected with the «Jaffe» method. Reference value for creatinine in serum is 45-109 μmol/L and for creatinine in urine is 7-17 μmol/dU.
3.11. Rheumatic factor (RF)
RF was determined using the test of agglutination (Latex RF test) (BioSystems S.A. Reagents & Instruments Costa Brava 30, Barcelona, Spain). Reference values is under 8 mg/L RF in serum.
3.12. C-reactive protein (CRP)
CRP was found using the test of agglutination (Latex CRP test), (BioSystems S.A. Reagents & Instruments Costa Brava 30, Barcelona, Spain). Reference value is under 6 mg/L CRP in serum.
3.13. Red cell sedimentation (ESR)
For measurement of ESR we used the method of Westergren, and normal values were: for male patients, 7–8 mm and for female patients, 11–16 mm.
3.14. Statistical Analysis
Student’s t test was used for testing the difference between two arithmetic means comparing two groups, and Wilcoxon-matched test was used for independent examples. The association between various group data was calculated with the Pearson or Spearman rank correlation tests for parametric and non-parametric data respectively. Analysis of relation between attributive statistical series was made with Pearson’s χ2 test. Test of the significance of the differences among three or more arithmetical means was made with Analysis of variance (ANOVA); as well as Freedman’s analysis of variance (Fr χ2). Statistical series are shown with tables and figures according to the defined variables of interest. Statistical software Stata, release 7.0 for data processing was used. Data are expressed as Mean+SD and range when appropriate. P values less than 0.05 were considered significant.
4. Results
Analyzing the distribution of patients according to the values of NAG in the five probes, in the group of patients treated only with Ketoprofen, one could conclude that evaluated values of NAG are registered in 27 (77%) of patients in 16th week (4th probe), when mean urinary NAG induction is the highest (1.65±0.74).
But, analyzing the group of patients treated with combined use of Methotrexate and Ketoprofen, in relation with the distribution of patients according to the values of NAG in the five probes, one could conclude that elevated values of NAG are registered in 31 (89%) of patients in the 8th week (3rd probe), when the degree of mean urinary NAG induction is highest (1.99±1.00).
Testing the significance in differences in both groups in 0 spot, in the group of patients treated only with Ketoprofen, the mean value of the urinary NAG induction ranges 0.93±0.48, in the group of patients treated with combined use of Methotrexate and Ketoprofen 1.13±0.54. It shows that Methotrexate is more potent NAG inductor compared with Ketoprofen, but during their combined use, the mean urinary NAG induction is increased considering size and time of appearance (Table 1, Figures 1 and 2).
In the group of patients treated with Ketoprofen, the distribution of patients according to the values of microalbuminuria in the five probes, one could conclude that elevated values of microalbuminuria are registered in 7 (20%) of patients in the 4th week (2nd probe) when the level of microalbuminuria is highest (19.55±11.46).
Analyzing the distribution of patients according to the values of microalbuminuria in the five probes, in the group of patients treated with the combined use of Methotrexate and Ketoprofen, we can conclude that increased values of microalbuminuria above normal range are maximally registered in 10 (29%) of patients in the 8th week (3rd probe) with size of induction 20.50±9.69 (Table 1, Figures 3 and 4).
Testing the significance of difference in both groups in 0 spot, in the group of patients treated with Ketoprofen only, the mean value of microalbuminuria is 17.91±11.17, while in the group treated with combined use of Methotrexate and Ketoprofen the mean value is 16.35±7.41. This explains why Methotrexate gives identical appearance of microalbuminuria compared with Ketoprofen, but with their combined use microalbuminuria is increased both in size and time of appearance.
Analysis with Pearson’s χ2 test showed that there was moderate correlation between NAG and microalbuminuria in the five probes in the period of 24 weeks in the group of patients treated only with Ketoprofen.
Analysis with Pearson’s χ2 test showed that there was statistically significant correlation (r=0.21) between the elevation of values of NAG and microalbuminuria in the five probes in the period of 24 weeks in the group with combined use of Methotrexate and Ketoprofen (Figures 5 and 8).
4.1. SDMA, NAG, microalbuminuria and reactants of the acute phase
Considering the reactants of the acute phase, CRP and RF, in the group of patients treated only with Ketoprofen, Friedman’s analysis of variance (Frχ2) showed that there were not statistically significant differences between mean values of RF and CRP in the five probes: RF (465.12±261.27, Fr χ2=0.9474; p=0.4380) and CRP (39.24±59.19, Fr χ2=0.2693; p=0.8974).
Analysis with Pearson’s χ2 test showed that there was statistically significant correlation between the elevation of NAG and RF in the five probes (χ2 =12.061, df=1, p=0.00052) But there was not statistically significant correlation between the elevation of microalbuminuria and RF in the five probes (χ2 =2.087, df=1, p=0.1484).
Analysis with Pearson’s χ2 test showed that there was statistically significant correlation among the elevation of NAG, microalbuminuria and CRP in the five probes in the follow up period; NAG vs. CRP (χ2 =5.453, df=1; p=0.0195). Microalbuminuria vs. CRP (χ2 =6.377, df=1; p=0.0115).
Considering SDMA, analysis with Pearson’s χ2 test showed that there was not statistically significant correlation between the elevation of NAG and SDMA (χ2=2.127, df=1, p=0.01446); as well as microalbuminuria vs. SDMA (χ2=0.1307, df=1, p=0.9983).
With combined use of Methotrexate and Ketoprofen in respect to RF and CRP, Fr χ2 showed that there was not statistically significant correlation between the mean values of RF and CRP in the five probes RF(448.76±427.5, Fr χ2=0.676, p=0.6091) and CRP (54.1±48.0, Fr χ2=0.334, p=0.8552).
Analysis with Pearson’s χ2 test showed that there was statistically significant correlation between the elevation of NAG and RF in the five probes in the follow up period; NAG vs. RF (χ2=13.70, df=1, p=0.0021), but there was not between microalbuminuria and RF (χ2=2.389, df=1, p=0.1221).
Analysis with Pearson’s χ2 test showed that there was not statistically significant correlation among the elevation of NAG, microalbuminuria and CRP in the five probes in the follow up period; NAG vs. CRP (χ2=1.787, df=1, p=0.1812), microalbuminuria vs. CRP (χ2 =0.3714, df=1, p=0.542).
With combined use of Methotrexate and Ketoprofen in respect of SDMA analysis with Pearson’s χ2 test with Yate’s correction showed that there was statistically significant correlation among the mean values of NAG, microalbuminuria and CRP in the five probes in the follow up period, NAG vs. SDMA (χ2=4.353, df=1, p=0.0386), microalbuminuria vs. SDMA (χ2=4.061, df=1, p=0.0439) (Table 2).
Table 1. NAG, microalbumin and other laboratory variables in the group of patients treated with Ketoprofen only, and in the group with combined use of Ketoprofen and Methotrexate.
| KETOPROFEN GROUP No 35 | KETOPROFEN+METHOTREXAT GROUP No 35 | |||||
|
NAG + >1.18 (U/mmol/crea) value (M ± SD) normal range (%) / elevated values (%) |
MICROALBUMINURIA + >20 (mg/L) value (M ± SD) normal range (%) / elevated values (%) |
GFR |
NAG + >1.18 (U/mmol/crea) value (M ± SD) normal range (%) / elevated values (%) |
MICROALBUMINURIA + >20 (mg/L) value (M ± SD) normal range (%) / elevated values (%) |
GFR | |
|
0 spot |
1.13±0.54 22 (63%) / 13(37%) |
17.91±11.17 30 (86%)/ 5 (14%) |
99.5±22.5 |
0.93±0.48 25 (71%)/ 10 (29%) |
16.35±7.41 30 (86%)/ 5 (14%) |
95.9±32.6 |
|
4th week |
1.27±0.48 17 (49%) / 18 (51%) |
19.55±11.46 28 (80%) / 7(20%) |
99.9±24.1 |
1.27±0.47 18 (51% ) / 17 (49%) |
18.21±7.63 26 (74%) / 9 (26%) |
97.1±39.4 |
|
8th week |
1.49±0.67 12 (34%) / 23 (66%) |
18.91±13.03 30 (86%)/ 5 (14%) |
102.9±30.1 |
1.99±1.00 4 (11%)/ 31 (89%) |
20.50±9.69 25 (71%)/ 10 (29%) |
98.8±36.1 |
|
16th week |
1.65±0.74 8 (23%) / 27 (77%) |
18.08±11.68 32 (91%)/ 3 (9%) |
101.2±25.5 |
1.94±1.02 10 (29%)/ 25 (71%) |
17.02±5.64 29 (83%)/ 6 (17%) |
95.9±32.6 |
|
24th week |
1.36±0.57 15 (43%) / 20 (57%) |
18.14±12.65 32 (91%)/ 3 (9%) |
98.8±22.3 |
1.36±0.83 21 (60%)/ 14 (40%) |
14.74±8.56 32 (91%)/ 3 (9%) |
98.9±44.3 |
Figure 1 .

Mean values of N-acetyl-β-D-glucosaminidase (NAG) in patients of the group treated with Ketoprofen only in the five probes
Figure 2 .

Mean values of N-acetyl-β-D-glucosaminidase (NAG) in the group of patients with the combined use of Methotrexate and Ketoprofen in the five probes
Figure 3 .

Mean values of microalbuminuria in the group of patients treated with Ketoprofen only in the five probes
Figure 4 .

Mean values of microalbuminuria in the group of patients with the combined use of Methotrexate and Ketoprofen in the five probes
Figure 5 .

Pearson’s coeficient of correlation (r) between the values of N-acetyl-β-D-glucosaminidase (NAG) and microalbuminuria in the group of patients treated with Ketoprofen only
There is moderate correlation between NAG and microalbuminuria (r=0,34).
Figure 6 .

Pearson’s coeficient of correlation (r) between the values of N-acetyl-β-D-glucosaminidase (NAG) and microalbuminuria in the group of patients with the combined use of Methotrexate and Ketoprofen
There is significant correlation between NAG and microalbuminuria (r=0,21).
Figure 7 .

Distribution of patients in the group treated with Ketoprofen only according to the elevated values of Symmetric dimethyl Arginine (SDMA), N-acetyl-β-D-glucosaminidase (NAG), microalbuminuria and other laboratory variables in the five probes
Figure 8 .
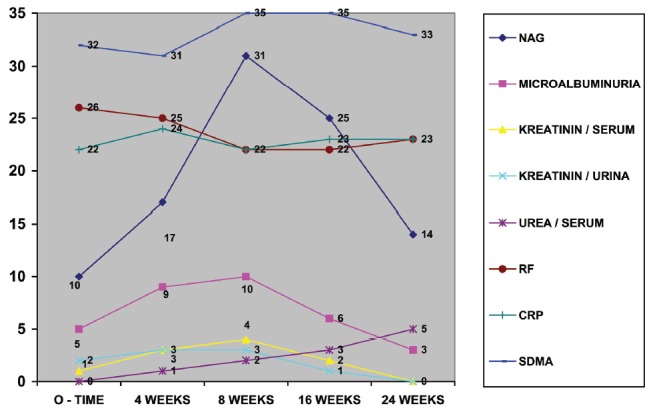
Distribution of patients in the group with the combined use of Methotrexate and Ketoprofen according to the elevated values of Symmetric dimethyl Arginine (SDMA), N-acetyl-β-D-glucosaminidase (NAG), microalbuminuria and other laboratory variables in the five probes
Table 2. SDMA, NAG, microalbumin and other laboratory variables in the group treated with Ketoprofen only, and in the group with combined use of Ketoprofen and Methotrexate.
|
KETOPROFEN
GROUP |
KETOPROFEN + METHOTREXAT
GROUP |
|||||||||
| M ± SD | Fr χ2 | p | NAG | MICROALBUMINURIA | M±SD | Frχ2 | p | NAG | MICROALBUMINURIA | |
| CRP | 39.24±59.19 | 0.2693 | 0.8974 |
Frχ2 =5.453 df=1, p=0.0195* |
Frc2 = 6.377 df=1, p=0.0115* |
54.1±48.0 | 0.334 | 0.8552 |
Frχ2=1.787 df=1 p=0.1812 |
Frχ2=0.3714 df=1 p=0.542 |
| RF | 465.12±261.27 | 0.9474 | 0.4380 |
Fr χ2=12.061 df=1 p=0.00052* |
Frχ2 = 2.087 df = 1 p = 0.1484 |
448.78±427.5 | 0.676 | 0.6091 |
Frχ2=13.70 df=1 p=0.0021* |
Frχ2=2.389 df=1 p=0.1221 |
| SDMA |
Frχ2=2.127 df=1 p=0.1446 |
Frχ2=0.1307 df=1 p = 0.9983 |
Frχ2=4.353 df=1 p=0.0368* |
Frχ2=4.061 df=1 p=0.0439* |
||||||
| GFR | 99.5±22.5 | 0.1521 | 0.9618 | 95.9±32.6 | 0.0551 | 0.9943 | ||||
| kreatinin / serum | 66.89±14.02 | 0.0480 | 0.9956 | 67.69±13.59 | 0.1424 | 0.9660 | ||||
| kreatinin / urina | 9.64±6.68 | 0.1196 | 0.9753 |
Frχ2=5.887 df=1 p=0.0152* |
Frχ2=31.148 df=1 p = 0.0001* |
9.52±4.89 | 1.3263 | 0.2621 |
Frχ2=1.050 df=1 p=0.3053 |
Frχ2=2.488 df=1 p=0.114 |
| urea / serum | 5.26±1.63 | 0.4469 | 0.7745 |
Frχ2=0.0073 df=1 p=0.9316 |
Frχ2=2.407 df=1 p=0.1207 |
5.67±1.41 | 0.4454 | 0.7755 |
Frχ2=0.0637 df=1 p=0.8007 |
Frχ2=0.1148 df=1 p=0.7346 |
* statistically significant differences
4.2. SDMA, NAG, microalbuminuria and degradation products of the nitric metabolism
Considering the degradation products of the nitric metabolism, serum creatinine, urine creatinine, serum urea, in the group of patients treated only with Ketoprofen, Frχ2 showed that there was not statistically significant correlation among the mean values of all degradation products in the five probes. All patients, in all measurements had values in normal range. Creatinine/serum (66.89±14.02, Fr χ2=0.0480, p=0.9956), creatinine/urine (5.26±1.63; Fr χ2=0.4469, p=0.7745).
In the group of patients with the combined use of Methotrexate and Ketoprofen in the five probes, Fr χ2of degradation products showed that there were not statistically significant differences among the mean values of the degradation products in the five probes. All patients in all measurements had values in normal range. Creatinine/serum (67.69±13.59, Frχ2=0.1424, p=0.9660), creatinine/urine (9.52±4.89, Frχ2 =1.3263, p=0.2621); urea/serum (5.67±1.41, Frχ2=0.4454, p=0.7755).
In the group of patients treated only with Ketoprofen, as well as in combined use of Methotrexate and Ketoprofen, regarding serum creatinine, all patients in all measurements had values in normal range. Analysis of variance (ANOVA) showed that there were not statistically significant differences between the mean values of the serum creatinine in patients of the two groups (F=0.684, p=0.5631). There was not statistically significant correlation among the elevation of SDMA, NAG, and microalbuminuria and serum creatinine in the five probes.
Regarding urine creatinine, analysis with Pearson’s χ2 test with Yate’s correction showed that:
1. There was statistically significant correlation between the elevation of values of NAG and urine creatinine in the five probes (χ2=5.887, df=1, p=0.0152), as well as between microalbuminuria and urine creatinine (χ2 =31.148, df=1, p=0.0001); but not during combined use Methotrexate and Ketoprofen.
2. There was not statistically significant correlation between the elevation of values of NAG and urine creatinine in the five probes in the follow up period (χ2=1.050, df=1, p=0.3053). There was not statistically significant correlation between the elevation of values of microalbuminuria and urine creatinine in the five probes (χ2=2.488, df=1, p=0.114). ANOVA showed that there were not statistically significant differences between the mean values of the urine creatinine in patients of the two groups (F=0.1611, p=0.9222).
Considering serum urea in the two groups analysis with Pearson’s χ2 test with Yate’s correction showed that in the group of patients treated only with Ketoprofen there was not statistically significant correlation between the elevation of values of NAG and urea in the five probes (χ2=0.0073, df=1; p=0.9316), as well as between microalbuminuria and serum urea (χ2=2.407, df=1, p=0.1207), as with the combined use of Methotrexate and Ketoprofen: NAG vs. serum urea in the five probes (χ2=0.1148, df=1, p=0.7346). ANOVA showed that there were not statistically significant differences between the mean values of the serum urea in patients of the two groups: F=1.132, p=0.3384.
4.3. SDMA, NAG, microalbuminuriaand calculated creatinine clearance
Frχ2 showed that there were not statistically significant differences between the mean values of calculated creatinine clearance (CCC) in the five probes in the group of patients treated only with Ketoprofen (Frχ2=0.1521; p=0.9618), as well in the group with combined use of Methotrexate and Ketoprofen (Frχ2= 0.0551; p=0.9943).
Analyzing the mean values of CCC in the two groups in 0 probe, in patients treated only with Ketoprofen and in the group of patients treated with combined use of Methotrexate and Ketoprofen, ANOVA showed that there were not statistically significant differences between the mean values of the CCC in patients of the two groups (F=0.130, p=0.9419). There was not statistically significant correlation between the elevation of the mean values of NAG, microalbuminuria and CCC in the two groups. (Tables 1 and 2).
5. Discussion
In this study, the analysis with Pearson’s χ2 test showed that there was statistically significant correlation (r=0.21) between the elevation of NAG and microalbuminuria in the five probes in the follow up period of 24 weeks in the group with combined use of Methotrexate and Ketoprofen, while there was moderate correlation between NAG and microalbuminuria (r=0.34) in the five probes in the follow up period of 24 weeks in the group of patients treated with Ketoprofen only.
Initial increase of the activity is a result of the changes in cell synthesis and not always enzymuria can be result of the lytic or necrotic processes. However, with the appearance of the second peak, one can be certain of the necrotic process provoked by these drugs. Significant elevation of the activity of NAG is 2-3 times higher than the values gained in the probe with maximal induction (8th week) in combined use of Methotrexate and Ketoprofen (0.93±0.48 vs 1.99±1.00) in correlation with the isolated Ketoprofen (1.13±0.54 vs 1.65±0.74) in the probe with maximal induction (16th week), without bi-phase appearance.
Very important finding in the study, besides high frequency of abnormal urinary excretion of NAG is decrease of the frequency of high NAG values in the course of the combined use of Methotrexate and Ketoprofen. Significant decrease of the NAG excretion was noticed in the 24th week as a result of the reduction of the disease itself by the favorable beneficial effect of Methotrexate on inflammation, correlates with ESR, which is in concordance with the findings of other authors (24-26,29). The kidney is highly plastic organ and decrease of NAG excretion is a result of the adaptive characteristics of the kidney in the presence of externalmatter.
Lysosomal enzymes show expressible tendency towards normalization. This probably is due to the regeneration processes which is proved on the level of the tubular epithelium, also noticed by other authors (39,40). However, that is not the case with the membrane AAP, γ glutamyl transferase, γ-GT and AF, which after the treatment stay on high significant levels in terms of decreased activity. Regenerated tubular epithelium shows high resistance towards influences of drugs.
Low doses of Methotrexate regime did not cause significant damage of the renal proximal tubules in the most of the followed patients. Nephrotoxicity in the monotherapy with Methotrexate is bigger than with Ketoprofen. Methotrexate is more potent NAG inductor in comparison with Ketoprofen. The size of the NAG enzymuria and microalbuminuria is bigger in monotherapy with Methotrexate in comparison with the isolated use of Ketoprofen, but especially mean urinary NAG induction is increased with the concomitant use of Methotrexate and Ketoprofen. NAG induction, in size, is bigger and appears earlier in combined use of Methotrexate and Ketoprofen in comparison with the monotherapy with Ketoprofen. Early detection of high NAG enzymuria or microalbuminuria before the treatment with Methotrexate can be of use considering the anticipation for possible Methotrexate toxicity probably connected with impaired renal clearance of Methotrexate. Parameters as age of patients, duration of disease in months, previous or current treatment, do not allow us to anticipatethe decrease of NAG enzymuria.
There is not any changes in the clinical parameters of the renal function regarding degradation products of the nitric metabolism (creatinine in serum and urine, GFR) in the course of follow up. The least sensitive markers for early nephrotoxicity caused by Methotrexate and Ketoprofen are concentration of creatinine in serum and urine and urea in serum, as well as the level of CCC. These tests point at the changed, decreased glomerular filtration, but not at the changes in renal tubular function. We think that the use of these parameters can find application in the clinical practice in cases when there is much longer therapy with Methotrexate and Ketoprofen, combined with antibiotics, when they can indicate impairment of the glomerular filtration.
6. Conclusions
Determination of the urinary NAG together with the urinary creatinine excretion could serve as a more sensitive test for renal lesions in patients suffering from RA, as an additional diagnostic tool, and the information for the status of the disease. Obtained results in this study confirmed the safety and efficacy of Methotrexate and Ketoprofen in treatment of RA. Following the renal function with enzyme activity in urine for evaluation of the effective metabolic exfolliative turnover of tubular cells, avoidance of the frequent use of drugs, as well as individual adaptation of the doses are measurements for avoidance of the nephrotoxicity of these drugs.
Conflict of interest
DS, AL, NM JC and IK designed and performed the research. GB, SP, MSM, and TB analyzed the data. BD, SA, SKB, GS and VJ wrote some parts of the manuscript and all authors contributed to the final preparation of the manuscript.
Conflict of interest
The author declared no competing interests.
Funding/Support
None declared.
Acknowledgments
None declared.
Implication for health policy/practice/research/medical education:
Determination of the urinary N-acetyl-β-D-glucosaminidase together with the urinary creatinine excretion could serve as a more sensitive test for renal lesions in patients suffering from rheumatoid arthritis, as an additional diagnostic tool, and the information for the status of the disease.
Please cite this paper as: Spasovski D, Latifi A, Marina N, Calovski J, Kafedziska I, Božinovski G, Percinkova S, Slaninka-Micevska M, Balkanov T, Dejanova B, Alabakovska S, Krstevska-Balkanov S, Spasovski G, Janevska V. Symmetric dimethyl arginine and N-acetyl-β-D-glucosaminidase lysozimuria of proximal renal tubules as a target for nephrotoxicity in patients with rheumatoid arthritis treated with disease modifying ant rheumatic drugs. J Nephropathology. 2013; 2(1): 36-52. DOI: 10.5812/nephropathol.8989
References
- 1.Mellman I, Fuchs R, Helenius A. Acidification of the endocytic and exocytic pathways. Annu Rev Biochem . 1986;55:663–700. doi: 10.1146/annurev.bi.55.070186.003311. [DOI] [PubMed] [Google Scholar]
- 2.Wellwood JM, Ellis BG, Price RG, Hammond K, Thompson AE, Jones NF. Urinary N-acetyl-beta-D-glucosaminidase activities in patients with renal disease. Br Med J . 1975;3:408–11. doi: 10.1136/bmj.3.5980.408. [DOI] [PMC free article] [PubMed] [Google Scholar]
- 3.Dos Santos AC, Colacciopo S, Dal Bo CM. Occupational exposure to lead, kidney function tests and blood pressure. Am J Int Med . 1994;26:635–43. doi: 10.1002/ajim.4700260506. [DOI] [PubMed] [Google Scholar]
- 4.Shibasak T, Nakano H, Ohno I. Effect of pentoxifylline on CdCl -induced nephrotoxici-2ty in the rat. Biol Trace Elem Res . 1994;41:245–51. doi: 10.1007/BF02917426. [DOI] [PubMed] [Google Scholar]
- 5.Hong CY, Chia KS. Markers of diabetic nephropathy. J Diabetes Complications . 1998;12:43–60. doi: 10.1016/s1056-8727(97)00045-7. [DOI] [PubMed] [Google Scholar]
- 6.Sherman RL, Drayer ED, Leyland-Jones BR. N-Acetyl-b-glucosaminidase and b-2 microglobulin. Arch Intern Med . 1983;143:1183–5. doi: 10.1001/archinte.143.6.1183. [DOI] [PubMed] [Google Scholar]
- 7.Hultberg B, Ravnskov U. The excretion of N-acetyl-beta-glucosaminidase in glomerulonephritis. Clin Nephrol . 1981;15:33–8. [PubMed] [Google Scholar]
- 8. Jung K, Mattenheimer H, Burchardt U. Urinary enzymes in clinical and experimental medicine Springer-Verlag GmbH; 1992. 326.e1. ISBN 3540531882. Available at:http://www.amazon.com/Urinary-...
- 9.Price RG. Measurement of N-acetyl-b-glucosaminidase and its isoenzymes in urine, methods and clinical applications. Eur J Clin Chem Clin Biochem . 1992;30:693–705. [PubMed] [Google Scholar]
- 10.Hofmann W, Guder WG. A diagnostic programme for quantitative analysis of proteinuria. J Clin Chem Clin Biochem . 1989;27:589–600. doi: 10.1515/cclm.1989.27.9.589. [DOI] [PubMed] [Google Scholar]
- 11.Chiu JSP. Models used to asses renal function. Drug Devel Res . 1994;32:247–55. [Google Scholar]
- 12.Price RG. The role of NAG (N-acetyl-beta-D-glucosaminidase) in the diagnosis of kidney disease including the monitoring of nephrotoxicity. Clin Nephrol . 1992;38:S14–9. [PubMed] [Google Scholar]
- 13.Tucker SM, Pierce RJ, Price RG. Characterisation of human N-acetyl-beta-D-glucosaminidase isoenzymes as an indicator of tissue damage in disease. Clin Chim Acta . 1980;102:29–40. doi: 10.1016/0009-8981(80)90430-1. [DOI] [PubMed] [Google Scholar]
- 14.Bode-Boger SM, Scalera F, Kielstein JT, Martens-Lobenhoffer J, Breithardt G, Fobker M. et al. Symmetrical dimethylarginine: a new combined parameter for renal function and extent of coronary artery disease. J Am Soc Nephrol . 2006;17(4):1128–34. doi: 10.1681/ASN.2005101119. [DOI] [PubMed] [Google Scholar]
- 15.Kielstein JT, Salpeter SR, Bode-Boeger SM, Cooke JP, Fliser D. Symmetric dimethylarginine (SDMA) as endogenous marker of renal function--a meta-analysis. Nephrol Dial Transplant . 2006;21(9):2446–51. doi: 10.1093/ndt/gfl292. [DOI] [PubMed] [Google Scholar]
- 16.Wanby P, Teerlink T, Brudin L, Brattstrom L, Nilsson I, Palmqvist P. et al. Asymmetric dimethylarginine (ADMA) as a risk marker for stroke and TIA in a Swedish population. Atherosclerosis . 2006;185(2):271–7. doi: 10.1016/j.atherosclerosis.2005.06.033. [DOI] [PubMed] [Google Scholar]
- 17.De Duve C. Principles of tissue fractionation. J Theor Biol . 1964;6:33–59. doi: 10.1016/0022-5193(64)90065-7. [DOI] [PubMed] [Google Scholar]
- 18.Thuss S, Milano G, Kubar J, Namer M, Schneider M. Clinical and pharmacokinetics evidence of a life-threatening interaction between methotrexate and ketoprofen. Lancet . 1986;327(8475):256–8. doi: 10.1016/s0140-6736(86)90786-5. [DOI] [PubMed] [Google Scholar]
- 19.Brater DC. Drug-drug and drug-disease interaction with nonsteroidal antiinfamatory drugs. Amm J Med . 1986;80(1):62–77. doi: 10.1016/0002-9343(86)90933-2. [DOI] [PubMed] [Google Scholar]
- 20.Tracy TS, Krohn K, Jones DR, Bradley JD, Hall SD, Brater DC. The effect of salicylate, ibuprofen and naproxen on the disposition of methotrexate in rheumathoid arthritis. Eur J Clin Pharmacol . 1992;42:121–5. doi: 10.1007/BF00278469. [DOI] [PubMed] [Google Scholar]
- 21.Stewart CF, Fleming RA, Arkin CR, Evans WE. Coadministration of naproxen and low-dose methotrexate in patient with rheumathoid arthritis. Clin Pharmacol Ther . 1990;47(4):540–6. doi: 10.1038/clpt.1990.69. [DOI] [PubMed] [Google Scholar]
- 22.Ahern M, Booth J, Loxton A, McCarthy P, Meffin P, Kevat S. Methotrexate kinetics in rheumatoid arthritis: is there an interaction with nonsteroidal antiinflammatory drugs? J Rheumatol . 1988;15(9):1356–60. [PubMed] [Google Scholar]
- 23.Combe B, Edno L, Lafforgue P, Bolgona C. Total and free methotrexate pharmacokinetics, with and without piroxicam, in rheumatoid arthritis patients. Br J Rheumatol . 1995;34:421–8. doi: 10.1093/rheumatology/34.5.421. [DOI] [PubMed] [Google Scholar]
- 24.Wiland P, Wiela-Hojenska A, Glowska A, Chlebicki A, Hurkacz M, Orzechowska-Juzwenko K. et al. Renal function in rheumatoid arthritis patients treated with methotrexate and infliximab. Clin Exp Rheumatol . 2004;22(4):469–72. [PubMed] [Google Scholar]
- 25.Wiland P, Swierkot J, Szechiński J. N-acetyl-beta-D-glucosaminidase urinary excretion as an early indicator of kidney dysfunction in rheumatoid arthritis patients on low-dose methotrexate treatment. Br J Rheumatol . 1997;36:59–63. doi: 10.1093/rheumatology/36.1.59. [DOI] [PubMed] [Google Scholar]
- 26.Saito M, Uechi Y, Nakabayashi K, Kitamoto K, Nagasawa T. Clinical significance of microalbuminuria in patients with rheumatoid arthritis. Nihon Jinzo Gakkai Shi . 1993;35(7):815–21. [PubMed] [Google Scholar]
- 27.Iqbal MP, Ali AA, Waqar MA, Mehboobali N. Urinary N-acetyl-beta-D-glucosaminidase in rheumatoid arthritis. Exp Mol Med . 1998;30(3):165–9. doi: 10.1038/emm.1998.24. [DOI] [PubMed] [Google Scholar]
- 28.Svendsen KB, Ellingsen T, Bech JN, Pfeiffer-Jensen M, Stengaard-Pedersen K, Pedersen EB. Urinary excretion of alpha-GST and albumin in rheumatoid arthritis patients treated with methotrexate or other DMARDs alone or in combination with NSAIDs. Scand J Rheumatol . 2005;34(1):34–9. doi: 10.1080/03009740510017977. [DOI] [PubMed] [Google Scholar]
- 29.Wiland P, Szechiński J. N-acetyl-beta-D-glucosaminidase enzymuria as an indicator in monitoring the therapy of some rheumatic diseases with potentially nephrotoxic drugs. Arch Immunol Ther Exp (Warsz) . 1994;24(4):331–6. [PubMed] [Google Scholar]
- 30.Wiland P, Wiela-Hojeńska A, Swierkot J, Hurkacz M, Orzechowska JK, Szechiński J. Renal tubular dysfunction in patients with rheumatoid arthritis starting with low dose of methotrexate. Pol Arch Med Wewn . 2003;110:855–62. [PubMed] [Google Scholar]
- 31.Zafirovska KG, Bogdanovska SV, Marina N, Gruev T, Lozance L. Urinary excretion of three renal tubular enzymes in patients treated with nonsteroidal anti-inflammatory drugs (NSAID) Ren Fail . 1993;15:51–4. doi: 10.3109/08860229309065572. [DOI] [PubMed] [Google Scholar]
- 32.Arnett FC, Edworthy SM, Bloch DA, McShane DJ, Fries JF, Cooper NS. et al. The American Rheumatism Association 1987 revised criteria for the classification of rheumatoid arthritis. Arthritis Rheum . 1988;31:315–24. doi: 10.1002/art.1780310302. [DOI] [PubMed] [Google Scholar]
- 33.van Gestel AM, Prevoo ML, van ‘t Hof MA, van Rijswijk MH, van de Putte LB, van Riel PL. Development and validation of the European League Against Rheumatism response criteria for rheumatoid arthritisComparison with the preliminary American College of Rheumatology and the World Health Organization/International League Against Rheumatism Criteria. Arthritis Rheum . 1996;39(1):34–40. doi: 10.1002/art.1780390105. [DOI] [PubMed] [Google Scholar]
- 34.Prevoo ML, van ‘t Hof MA, Kuper HH, van Leeuwen MA, van de Putte LB, van Riel PL. Modified disease activity scores that include twenty-eight-joint countsDevelopment and validation in a prospective longitudinal study of patients with rheumatoid arthritis. Arthritis Rheum . 1995;38:44–8. doi: 10.1002/art.1780380107. [DOI] [PubMed] [Google Scholar]
- 35.Balsa A, Carmona L, González-Álvaro I, Belmonte MA, Tina X, Sanmartí R. Value of DAS-28 and DAS 28-3 as compared to ACR-defined remission in rheumatoid arthritis. J Rheumatol . 2004;31:40–6. [PubMed] [Google Scholar]
- 36.Prevoo ML, van Gestel AM, van T Hof MA, van Rijswijk MH, van de Putte LB, van Riel PL. Remission in a prospective study of patients with rheumatoid arthritisAmerican rheumatism association preliminary remission criteria in relation to the disease activity score. Br J Rheumatol . 1996;35:1101–5. doi: 10.1093/rheumatology/35.11.1101. [DOI] [PubMed] [Google Scholar]
- 37.Bakker AJ. Bakker AJImmunoturbidimetry of urinary albumin:Prevention of adsorption of albuminInfluence of other urinary constituents. Clin Chem . 1988;34(1):82–6. [PubMed] [Google Scholar]
- 38.Elving LD, Bakkeren JAJ, Jansen MJH, De Kat Angello, De Nobel E, Van Munster PJJ. Screening for microalbuminuria in patients with diabetes mellitus: frozen storage of urine samples decreases their albumin content. Clin Chem . 1989;35(2):308–10. [PubMed] [Google Scholar]
- 39.Spasovski D, Gruev T, Marina N, Calovski J, Percinkova S, Osmani B. et al. The diagnostic value of N-acetyl-b-D-glucosaminidase and microalbumin concentrations in rheumatoid arthritis. Journal of Medical Biochemistry . 2007;26(4):300–8. [Google Scholar]
- 40.Kaloyanides GJ, Pastoriza-Munoz E. Aminoglycoside nephrotoxicity. Kidney International . 1980;18:571–82. doi: 10.1038/ki.1980.175. [DOI] [PubMed] [Google Scholar]