Abstract
Satellite-based measurements of atmospheric trace gases loading give a realistic image of atmospheric pollution at global, regional, and urban level. The aim of this paper is to investigate the trend of atmospheric NO2 content over Romania for the period 1996–2010 for several regions which are generally characterized by different pollutant loadings, resulting from GOME-1, SCIAMACHY, OMI, and GOME-2 instruments. Satellite results are then compared with ground-based in situ measurements made in industrial and relatively clean areas of one major city in Romania. This twofold approach will help in estimating whether the trend of NO2 obtained by means of data satellite retrievals can be connected with the evolution of national industry and transportation.
1. Introduction
Nitrogen dioxide (NO2) is a trace gas with important impact on atmospheric chemistry and human health. NO2 is created by both natural and anthropogenic (human) processes. Natural sources of NO2 are lightning and microbial activity in soil by the oxidation of ammonium nitrate while the main anthropogenic sources of NO2 are surface transport, power generation, industrial processes, air transport, and biomass burning [1]. Tropospheric NO2 has a relatively short lifetime of the order of hours to days, depending on season, latitude, and altitude [2, 3]. However, high concentrations can be found close to emission sources.
The first global results about NO2 observed from space were presented after the launching of GOME-1 (Global Ozone Monitoring Experiment) instrument aboard ERS-2 satellite [4]. These were followed by results from other satellite instruments: SCIAMACHY (SCanning Imaging Absorption spectroMeter for Atmospheric CHartographY) in 2002 aboard Envisat [5], OMI (Ozone Monitoring Instrument) in 2004 aboard EOS-Aura [6], and GOME-2 aboard MetOp [7]. The retrieval method is based on the measurements of solar radiation reflected by the atmosphere and surface of Earth in nadir view (GOME-1, OMI, and GOME-2) or limb-nadir view (SCIAMACHY). Some characteristics of each instrument are presented in Table 1.
Table 1.
Instruments aboard satellites used in the analysis.
| Instrument | Start date | End date | Horizontal resolution | Global coverage | Bucharest overpassing time/UTC |
|
| |||||
| GOME-1 | 04/1996 | 06/2003 | 320 × 40 km2 | 3 Days | 08:45–09:45 |
| SCIAMACHY | 07/2002 | 12/2010 | 60 × 30 km2 | 6 Days | 08:20–09:20 |
| OMI | 10/2004 | 12/2010 | 13 × 24 km2 | 1 Day | 10:15–12:30 |
| GOME-2 | 04/2007 | 12/2010 | 80 × 40 km2 | 1 Day | 08:55–09:45 |
Recent studies based on measurements from space show that daily, weekly, or seasonal NO2 variations in various industrialized parts of world, which hereafter will be called “hot spots,” can be detected with satellite-borne instruments. Due to the increasing horizontal resolution of satellite instruments, information about the magnitude and life-time of various hot spots can be acquired [8]. Space-borne measurements offer also information about long-range transports of pollutants through the atmosphere [9]. Satellite observations can be used for detecting daily or weekly variability at urban level. Ordóñez et al. in [10] compared GOME-1 measurements with in situ ground-based measurements converted to boundary layer columns around Milan, Italy, and found a very good agreement for relatively low polluted areas. Zyrichidou et al. in [11] compared results over 32 locations from the South-Eastern Europe and concluded that discrepancies exist between various satellite measurements due to the different local overpass times of each satellite, horizontal resolution, and local NO2 diurnal variability.
Beirle et al. [2] and Boersma et al. [12] observed a significant reduction of tropospheric NO2 on Sundays for Europe, USA, and Japan, Using GOME-1, respectively SCIAMACHY and OMI measurements, Beirle et al. [2] and Boersma et al. [12] observed a significant reduction of tropospheric NO2 on Sundays for Europe, USA and Japan. Decreases of tropospheric NO2 columns on free days (according to various societal regulations or religious beliefs, i.e., Saturdays in Israel and Fridays in Islamic countries) were observed also in the Middle East. No weekly cycle was observed in China, for instance, due to the superimposition of different economic, cultural, and religious backgrounds [12]. In the same paper [12], the seasonal variation observed from SCIAMACHY and OMI sensors using in situ surface measurements in Israeli cities was analyzed. The NO2 surface concentration was converted in boundary layer columns and it was found that some differences between satellite data exist; the NO2 content estimated by SCIAMACHY was lower than that by OMI measurements with up to 40% during the summer.
The trend of tropospheric NO2 at continental and regional level using the satellite measurements was analyzed in [13] using GOME and SCIAMACHY data for 1996–2006. A significant reduction in NO2 was observed for Europe and Eastern United States while China, Iran, and Russia are characterized by strong increases [13–15]. In [16], the effects of economic downturn from China for 2008-2009, visible in tropospheric concentrations of NO2 detected from space, are presented. Emissions from international shipping detected from space were presented in [17], based on SCIAMACHY data from the navigable sector of the Red Sea.
In this paper, the NO2 trend for the period 1996–2010 over Romania is analyzed, using available satellite measurements by GOME-1, SCIAMACHY, OMI, and GOME-2. Different satellite data are compared for seven locations with various levels of pollution: high, medium, and low. Particularities of each location are considered, together with seasonal characteristics, in order to evaluate the causes and consequences of differences between the satellite data. In the second part of the paper, a detailed analysis is presented for the capital of Romania, Bucharest, which is the largest city of Romania. Ground-based data are presented and compared with results of satellite observations.
2. Methodology and Data
The seven representative cities of Romania selected for the present analysis are Bucharest, Rovinari, Timisoara, Iasi, Galati-Braila (considered as one urban agglomeration, since they are very closely located, practically inside one satellite pixel), Covasna, and Bistrita and are listed in Table 2. They have different NO2 pollution levels (low, medium, and high) and are located in different regions, thus covering a large part of the country (Figure 1). The NO2 loading in Romania, with a tropospheric monthly mean VCD (vertical column density) of about 11 × 1015 molecules/cm2 (as given by OMI for Bucharest), is two times smaller than in other polluted areas such as the central and eastern parts of China, Eastern Coast of USA, or Western Europe, as shown in [14, 16].
Table 2.
Coordinates and pollution level for selected cities.
| City | Latitude (°N) | Longitude (°E) | Pollution level |
|---|---|---|---|
| Bucharest | 44.436 | 26.127 | High |
| Rovinari | 44.912 | 23.162 | High |
| Timisoara | 45.749 | 21.227 | Med |
| Iasi | 47.162 | 27.588 | Med |
| Galati-Braila | 45.439 | 28.003 | Med |
| Covasna | 45.850 | 26.183 | Low |
| Bistrita | 47.133 | 24.483 | Low |
Figure 1.
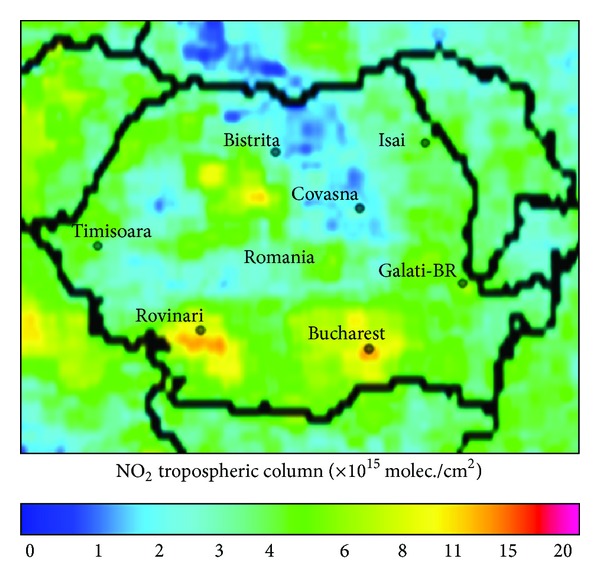
Spatial distribution of the selected cities using a NO2 OMI map (December 2005).
Monthly means of tropospheric NO2 VCD derived from four satellite instruments (GOME-1, SCIAMACHY, OMI, and GOME-2), collected between 1996 and 2010 (Table 1), were used for the present study. These are based on slant column NO2 retrievals with the DOAS technique [18]. Slant columns from GOME, SCIAMACHY, and GOME-2 observations are derived by BIRA-IASB, the slant columns from OMI by KNMI/NASA. The description of retrieval of the tropospheric column can be found in [19–21]. For this study, we use tropospheric NO2 columns available from the Tropospheric Emission Monitoring Internet Service (http://www.temis.nl) version 1 for satellite instruments.
The investigation was limited to the city areas based on the approximate geometrical centre of the city, in tetragons of 0.25°. To remove the possible effects of different spatial resolutions, loadings given by OMI, with a smaller spatial resolution (0.125°), were converted into larger grids to meet GOME-1, SCIAMACHY, and GOME-2 horizontal resolution. In the second part of the paper, which focuses on a detailed analysis made for a major city (Bucharest), in situ measurements of NO2 at ground level were compared to satellite measurements. NO2 concentrations in Bucharest city are recorded by eight monitoring stations equipped with chemiluminescence detectors. The locations of the monitoring stations are represented in Figure 2 and are grouped in traffic monitoring, industrial monitoring, and urban, suburban, and rural monitoring. The in situ NO2 measurements used in this work represent the monthly average of the daily observations from the monitoring stations presented in Figure 2.
Figure 2.
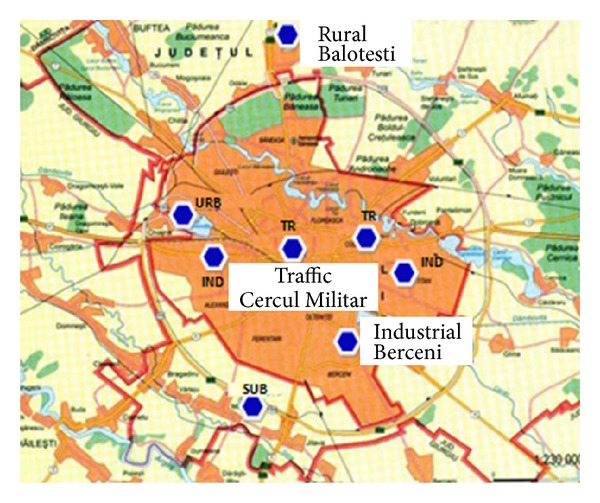
Locations of in situ monitoring stations in Bucharest.
3. Results
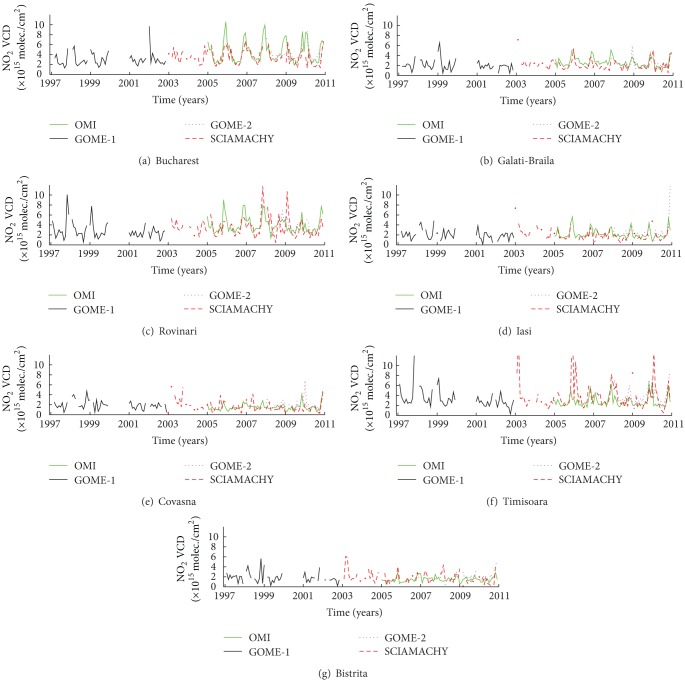
Time series of monthly means of tropospheric NO2 columns derived from all satellite instruments for each city are shown in Figure 3. All satellite measurements indicate that the tropospheric NO2 column varies strongly with season, with minimum values during the summer and maximum values during the winter. Differences between seasons are due to both natural and anthropogenic causes. In [2], the lifetime of tropospheric NO2 is estimated to be 6 hours during the summer and 18–24 hours during the winter. The lifetime of NO2 increases when the temperature decreases and photolysis is slow. The anthropogenic contribution is higher during the winter due to heating and increased energy production.
Figure 3.
Time series of NO2 loading for all cities, for the entire period when satellite observation is available (1997–2010), using data from GOME, SCIAMACHY, OMI, and GOME-2.
Important gaps exist in GOME-1 measurements; thus, we will focus on SCIAMACHY, OMI, and GOME-2 data. All three satellites display the seasonal variation, which varies from point to point, function of pollution. The highest differences between cold and warm seasons are seen for cities with industrial activities and/or intense traffic, classified in this study as cities with high or medium pollution (Table 2).
Satellite results mostly agree, but there are also important differences especially for high loadings. An interesting observation is that OMI shows almost constantly higher values than the other two satellites during the winter only in Bucharest. Using in situ measurements, possible explanations will be presented in Section 4. The lowest loadings are observed in Bistrita and Covasna, while the highest loadings are seen in Rovinari and Bucharest. GOME-1 measurements are absent in 2000 everywhere. There is no clear trend in any of the time series. Some increase in NO2 loadings can be seen in Bucharest, which are probably caused by increased industrial activity and not by traffic, as we will show later. The main NO2 source in Rovinari is a power plant producing electricity and heating using fossil fuel. The production of electricity at Rovinari power plants is directly influenced by the demand of electricity, which reflects on NO2 emissions. The seasonal variation is influenced by the emission that resulted from the demand of electricity on the peak zone. Possible sources of NO2 in Galati-Braila and Iasi (Figures 3(d) and 3(e)) are an iron and steel factory, a power plant, and the traffic. The latter is relatively low (about one-third) in comparison with Bucharest. The number of vehicles in the cities of Galati-Braila is approximately 300.000 pieces while the vehicles number in Bucharest exceeds 1 million pieces, according to [22]. The seasonal variation exists but it is smaller (200%) than that in the previous two cities. Winter values are around 3-4 × 10¹⁵ molec./cm2, while summer values vary between 1 and 2 × 10¹⁵ molec./cm2. In these cases, the seasonal variation might be attributed mostly to NO2 lifetime, since no clear decreasing trend is observed in any of the time series, although activities from metallurgical industry from these cities have decreased year by year.
Covasna and Bistrita are small cities close to mountains but are considered to be rural because of missing industries and low traffic. The difference between the NO2 loadings in summer and winter is smallest because NO2 production in winter is due solely to fossil fuel (coal and wood) utilization at individual scale for heating buildings and houses. In comparison with other locations, these two cities present the smallest NO2 values and all instruments show similar values.
Figure 3 shows that the best data set is provided by the OMI instrument, with continuous measurements over a long time period (2005–2010); thus, OMI measurements should be used for assessing possible effects of point sources. This is due to a better resolution of the instrument (Table 1), continuous monitoring (no data gaps). Also, the retrieval algorithm is different. Data are obtained from GOME-2 and SCIAMACHY measurements using the retrieval algorithm calculated by KNMI/BIRA while OMI data sets are obtained using the DOMINO retrieval algorithm developed by KNMI [19, 20]. The differences between retrieval algorithms used in OMI and SCIAMACHY/GOME-2 are based on spectral fitting characteristics of NO2 retrievals. Since superimposed satellite data are not very informative, due to them being different in many cases, OMI measurements were selected for a more detailed analysis.
The monthly variation of the NO2 column measured with OMI over the seven selected cities is shown in Figure 4. Maximum values in winter reach 2.5 × 10¹⁵ molec./cm2 in clean areas and can go up to 10 × 1015 molec./cm2 in Bucharest. In summer, NO2 loading values are between 0.7 × 10¹⁵ molec./cm2 in clean areas and 2 × 10¹⁵ molec./cm2 in polluted regions. The seasonal variation of the NO2 column is clear at each site but is the highest at regions where the pollution level is high (500% in polluted areas versus 250% in clean areas). The lifetime of tropospheric NO2 varies by about 300% from summer to winter [23]; thus, one may assume that in clean areas only a small percentage of the seasonal change is due to increased fossil-based emissions.
Figure 4.
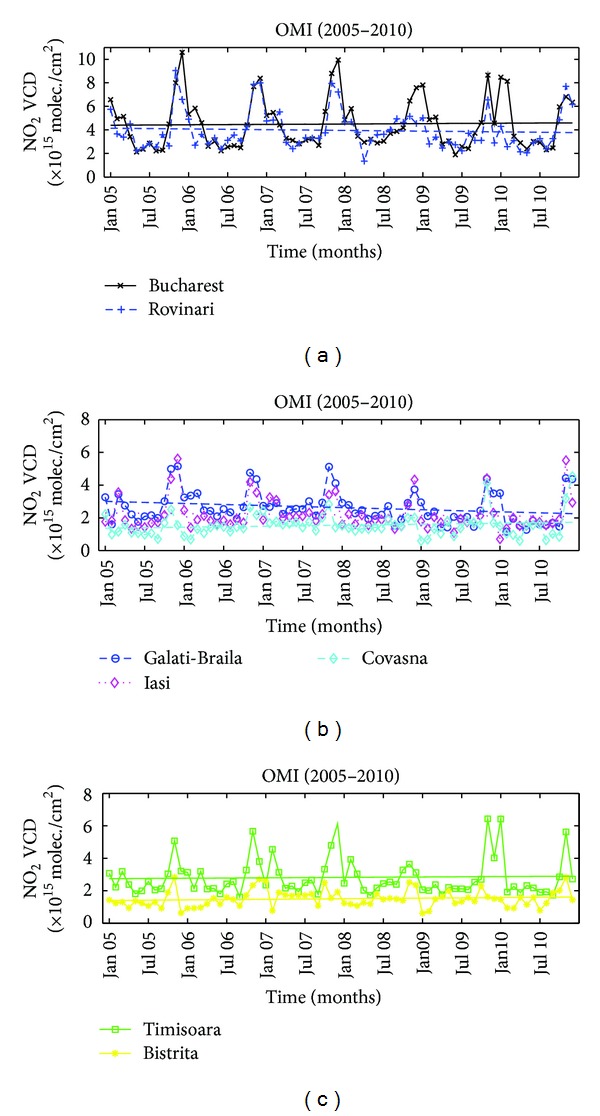
NO2 time series obtained with the OMI instrument over selected cities.
Interestingly, the NO2 concentration is significantly lower in the winter of 2009 for all locations in the central and western part of Romania, regardless of the pollution level. This is not seen in the south and eastern part, that is, in Bucharest, Iasi, and Galati-Braila. This might suggest that the cause relates to some particular weather characteristics that affected the lifetime of NO2, possibly abnormally high temperatures on the western/central side.
There is no clear trend in the observed time series; the variation is relatively small and there is no indication of any clear correlation with the pollution level. The differences are relatively small and cannot be associated with anthropogenic or natural causes. Peaks in concentrations are reached in late autumn/early winter (November-December) at all locations while flat minima are seen during summer.
4. Discussions
A relatively large scatter of satellite measurements is observed, especially during winter and/or for high concentrations. The difference between different satellite measurements is shown in Figure 5 for the period 2003–2011, in order to check whether the scatter varies with time, depending on the season or on the pollution level. GOME-1 data set is excluded because of the large data gaps and of the impossibility of achieving a comparison with other instruments. If the difference between satellite measurements is due to the different overpass time or to the horizontal resolution of each instrument, some repeatability should be observed, at least for high-level pollution area, where, generally, OMI should see higher values since the resolution is better. Large pixels in SCIAMACHY or GOME-2 data can introduce smoothing effects.
Figure 5.
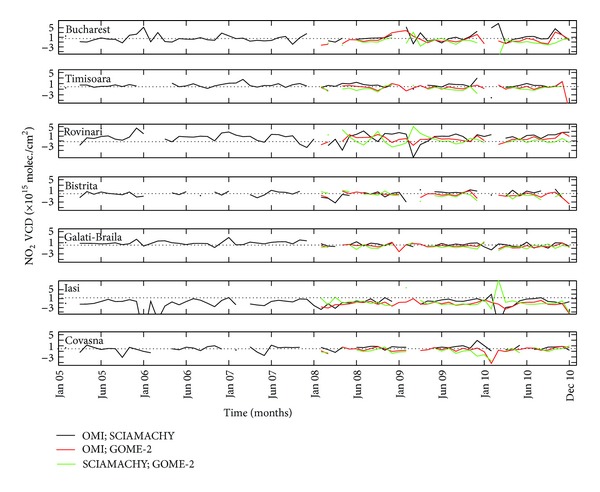
The differences between NO2 satellite measurements over all selected locations.
This is, indeed, the case for Bucharest and, partly, for Timisoara, Galati-Braila, and Rovinari. In the latter three cases, OMI measurements are also relatively high, but for a smaller percentage of time. Instances when the other two satellites show higher values are few. The differences between satellite measurements of the NO2 concentration in Bucharest can be larger than 2 × 10¹⁵ molec./cm2, especially in winter. One explanation could be that the OMI sensor passes over Bucharest around noon, when strong pollution episodes occur from industrial activities and/or traffic. The other two instruments see Bucharest 3 hours earlier, that is, in the morning. Thus, high values of NO2 loadings in SCIAMACHY or GOME-2 indicate that strong pollution events occurred during the previous night. This is seen sometimes in Rovinari, in 2008 and 2009, and in Iasi, Bistrita, and Covasna. Probably these results are connected with increased production of heating and electricity during winter in the evening/night. Since the lifetime of NO2 is longer in the winter, the two instruments could see higher NO2 loadings in the morning. However, an explanation for the differences between SCIAMACHY and GOME-2 is not straightforward, since both instruments have the same time of the pass, similar pixel size, and the same retrieval algorithm. In summer, due to the strong photochemical processes reducing the NO2 lifetime and to a decreased emission rate, values shown by the OMI sensor should be smaller than or equal to those given by the other two satellites. This is indeed seen during summers, especially in Bucharest.
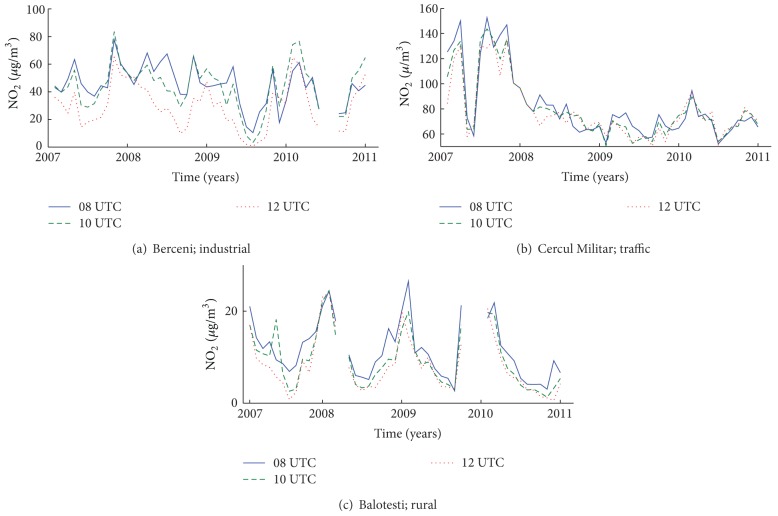
The main atmospheric pollution sources in Bucharest are heavy traffic and power plants using fossil fuel (~50%). Yearly, the variations of NO2 concentration measured in situ at three particular times of the day (8 UTC, 10 UTC, and 12 UTC) in Bucharest are shown in Figure 6 for several locations (industrial urban, rural, and traffic). Power plants in Berceni (industrial station, Figure 6(a)) create a strong accumulation of NO2 in winter, which has a peak in the morning. This coincides with the NO2 variation seen by OMI over Bucharest. Since the OMI sensor has the finest resolution pixel, a late overpass, and a different algorithm calculation, it is the closest to the in situ values for regions where strong NO2 point sources exist.
Figure 6.
Daily variation of NO2 in three locations with different types of NO2 sources: industrial (power plant), urban (mainly traffic), and rural (no important source).
Results of traffic monitoring stations look different; the diurnal variation during the satellites overpass is small because the intense traffic is a constant NO2 source (Figure 6(b)) during 08–12 UTC. Since traffic pollution in Bucharest is high and the differences between the three curves are not important, we can assume that higher concentrations seen by OMI over Bucharest relate to industrial emissions. NO2 produced by traffic dropped significantly, from about 140 μg/m3 to about 70–80 μg/m3, in 2008. NO2 maxima are generally observed in spring and autumn while during winter and summer the traffic seems to be reduced. This is another indication of the fact that none of the three instruments correctly reproduces NO2 originating from traffic.
Correlation coefficients between OMI data and in situ data at the three stations, at three moments of the day, were calculated and are shown in Table 3. Obviously, NO2 caused by traffic is not correctly evaluated by OMI. Interestingly, the best correlation (0.76) exists for the in situ measurements at 12 UT, which is exactly the time when OMI passes over Bucharest. This is also seen in Figure 7, where OMI and in situ measurements are plotted. There is an almost hand-in-hand variation of the two time series; all departures from the seasonal variation shown by in situ measurements are mirrored in OMI results.
Table 3.
Correlation coefficients (top) between OMI and in situ measurements of the NO2 observations and their significance (bottom) for three locations: rural, industrial, and traffic.
| Correlation coefficients between OMI and in situ measurements | ||
|---|---|---|
| Balotesti 8 UTC-OMI R = 0.6422 P = 0.0001 |
Balotesti 10 UTC-OMI R = 0.6171 P = 0.0001 |
Balotesti 12 UTC-OMI R = 0.6512 P = 0.0001 |
|
| ||
| Berceni 8 UTC-OMI R = 0.5641 P = 0.0001 |
Berceni 10 UTC-OMI R = 0.7257 P = 0.0001 |
Berceni 12 UTC-OMI R = 0.7644 P = 0.0001 |
|
| ||
| Cercul 8 UTC-OMI R = 0.0342 P = 0.8173 |
Cercul 10 UTC-OMI R = 0.0797 P = 0.5900 |
Cercul 12 UTC-OMI R = 0.1581 P = 0.2833 |
Figure 7.
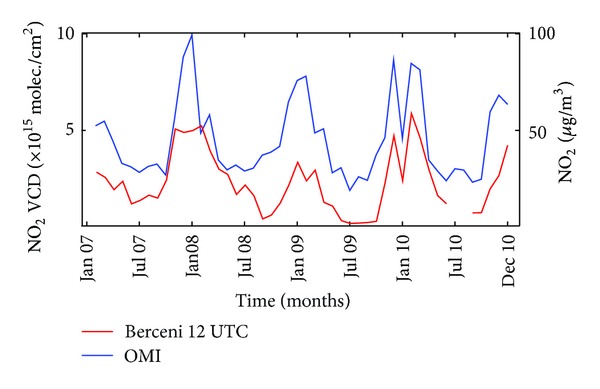
Comparison between OMI observations and in situ measurements for the Berceni (industrial) area in Bucharest at 12 UTC.
In order to see whether satellite-based measurements of NO2 concentration might depend on the time of satellite pass, correlation coefficients between NO2 concentrations measured at each of the eight monitoring stations on an hourly basis, on one hand, and the three available satellite estimations, on the other hand, are plotted as a function of the local time in Figure 8. The stations are classified as follows: traffic monitoring (tr), industrial (ind), urban (u), suburban (s), and rural (r). Only significant correlations (P < 0.05) are shown. Some of the correlations vary with the local time, but the maxima of correlations are not always located at the time of satellite pass, as one would expect.
Figure 8.

Diurnal variation of significant correlation (P < 0.05) between local, in situ, measurements and corresponding satellite records. Coloured rectangles point to the local time when the satellites pass over Bucharest: SCIAMACHY (light red) and GOME-2 at 11 LT (light magenta) and OMI at 13 LT (light green).
Figure 8 shows that satellite measurements are good indicators for rural/urban areas, which have a reduced pollution level. Also, the satellite instruments could be used for the evaluation of industrial emissions. Opposingly, NO2 originating from traffic is not well depicted by satellites. The correlation between in situ and satellite measurements seems to be the best for GOME-2 over most of the stations. OMI measurements (green line) correlate well with in situ measurements in urban and rural areas but also for industrial areas (Berceni), while GOME-2 provides good estimates for traffic and industrial activities. A part of the correlation is certainly due to the seasonal effect, but this should not contribute too much since in situ variations (see Figure 6) are much noisier than satellite data, especially for industrial locations.
5. Conclusions
In this paper, we have analyzed the temporal and spatial characteristics of the NO2 concentration measured by satellite instruments over Romania, at seven different locations, which are representative for various pollution levels. The maximum monthly mean concentration of tropospheric NO2 over Romania between 1997 and 2010 was about 11 × 1015 molec./cm2 and was recorded by OMI over Bucharest city in December 2006. The minimum monthly value, less than 1 × 10¹⁵ molec./cm2, was recorded by OMI over the mountain regions where Bistrita and Covasna cities are located.
We show that measurements with satellite instruments can provide valid information about the variation or trend in NO2 atmospheric pollution over different urban areas with different levels of atmospheric pollution. Seasonal variation is higher for polluted areas but is clear for all locations. Differences between satellite measurements are sometimes important and relate, most likely, not only to the type of NO2 source (industrial, traffic, and urban activities) but also to the difference in pixel size and in the time of the pass. Careful analysis of these differences might help in identifying the most probable source of NO2 at tropospheric level at a particular location, taking into account the NO2 lifetime, which is strongly connected with the environmental temperature. NO2 loadings in OMI measurements are generally higher than those provided by SCIAMACHY and GOME-2 especially over highly polluted areas, where the NO2 source has a diurnal variation. Opposingly, the latter measurements indicate higher values of the NO2 concentration above locations with low industrial activity where the main NO2 source is housing heating using fossil fuels.
Correlation analysis suggests that the OMI sensor can reasonably detect NO2 variation in industrial areas (i.e., caused by big power plants or other factories (steel factories)). Due to its pixel (13 × 24 km2) and time pass, the OMI sensor does not evaluate correctly the NO2 pollution caused by traffic. All satellites seem to be good indicators for the NO2 level in rural, nonpolluted areas.
There is no clear NO2 trend in any of the seven time series. Important increases or decreases in the NO2 concentration do exist and are, most likely, linked to local natural and anthropogenic particular conditions.
Conflict of Interests
The authors declare that there is no conflict of interests regarding the publication of this paper.
Acknowledgments
The authors acknowledge the free use of tropospheric NO2 column data from the GOME, SCIAMACHY, and OMI sensor from http://www.temis.nl. Daniel-Eduard Constantin's work for this study was supported by the Grant SOP HRD/107/1.5/S/76822 TOP ACADEMIC cofinanced from the ESF of EC, Romanian Government, and University Dunarea de Jos of Galati. Mirela Voiculescu was partly supported by Project PN-II-ID-PCE-2011-3-0709, SOLACE of the Romanian NPRDI-II, UEFISCDI.
References
- 1.Lee DS, Köhler I, Grobler E, et al. Estimations of global NOx emissions and their uncertainties. Atmospheric Environment. 1997;31(12):1735–1749. [Google Scholar]
- 2.Beirle S, Platt U, Wenig M, Wagner T. Weekly cycle of NO2 by GOME measurements: a signature of anthropogenic sources. Atmospheric Chemistry and Physics. 2003;3:2225–2232. [Google Scholar]
- 3.Jaeglé L, Jacob DJ, Wang Y, et al. Sources and chemistry of NOx in the upper troposphere over the United States. Geophysical Research Letters. 1998;25(10):1705–1708. [Google Scholar]
- 4.Burrows J, Weber M, Buchwitz M, et al. The global ozone monitoring experiment (GOME): mission concept and first scientific results. Journal of the Atmospheric Sciences. 1999;56(2):151–175. [Google Scholar]
- 5.Bovensmann H, Burrows JP, Buchwitz M, et al. SCIAMACHY—mission objectives and measurement modes. Journal of the Atmospheric Sciences. 1999;56(2):127–150. [Google Scholar]
- 6.Levelt PF, Hilsenrath E, Leppelmeier GW, et al. Science objectives of the ozone monitoring instrument. IEEE Transactions on Geoscience and Remote Sensing. 2006;44(5):1199–1208. [Google Scholar]
- 7.Munro R, Eisenger M, Anderson C, et al. GOME-2 on Metop. Proceedings of the EUMETSAT Meteorological Satellite Conference; 2006; Helsinki, Finland. EMETSAT; p. p. 48. [Google Scholar]
- 8.Leue C, Wenig M, Wagner T, Klimm O, Platt U, Jähne B. Quantitative analysis of NOx emissions from Global Ozone Monitoring Experiment satellite image sequences. Journal of Geophysical Research. 2001;106(6):5493–5505. [Google Scholar]
- 9.Wenig M, Spichtinger N, Stohl A, et al. Intercontinental transport of nitrogen oxide pollution plumes. Atmospheric Chemistry and Physics. 2003;3(2):387–393. [Google Scholar]
- 10.Ordóñez C, Richter A, Steinbacher M, et al. Comparison of 7 years of satellite-borne and ground-based tropospheric NO2 measurements around Milan, Italy. Journal of Geophysical Research Atmospheres. 2006;111(5)D05310 [Google Scholar]
- 11.Zyrichidou I, Koukouli ME, Balis DS, et al. Satellite observations and model simulations of tropospheric NO2 columns over south-eastern Europe. Atmospheric Chemistry and Physics. 2009;9(16):6119–6134. [Google Scholar]
- 12.Boersma KF, Jacob DJ, Trainic M, et al. Validation of urban NO2 concentrations and their diurnal and seasonal variations observed from the SCIAMACHY and OMI sensors using in situ surface measurements in Israeli cities. Atmospheric Chemistry and Physics. 2009;9:3867–3879. [Google Scholar]
- 13.van der A RJ, Eskes HJ, Boersma KF, et al. Trends, seasonal variability and dominant NOx source derived from a ten year record of NO2 measured from space. Journal of Geophysical Research. 2008;113(4)D04302 [Google Scholar]
- 14.Richter A, Burrows JP, Nüß H, Granier C, Niemeier U. Increase in tropospheric nitrogen dioxide over China observed from space. Nature. 2005;437:129–132. doi: 10.1038/nature04092. [DOI] [PubMed] [Google Scholar]
- 15.van der A RJ, Peters DHMU, Eskes H, et al. Detection of the trend and seasonal variation in tropospheric NO2 over China. Journal of Geophysical Research. 2006;111(12)D12317 [Google Scholar]
- 16.Lin J-T, McElroy MB. Detection from space of a reduction in anthropogenic emissions of nitrogen oxides during the Chinese economic downturn. Atmospheric Chemistry and Physics. 2011;11(15):8171–8188. [Google Scholar]
- 17.Richter A, Eyring V, Burrows J, et al. Satellite measurements of NO2 from international shipping emissions. Geophysical Research Letters. 2004;31(23)L23110 [Google Scholar]
- 18.Platt U. Differential optical absorption spectroscopy (DOAS) In: Sigrist M, editor. Air Monitoring by Spectrometric Techniques. New York, NY, USA: John Wiley & Sons; 1994. pp. 27–84. [Google Scholar]
- 19.Boersma KF, Eskes HJ, Brinksma EJ. Error analysis for tropospheric NO2 retrieval from space. Journal of Geophysical Research. 2004;109(4):20 pages.D04311 [Google Scholar]
- 20.Boersma KF, Eskes HJ, Veefkind JP, et al. Near-real time retrieval of tropospheric NO2 from OMI. Atmospheric Chemistry and Physics. 2007;7:2103–2118. [Google Scholar]
- 21.Blond N, Boersma KF, Eskes HJ, et al. Intercomparison of SCIAMACHY nitrogen dioxide observations, in situ measurements and air quality modeling results over Western Europe. Journal of Geophysical Research. 2007;112(10)D10311 [Google Scholar]
- 22. Direction for Driving License and Vehicle Registration, Romania, http://www.drpciv.ro/info-portal/changeLanguage.do?lang=ro.
- 23.Lamsal LN, Martin RV, van Donkelaar A, et al. Indirect validation of tropospheric nitrogen dioxide retrieved from the OMI satellite instrument: insight into the seasonal variation of nitrogen oxides at northern midlatitudes. Journal of Geophysical Research. 2010;115(5)D05302 [Google Scholar]


