

Abstract
Escolar (Lepidocybium flavobrunneum, family Gempylidae) are large and darkly coloured deep-sea predatory fish found in the cold depths (more than 200 m) during the day and in warm surface waters at night. They have large eyes and an overall low density of retinal ganglion cells that endow them with a very high optical sensitivity. Escolar have banked retinae comprising six to eight layers of rods to increase the optical path length for maximal absorption of the incoming light. Their retinae possess two main areae of higher ganglion cell density, one in the ventral retina viewing the dorsal world above (with a moderate acuity of 4.6 cycles deg−1), and the second in the temporal retina viewing the frontal world ahead. Electrophysiological recordings of the flicker fusion frequency (FFF) in isolated retinas indicate that escolar have slow vision, with maximal FFF at the highest light levels and temperatures (around 9 Hz at 23°C) which fall to 1–2 Hz in dim light or cooler temperatures. Our results suggest that escolar are slowly moving sit-and-wait predators. In dim, warm surface waters at night, their slow vision, moderate dorsal resolution and highly sensitive eyes may allow them to surprise prey from below that are silhouetted in the downwelling light.
Keywords: deep-sea vision, eye, escolar, visual ecology, visual sensitivity, visual resolution
1. Introduction
The ocean is the largest habitat on the Earth, covering almost three-quarters of the Earth's surface and encompassing a living space that is over two orders of magnitude larger than all of the open countryside and airspace found in terrestrial habitats combined [1]. Even though the great majority of marine animals inhabit the bright epipelagic upper layers (down to 100 m), a sparse but varied fauna—including arguably our most bizarre life forms—inhabit the dark depths of the sea. Surprisingly, many of these animals depend heavily on vision for the crucial daily tasks of orientation, avoiding predators and finding food and mates [2]. In the twilight zone of the mesopelagic depths—where the intensity of downwelling daylight progressively falls until it becomes too faint for vision at around 1000 m—visual adaptations are at their most varied, testament to the predictable change in the intensity, direction and colour of light with depth as well as to the changing nature of the visual scene [3]. In the vast and dark bathypelagic zone beyond 1000 m, the only lights that can be seen are the rare and usually tiny sparks of bioluminescence produced by other animals. Nonetheless, bathypelagic animals frequently have well-developed eyes for their detection.
To understand the visual ecologies of deep-sea animals is not an easy task. Even with the use of modern research submersibles, few have ever been encountered in their natural habitat. If brought to the surface from deep trawls, deep-sea animals (if alive at all) rarely survive long enough to investigate their visual behaviour or physiology. Thus, most of our understanding of visual ecology in deep-sea animals has come by studying the optics and morphologies of their eyes, an approach pioneered and championed in deep-living crustaceans by Prof. Michael Land, whose 70th birthday we celebrate here. By revealing how an eye is built, its sensitivity to light, which opsins it possesses and in which directions it most densely samples visual space, it is possible to infer the visual world of the eye's owner, an approach that has previously been used to great effect. The massive eyes of the giant squid (Architeuthis dux) are a case in point. These huge animals, inhabiting the inky depths at around 1000 m, have eyes whose size and morphology predict that they have evolved for more or less a single visual task—the early detection of the nebulous cloud of bioluminescence triggered in planktonic animals by the swimming of the squid's chief predator, the sperm whale [4]. Here, we continue this approach by investigating the visual ecology of a large deep-sea fish—the escolar, Lepidocybium flavobrunneum (figure 1a)—that we were fortunate to catch during three scientific cruises of the NOAA research vessel Oscar Elton Sette in 2004, 2005 and 2006 (where we were principally engaged in a project investigating the vision of the swordfish, Xiphias gladius). Unlike most other deep-sea fishes caught on research vessels, escolar (and most importantly their visual tissues) could be kept alive for several hours with suitable care, enabling incredibly rare physiological investigations of deep-sea visual function. Previous to this, the few physiological investigations of vision in deep-sea animals have, to our knowledge, only been made in crustaceans (e.g. the work of Tamara Frank and colleagues) and in a single study on the lantern fish Stenobrachius leucopsarus [5].
Figure 1.

The escolar and its eyes. (a) The escolar L. flavobrunneum. Photo courtesy of Kent Larsson (http://hem.passagen.se/kent.andersson). Scale bar, 20 cm. (b) An excised eye. A slit (sl) is made in the eye to indicate the dorsal orientation. i, iris; p, pupil. Scale bar, 10 mm. (c) Frozen cross section made with a saw through the eye in a dorsal–ventral orientation showing the internal dimensions of the eye. c, cornea; ch, choroid; l, lens; r, retina; s, sclera; v, vitreous body. Scale bar, 10 mm. (Online version in colour.)
Escolars are large benthopelagic fish from the family Gempylidae (the snake mackerels), which are mostly found over continental slopes in tropical and temperate seas at depths from 200 to 500 m (and possibly deeper). They can reach a length of about 2 m (with lengths up to 1.5 m being common [6,7]) and are voracious predators, feeding on squid, fishes (bramids, coryphaenids, scombrids, trachipterids, etc.) and crustaceans. Their body colour is dark-brown to black indicating escolars are well camouflaged in mesopelagic lighting [8]. They are also known to migrate upwards towards the ocean surface at night, and are thus captured by long-line fishing gear [6]. Although escolars have rather oily meat with a pungent flavour and a reputation for inducing diarrhoea and nausea (which has led to its banning in several countries), they are often sold for human consumption (particularly in Asia). Nevertheless, these fishes are considered to be ‘rare and rather mysterious’ [9] and to be highly vulnerable to overfishing (www.fishbase.org). But with several escolar unexpectedly at our disposal, we took the opportunity to study the optics, morphology and visual physiology of their eyes with the aim of gaining insight into the visual ecology of these elusive creatures.
2. Material and methods
(a). Animals and preparation
Specimens were caught south of the Hawaiian Islands, as well as in waters around Palmyra Atoll and Johnston Atoll, aboard the United States National Oceanographic and Atmospheric Administration (NOAA) research vessel Oscar Elton Sette in May 2004, February 2005 and February 2006 using standard long-line fishing gear. The line was set at night and retrieved the following morning. Fish were quickly sacrificed by direct brain destruction (pithing) and the eyes were collected immediately after death. Weight, fork length and ocular dimensions (including the diameter of the lens, pupil and eyecup) were recorded for all fishes. The cornea and lens were removed and the eyes were either submerged in a 2% paraformaldehyde/2% glutaraldehyde fixative (pH 7.4) for anatomical studies, or the retinas were removed surgically and used for electrophysiological recordings.
(b). Electrophysiology
The methods used for visual electrophysiology at sea have been fully presented elsewhere [10]. In short, within 20 min of sacrificing the fish, a large piece of retina (ca 1 cm2), with the vitreous still attached, was placed onto a sponge bathed in Flourinert (FC-77, a 3M product). Flourinert is a non-toxic, inert solution with a high oxygen absorption capacity and a high thermal conductivity that is often used in physiological experiments. Isolated retinae continued to respond to light stimuli for several hours under these conditions. The retina, stimulus light source and electrode apparatus were enclosed in an earthed light-tight metal box in order to maintain a dark-adapted state between stimulus presentations. The Flourinert was circulated using a peristaltic pump (MityFlex, WPI). The retina was mounted on a temperature-controlled plate in the base of the metal box through which the Flourinert was pumped and heated (or cooled). In this fashion, it was possible to precisely control the temperature of the retinal piece between 10°C and 26°C, although in most experiments it was difficult to cool the retina below 12–14°C. Temperature was measured at the surface of the sponge using the probe of a Comark N9008 digital thermometer.
Multi-unit electrophysiological measurements were recorded extracellularly using Ag–AgCl electrodes. The recording electrode was placed onto the photoreceptor layer of the retina while the second electrode (used as a ground) was placed in the vitreous below the retina. After this preparation was completed, the retina was left to dark-adapt for at least 20 min before running the experiment.
Electroretinogram (ERG) responses were amplified using a battery-powered DAM 50 differential amplifier (World Precision Instruments). The analogue signals passed through a Humbug 60 Hz noise eliminator (Quest Scientific) and were converted to digital signals by a DAQCard-1200 Data Acquisition Card (National Instruments) running in the PC-card slot of a Macintosh G3 PowerBook. Data acquisition and stimulus generation were controlled by the DAQCard-1200 using software written in LabVIEW 5.1 (National Instruments).
Light stimulation was achieved using a 5 cm wide circular array of 12 bright white light emitting diodes (LEDs) (light output 7000 mcd each). These LEDs were mounted behind a thin diffuser and a collimating lens to provide a broad, even illumination field. An analogue output channel on the DAQCard-1200 drove the LEDs using a sinusoidal voltage whose mean (offset) level and amplitude could be varied between 0 and 5 V. The current provided by the analogue output was insufficient to drive the 12 LEDs, and a separate battery-powered current amplifier was used to supplement it. Flickering was achieved by modulating the light sinusoidally between a minimum intensity of Imin and a maximum intensity of Imax. The contrast of the sinusoidal signal was (Imax − Imin)/(Imax + Imin), and its offset (Imax − Imin)/2. Calibrations revealed that the light stimulus had a perfectly sinusoidal output and, at full intensity, an intensity of 1.64 × 10³ cd m−2.
(i). Method for determining the flicker fusion frequency
The retina was stimulated with the sinusoidal light stimuli at frequencies that varied in logarithmic steps (0.2 log units) from 0.16 to 63.1 Hz (i.e. from −0.8 to 1.8 in log units—see figure 6b). The contrast of the sinusoidal light stimulus had a value of 1, meaning that the offset and amplitude of the sine wave were always equal. At each frequency, the flickering light stimulus was presented for 5 s, followed by 5 s of darkness. This was repeated five times, and the responses were averaged.
Figure 6.

The method used for determining the FFF. (a) An example of a power spectrum obtained at 23°C from the averaged retinal response to a moderately bright sinusoidal light stimulus modulated at 1 Hz. Note the strong power peak at 1 Hz. (b) An example of how the power of the response signal and the response noise vary as a function of stimulus frequency in escolars (responses obtained at 23°C and at a higher stimulus light level). FFF is defined as the frequency where the power of the signal falls to five times the power of the noise (dashed line). Signal and noise power spectra are calculated for all eight escolars used in the electrophysiological study. Error bars are standard deviations. (Online version in colour.)
The FFF was determined by analysing the power spectrum of the averaged response resulting at each stimulus frequency. The power spectrum reveals the dominant frequency components present within the response. If the ERG is clearly able to follow the sinusoidal modulation of the stimulus light, its response will be modulated at the same frequency (figure 7), and a strong peak will appear in the power spectrum at this frequency (figure 6a). The amplitude of a peak thus reflects the relative magnitude, or power, of the frequency relative to all the other frequencies present in the response. For each stimulus frequency, the amplitude of the corresponding peak in the power spectrum was calculated. The power at the stimulus frequency (signal) was next compared to the standard deviation of the power of a neighbouring frequency section (noise). The criterion for FFF was defined as the frequency at which the power of the signal was five times larger than the power of the noise (as defined in figure 6b). This is admittedly an arbitrary criterion and other signal-to-noise ratios could arguably be used (e.g. signal = noise, or signal = 10 × noise). However, in practice we found this criterion gave a conservative estimate of FFF—we could not ourselves discern a notable modulation in retinal response beyond this stimulus frequency.
Figure 7.

Raw retinal response curves recorded in a single escolar at high stimulus light levels at different stimulus frequencies and at different retinal temperatures (12°C left, 23°C right). Note that the response amplitude declines with increasing frequency and decreasing temperature, with distinguishable responses at 2.51 Hz (but not at 3.98 Hz) at 12°C and at 6.31 Hz (but not at 10 Hz) at 23°C. (Online version in colour.)
(ii). Flicker fusion frequency at different temperatures and light intensities
The response to sinusoidal light stimuli at each stimulus frequency was recorded for a series of increasing mean light intensities that varied over a 7 log unit range in 1 log unit steps (using KODAK WRATTEN neutral density filters placed in front of the lamp—figure 8). At each intensity, FFF was determined as explained above. FFF was first recorded using the sinusoidal light stimulus at different intensities within retinal temperature ranges of 10–15°C and 20–25°C. Even though the goal of the experiment was to record at both temperature ranges in each retinal preparation, in practice this was rarely possible owing to the difficulty in cooling the retina rapidly enough to ensure maximal retinal health throughout the experiment. Recordings were typically made at either of the two temperature ranges in a given individual, although in rare preparations (in which retinal health remained intact) it was possible to record at both.
Figure 8.

FFF as functions of light intensity and temperature. (a) Mean FFF as a function of light level obtained at two different retinal temperatures: 23 ± 2°C (n = 8) and 12 ± 2°C (n = 6). Error bars are standard deviations. (b) Critical fusion frequency (CFF) values obtained at different temperatures in 13 individuals. (Online version in colour.)
(iii). Whole mounting for ganglion cell distribution
The method used for whole mounting and counting of ganglion cells was according to methods described in previous studies [11–13].
Before dissection, the eyes were washed at least three times in phosphate buffer for removal of fixative. The retina was carefully removed from the eyecup and separated from the choroid and vitreous body using forceps. The retina was mounted with the ganglion cell layer pointing upwards onto a glass slide covered in Gatenby's gelatin solution. Radial cuts were made into the retina to decrease folding. Another slide was put on top and the assembly was left to dry overnight. A moist environment was provided to prevent the retina from cracking. Before staining, the upper slide was removed and the retina was treated with acetic acid to help the staining process.
Cresyl violet (0.1% concentration) was applied multiple times using a pipette, for up to 1 h per retina. The preparation was air-dried and excessive stain was removed by a series of 70, 90 and 100% ethanol. The retina was cleared in xylene before finally being covered in DPX mounting media and coverslipped.
To create a map of each retina, the silhouette of the retina was magnified and traced onto paper using an overhead projector. Ganglion cell counts were made using a Zeiss Axiophot Photomicroscope. Counts were made every 4 mm using a 20× objective except in high-density areas where counts were made every 1 mm using a 40× objective, adding up to some 280 points counted per retina. All cells in the ganglion cell layer were counted except for a population of small, darkly stained, rounded cells. These cells were easily separated from the ganglion cells (figure 4) and were presumed to be ‘displaced’ amacrine cells ([14]; S. P. Collin 2004, personal communication). Initial counts were made that included these supposed amacrine cells and these counts indicated that they were about ten times as numerous as the ganglion cells, similar to their frequency in the retina of the deep-sea fish Lampanyctus macdonaldi [14]. This is however a rough approximation because it was made only at a few locations in the retina. Even though we are confident that the small cells are displaced amacrine cells, we cannot be absolutely certain. Retrograde labelling of the retina would have allowed a more reliable identification of the various cell types, however the methods required are significantly more complex and would have been exceedingly difficult (or impossible) to perform at sea with the infrastructure available to us.
Figure 4.

The ganglion cell layer of a Cresyl violet stained retina, as seen through the microscope. Both ganglion cells (GC) and displaced amacrine cells (AC) are visible. Scale bar, 25 µm. (Online version in colour.)
Ganglion cell densities were mapped onto the retinal drawing and isodensity lines were drawn manually. Eyes were also prepared and mounted for photoreceptor counts, but the tight and layered packing and small cell size in this species made these counts impossible. Owing to the high coverage of axon fibres, a relatively large area in the central retina of the escolar evaded counting. Attempts were made to de-fat the retina with an 80% chloroform and 20% ethanol mix. This has previously proved to be successful, enabling the Cresyl violet stain to penetrate the axon-layer, thus visualizing the ganglion cells (K. A. Fritsches 1998, unpublished data). However, this was not successful in attempts made with escolar retinas. Thus, the thick axon fibres may hide the presence of other high-density ganglion cell areas in the central retina that are not seen in the ganglion cell maps presented here.
(iv). Photoreceptor dimensions
Photoreceptor widths and lengths were measured in samples from two fish. Pieces from six different locations on a fixed retina were mashed up and separated on a glass slide using forceps [13]. The samples were viewed under a microscope using differential interference contrast (DIC) to visualize the photoreceptor cells. Because of the small cell size, it was easy to focus on an entire cell and 20–30 intact cells from each area were photographed using a microscope digital camera system (Olympus DP50).
Measurements of the lengths and diameters of photoreceptor inner and outer segments were facilitated using Image Tool v. 3.0 (freeware, http://ddsdx.uthscsa.edu/ (accessed August 2004)). Assuming that the receptors in the retina are hexagonally packed, these values were used to calculate an approximate photoreceptor density.
(c). Retinal sections
Retinal samples were washed thoroughly with phosphate buffer and post-fixed in 1% OsO4 for 1 h. This was followed by rinsing in 0.15 M sodium cacodylate buffer and dehydration in an ethanol series (50% 5 min, 70% 2 × 10 min, 96% 2 × 10 min and 100% 2 × 15 min) and infiltration in an acetone/Epon plastic series (acetone 2 × 20 min, 2 : 1 acetone/Epon 1 h, 1 : 1 acetone/Epon overnight, pure Epon 6 h). The samples were imbedded in fresh Epon and polymerized at 60°C for 48 h. For light microscopy, semithin (2 µm) sections were made using an LKB Bromma 11800 pyramitome with a glass knife and stained with AzurII-methylene blue.
For transmission electron microscopy (TEM), ultrathin sections (50–70 nm) were cut with a Leica Ultracut UCT ultratome using a diamond knife. The sections were mounted on copper grids and stained with uranyl acetate (3%, 30 min) and lead citrate (1%, 4 min). The sections were viewed with a TEM at 80 kV (JEOL JEM-1230).
(d). Calculations of resolution and sensitivity
The optical sensitivity S of an eye to an extended scene in a mesopelagic deep-sea habitat (where daylight is essentially monochromatic at 480 nm) is given by [15,16]
| 2.1 |
where A is the diameter of the pupil, f the focal length of the eye, and d, l and k the diameter, length and Naperian absorption coefficient of the photoreceptors, respectively. High sensitivity to an extended scene results from a pupil of large area (πA2/4), and photoreceptors each viewing a large solid angle of visual space (πd2/4f2 steradians) and absorbing a substantial fraction of the incident light (1—e−kl). Note that equation (2.1) is simply the product of these three factors.
Because in eyes adapted to dim extended light there is generally a large convergence of photoreceptors onto the underlying ganglion cells, S should be calculated for the ganglion cell matrix (rather than for the photoreceptor matrix). This is because the ganglion cell matrix is the true sampling matrix of the retina [17–19]. In this case, we substitute the diameter of the ganglion cell's dendritic field for d in equation (2.1). Ganglion cells of lower density (with wider receptive fields) imply a greater sensitivity.
As for all deep-sea fish, the escolar are also likely to see point sources of bioluminescence. For this task, the most important features of the eye needed for maximizing sensitivity to a point source is a wide pupil and long, maximally light-absorbent photoreceptors. However, as we argue below, the eyes of escolars, while clearly able to detect bioluminescent point sources, have a construction more optimally suited to viewing dim extended scenes.
In addition to setting the sensitivity, the density of ganglion cells at any given location in the retina also sets the local spatial resolution, or the acuity, of the eye. Taking into account that two ganglion cells are required to resolve one black-and-white stripe pair in a grating pattern, the local acuity of a region in the retina is expressed as [20]
| 2.2 |
where n is the number of ganglion cells mm−2 and α is the angle subtending 1 mm on the retina. This angle is easily calculated from the focal length f in mm (tan α = 1 mm/f). Higher acuity can thus be obtained by an increased density of ganglion cells in the retina, or by making the angle α smaller, that is, by increasing the focal length f, which is equivalent to an increase in eye size.
(e). Measurements of sea temperature
Water temperatures at different depths were collected using a standard conductivity, temperature, depth (CTD) sampler (Sea-Bird Electronics Inc., Bellevue, WA, USA) deployed from the side of the ship with a winch at 15.00 on 4 May 2005. Measurements were made at depth intervals of approximately 25 m down to 1000 m.
3. Results
(a). The escolar eye
The eye, pupil and lens diameters of both the left and right eyes were measured from 25 individuals ranging from 40 to 127 cm in fork length and 1 to 25 kg in body mass (figure 2a). The eyes (figure 1b) scale with body size (figure 2b), and the largest eye we collected was just under 7 cm in diameter with a 27 mm pupil diameter (fish length: 127 cm and weight: 25 kg). Frozen cross sections through the escolar eye reveal the lens is close to spherical (as in most fish, figure 1c). Like the eye, the pupil and lens also scale with body size (figure 2b). Lens diameters range from approximately 12 to 24 mm in 40 to 127 cm fork length fishes, respectively.
Figure 2.

Body size and eye size in escolars. (a) The relationship between fork length and weight in the 25 individuals used for this study. Curve fitted by eye. (b) The relationship between fork length (L) and eye diameter (ED), lens diameter (LD) and pupil diameter (PD) in 25 escolars (data from right and left eye have been pooled). Eye dimensions scale linearly with body length according to the following equations (derived via a linear regression analysis): ED = 0.0366L + 1.943 (r2 = 0.83); LD = 0.0155L + 0.741 (r2 = 0.76); PD = 0.0109L + 0.912 (r2 = 0.73). (Online version in colour.)
A reflective tapetum is located in the choroid, giving the escolar eye a yellow–green eye-shine when viewed in daylight. If present, the retinal tapetum in teleosts is usually situated in the pigment epithelium—a choroidal tapetum is more common in sharks and rays [21]. Nonetheless, a choroidal tapetum is sometimes found in teleost species, one of them being another snake mackerel, the oilfish (Ruvettus pretiosus) [22]. A pigment layer, normally found within the retinal pigment epithelium just behind the photoreceptors, appears to be absent. The absence of pigment has also been recorded in lantern fishes (Myctophidae) that, as escolars, possess a choroidal tapetum [22]. In elasmobranchs with a choroidal tapetum, the pigment epithelium often lacks pigments. The lack of pigment therefore seems to be related to the possession of a choroidal tapetum, and it might be an adaptation for increased sensitivity.
(b). Retinal sections and organization of photoreceptors in the retina
Sections through the retina reveal the organization of its neural elements. The most prominent areas of the escolar retina are the two proximal-most layers, the photoreceptor layer and the outer nuclear layer consisting of photoreceptor nuclei (figure 3a). Both these layers are quite thick and together they make up almost half of the entire thickness of the retina (the remainder comprising the outer plexiform layer, inner nuclear layer, inner plexiform layer and the ganglion cell layer).
Figure 3.

The escolar retina. (a) A sagittal light microscope section through the retina showing the proximal photoreceptor layer, the inner and outer nuclear layers and the distal ganglion cell layer. Light enters the retina from below (via the ganglion cell layer). Scale bar, 30 µm. (b) The photoreceptor layer showing the six to eight layers of rod outer segments in the banked retina. Scale bar, 10 µm. (c) A transmission electron micrograph showing the rod outer segments (OS) and inner segments (IS). Scale bar, 1 µm. (Online version in colour.)
All photoreceptors in the escolar retina were found to be rods (figure 3b,c), with no apparent morphological or size differences between rods throughout the retina. Of almost 300 rods measured (from DIC images), mean rod size (inner and outer segments) was 13.9 ± 1.7 µm long and 1.8 ± 0.2 µm wide. Outer segments (figure 3c) were an average 10.6 ± 1.6 µm in length.
As is common in deep-sea fishes, the rod photoreceptors of the escolar retina are arranged in multiple layers to create a ‘banked’ or ‘tiered’ retina (figure 3b). Banked retinas allow maximum absorption of the incoming light [2] and are thus an adaptation for increased sensitivity in the dim light of the deep sea. The escolar have between six and eight layers of rods in their retinas (figure 3b). Photoreceptor density, assuming mean rod dimensions with a circular outer segment cross-section and hexagonal close packing, indicate that a single layer of the escolar retina possesses 322 000 rods mm−2. Assuming seven rod banks, this translates to approximately 2.25 million rods mm−2 of retina.
(c). Ganglion cell distribution
Counts of retinal ganglion cells, stained with Cresyl violet in whole-mount (figure 4), revealed two high-density areas or areae (figure 5). These are the areas of the retina possessing the highest spatial resolution. The most pronounced area is situated ventrally, viewing the world above the animal. This is also the area of the highest cell density, with around 700 ganglion cells mm−2 (escolar 6). Another area of high density was found temporally, viewing the world in front of the animal. Here, the density is slightly lower at just in excess of 600 ganglion cells mm−2. Ganglion cell counts also showed a slight increase in cell density nasally (reaching more than 400 ganglion cells mm−2). Moreover, the retinas show an overall change in density from low densities dorsally to higher densities ventrally. Both investigated eyes showed similar patterns.
Figure 5.
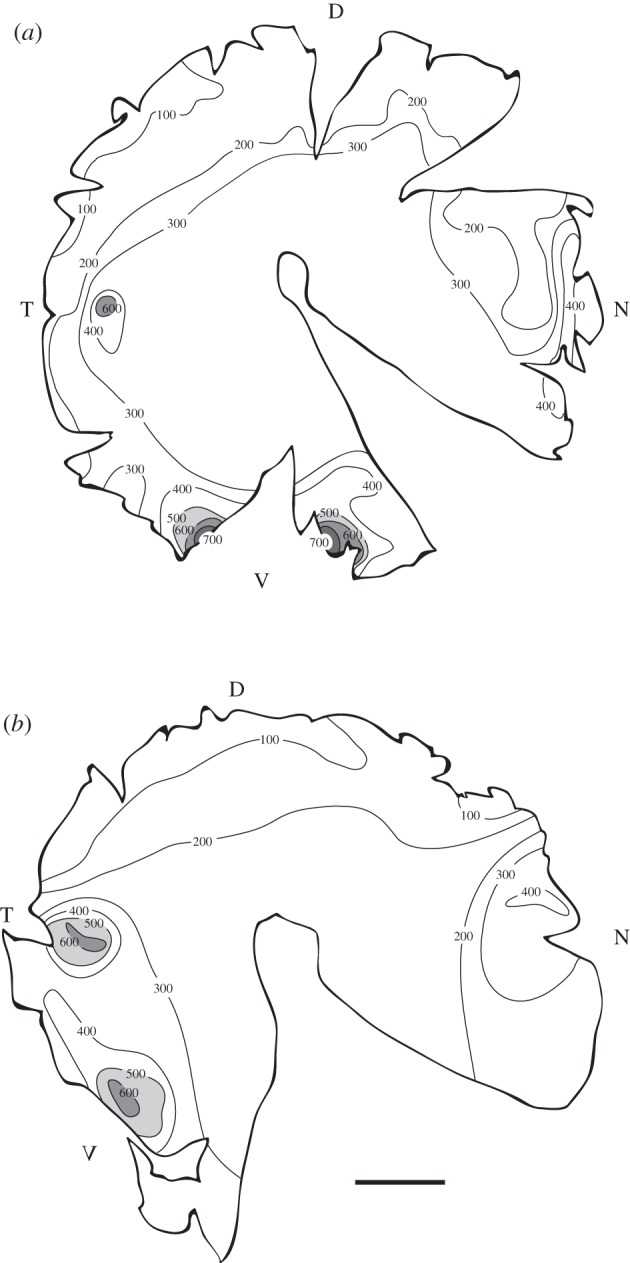
Ganglion cell density maps showing two main high-density retinal areas in (a) the right eye of escolar 6 and (b) the left eye of escolar 12: a ventral area viewing the world above the animal and a temporal area viewing the world in front of the animal. A slight increase in ganglion cell density is also evident in the nasal area of the retina (the region of the retina that views the space behind the fish). All densities are in cells mm−2 of retina. In the central area of the retina, cell counts were not possible owing to a high coverage of axon fibres. Scale bar, 1 cm.
The high density of rods, combined with a very low density of ganglion cells, gives the escolar a convergence ratio of rods to ganglion cells of around 3000 : 1 to 23 000 : 1 in different parts of the retina, depending on the local ganglion cell density. Spatial summation in the escolar eye is thus very high.
(d). The speed of vision at different light levels and temperatures
Using isolated retinal preparations for ERG recordings, we investigated the escolar retina's response to sinusoidal-modulated light stimuli of various intensities and at different retinal temperatures. We found that temperature had a pronounced effect on temporal resolution as measured by the flicker fusion frequency (FFF), the stimulus frequency at which we were no longer able to detect a retinal response to the sinusoidal-modulated light stimulus (defined in figure 6b; greater temporal resolution is equated with a higher FFF). At all temperatures tested, the retina responded with a distinct sinusoidal modulation of response amplitude at the lower frequencies (figure 7). Fusion of the retinal response occurred at lower frequencies at lower temperatures (in the raw responses shown in figure 7, this occurred at about 3 and 8 Hz at 12°C and 23°C, respectively).
At low light intensities, and irrespective of retinal temperature, the escolar FFF is very low, around 1.2 ± 0.6 Hz (figure 8a). At brighter light levels or at higher retinal temperatures (or during both), FFF was higher (figure 8b). At 23°C, FFF increased as light intensity increased, peaking at a light intensity ten times dimmer than the brightest used (after which FFF fell slightly, although the values of FFF at the two brightest light levels do not differ significantly). The peak FFF (known as the critical flicker fusion frequency, CFF) was 8.8 ± 3.3 Hz. The highest FFF ever recorded was 12.8 Hz. At 12°C, FFF increased only slightly as light intensity increased, peaking at around 2.6 ± 1.7 Hz.
(e). The relationship between the speed of vision and depth in the ocean
Measurements of temperature at different depths in the region of the Pacific Ocean where the escolar were caught show that throughout the epipelagic zone down to 100 m temperature is roughly constant at 25°C (figure 9a; also see [7] for similar although somewhat warmer data in an escolar habitat near Cuba). Temperature then falls steadily between 100 and 300 m (to approx. 12°C), after which the decline is less steep (reaching around 6°C at 500 m, and 4.3°C at 1000 m (data not shown)). We can now use the data shown in figure 8b to show how FFF might vary with depth assuming that the temperature of the escolar eye remains at ambient water temperature. We assume that escolars do not maintain elevated brain and eye temperatures as do swordfish, as we have no evidence that they have this ability. In fact, a single measurement taken from the eye of a freshly sacrificed individual indicated the eye temperature to be 25°C, the same temperature as the water from which the fish had only minutes previously been hauled. On a sunny day at epipelagic depths, the speed of vision would be maximal (figure 9b; FFF ≈ 9 Hz). At 300 m (and deeper), the speed of vision would be at its minimum (FFF ≈ 2 Hz). Light levels of course also play a role. At all times of the day, deeper depths bring with them lower light levels and even slower vision (figure 8a); light levels at 300 m are around four orders of magnitude lower than that at the surface. Thus, the lower temperatures and lower light levels found at 300 m ensure that speed of vision at this depth is at its slowest.
Figure 9.

The speed of vision at different temperatures and depths. (a) A CTD cast profile of temperature at different depths in the Pacific Ocean south of the Hawaiian Islands (at the same location where escolars were caught). (b) Visual speed (as specified by the CFF) at different ocean depths. This graph was obtained by converting the temperature-based data shown in figure 8b to equivalent depths using the curve in (a).
4. Discussion
In this study, we investigated the morphology of the escolar eye and measured its spatial and temporal resolution. As we discuss below, our findings suggest that escolar have coarse spatial and temporal vision and high sensitivity to extended scenes, attributes very well adapted for vision in their dim pelagic world. Moreover, our results provide clues as to the type of lifestyle that escolars lead.
(a). Ganglion cell distribution and visual acuity
The distribution pattern of ganglion cells in the retina can be related to the lifestyle and the environment of a species [18]. For instance, fishes inhabiting shallower water that constantly view a sand–water horizon often possess a horizontal band of increased ganglion cell density—a so-called ‘visual streak’ of ganglion cells across the part of the retina viewing this horizon [12].
In the mesopelagic zone, the surrounding world has no such features, and thus escolar lack a visual streak. Instead, this species has adopted two areas of retinal specialization for detecting objects against the dim featureless background: a ventral area viewing the world above them and a temporal area viewing the world in front. It is quite possible that for each of these areas, with one area in each eye, escolar obtain a binocular visual field within the distinct regions viewed by each, thereby improving distance judgement in both the forward and upward directions. Both of these areas are likely to be used in feeding and our results imply that escolar search for prey in the waters above them. A dorsally directed area located in the ventral retina is also a common adaptation in other species of mesopelagic deep-sea fishes, for example hatchet fishes [23,24]. Many of these species have also evolved a dorsally oriented tubular eye shape (with binocular visual fields) to improve the visibility of silhouetted prey swimming above. But this is not the case in escolars, which have eyes placed laterally on the head. A high density of ventral retinal cells has also been found in shallow-swimming fishes such as the salmon (Salmo salar) and the trout (Salmo trutta trutta) [25]. In parr (young fish), this is correlated to their feeding behaviour, which involves hunting insects on the surface.
Compared with other fishes, even many species living in the deep sea, cell counts in the escolar retina reveal very low densities of ganglion cells. The highest ganglion cell density we recorded was around 700 cells mm−2 in the ventral retina of escolar 6 (figure 5), resulting in an acuity of 4.6 cycles deg−1 (table 1; equation (2.2), with α = 2.86° as in this fish f was 20.0 mm). This means that escolar are able to resolve up to 4.6 black-and-white stripe cycles per degree of visual space. Another area of higher acuity is found temporally, viewing the world in front of the animal. Peak density in this area is around 600 ganglion cells mm−2 giving an acuity of 4.4 cycles deg−1. As a comparison, the healthy human eye has an acuity of around 60 cycles deg−1.
Table 1.
Optical sensitivities and acuities in the dorsal and ventral retina. Calculations were made using equations (2.1) and (2.2). For sensitivity calculations, we have assumed that sensitivity is set by the matrix of ganglion cells and that the fraction of light absorbed by the retina (1 − e−kl) is effectively 1. For acuity calculations, we have used the diameter d of the dendritic field of the ganglion cell to calculate the number n of ganglion cells mm−2 used in equation (2.2): n = 4 × 10⁶/πd2 cells mm−2. Calculated sensitivities are maximal values as the true projected area of the (elliptical) pupil supplying light to the dorsal and ventral retina is less than the area of the circular pupil used in the calculation (which is more appropriate for the central retina).
| pupil diameter | focal length | ganglion cell diameter | acuity | sensitivity | ||
|---|---|---|---|---|---|---|
| A | F | d | S | |||
| specimen | location | (mm) | (mm) | (µm) | cycles deg−1 | (µm2 sr) |
| escolar 6 | dorsal | 15.4 | 20.0 | 80 | 2.5 | 2341 |
| ventral | 15.4 | 20.0 | 43 | 4.6 | 676 | |
| escolar 12 | dorsal | 16.0 | 20.7 | 113 | 1.8 | 4707 |
| ventral | 16.0 | 20.7 | 46 | 4.4 | 780 |
Compared with escolar most fishes have much higher peak densities of ganglion cells (commonly 103–105 cells mm−2 [22–24]). This is true for both the shallow-living fishes and most of the mesopelagic deep-sea fishes investigated thus far. However, most of these fishes have much smaller eye diameters than the escolars. Therefore, despite their higher ganglion cell densities, the shorter focal lengths resulting from their smaller eye diameters result in acuities similar to that of escolar. In mesopelagic deep-sea fishes, for instance, acuities in the range of 4.1–9.2 cycles deg−1 are typical [23,24]. Similar low acuities are also found in some small reef teleosts, such as the sabre-toothed blenny (Dasson variabilis) and the Australian frogfish (Halophryne diemensis). Both have visual acuities of around 3–4 cycles deg−1 [20]. These species feed on slow-moving prey however, and as a consequence do not require high resolution of distant objects. More actively hunting fishes inhabiting the reef, and open waters around the reef, have acuities as high as 27 cycles deg−1.
There is however, another very large open-ocean fish that also has a similar acuity: the blue marlin (Makaira nigricans). This species also has low ganglion cell densities, with a peak around 1200 cells mm−2, resulting in an acuity of 8–9 cycles deg−1 [13]. The escolar and the blue marlin seem to adopt a similar strategy, with large eyes, low ganglion cell densities and high spatial summation. The escolar with its even lower ganglion cell densities, have further evolved towards higher sensitivity, thus sacrificing acuity. However, because escolars routinely occupy deeper depths with much dimmer intensities than the blue marlin (which mostly inhabit brightly lit epipelagic waters), improved sensitivity has probably been the overriding pressure on the evolution of their eyes.
(b). Sensitivity
Together with the optical and morphological properties of the eye, the matrix of ganglion cells can also be used to calculate the optical sensitivity S of the eye to an extended source of light (equation (2.1)). This famous equation, first formulated in 1981 by our birthday laureate Prof. Michael Land—in his landmark treatise on the optical designs of invertebrate eyes [16]—is widely used to compare the optical sensitivities of animal eyes.
Let us assume, as is reasonable for fish (figure 2b), that the pupil diameter A is more or less the same as the diameter of the lens. We can also assume that the fraction (1 − e−kl) of monochromatic light absorbed by the six to eight layers of rods in the escolar retina is close to 1. This is very likely to be the case because the rod outer segments have an average length of 10.6 µm, and with seven layers, this results in a total absorption path length of around 74 µm. This length is effectively doubled to 148 µm by the presence of the tapetum. With a typical absorption coefficient k for deep-sea fishes of 0.064 μm−1 [26,27], this leads to 1−e−kl = 0.9999. Thus, assuming that all layers are functional (which they may not be [28]), the banked retina of the escolar can significantly enhance the sensitivity of the eye. Some deep-sea fishes have an enormous number of rod layers in the retina, the most extreme example being the alepochephalid Bajacalifornia drakei with 28 layers in the fovea [29].
Values of S in the ventral and dorsal retina (for escolar 6 and 12) are shown in table 1. The low densities of ganglion cells (and their large dendritic fields summing signals from large numbers of rods) are perfectly suited to provide very high values of optical sensitivity (while not allowing high acuity). These high values are almost entirely owing to the large dendritic fields of the ganglion cells (d in equation (2.1)) and the enormous numbers of rods that converge onto them. The optical properties of the lens play a secondary role. The reason for this lies in a discovery made in 1882 by the German physicist and zoologist Ludwig Matthiessen who showed that the lenses of fish possess a parabolic gradient of refractive index from centre to edge, thereby providing the refractive power of the eye underwater [30]. He also discovered that the focal length (f) is invariably about 2.5 times the lens radius (r), that is f/r ≈ 2.5, a ratio today known as Matthiessen's ratio. The lenses of escolar adhere quite well to this ratio, with f/r ≈ 2.54 [30]. There are exceptions to this rule [31], but in general Matthiessen's ratio holds for most fishes, irrespective of the light levels they inhabit. As when calculating S, we have assumed that the pupil diameter (A) equals the lens diameter (2r), this means that for a generalized fish A = 2 × f/2.5 (from Matthiessen's ratio). Substituting this form of A into equation (2.1) and assuming (1 − e−kl) = 1 reduces the optical sensitivity to a simple general expression for fish: S = π2d2/25 ≈ 0.4d2 µm2 sr. Thus, in fishes the optical sensitivity to an extended source of light is primarily determined by the local dendritic field sizes (d) of the ganglion cells.
As the ganglion cells in escolar have very large dendritic fields and high convergence ratios (as assumed from measured ganglion cell densities), optical sensitivity to an extended source of light is very high. In other fishes, where ganglion cell densities are much greater and dendritic field sizes correspondingly smaller, optical sensitivity will be significantly lower. In the temporal area of a typical epipelagic fish, where ganglion cell densities may reach 105 cells mm2, d may be as small as 4 µm, at least an order of magnitude smaller than that found in the sharpest part of the escolar retina. In such a fish, S ≈ 0.4 × 42 = 6.4 µm2 sr, about 100 times lower than that in escolar. From these calculations, we conclude that the eyes of escolars are evolved for high sensitivity to dim extended scenes rather than for high spatial resolution. Nevertheless, by having such large eyes (and thus long focal lengths), escolars enjoy a rather impressive spatial resolution for this level of sensitivity and they can no doubt see spatial detail very well in their dim pelagic habitat.
Owing to their wide pupils and banks of rods that maximize light absorption, escolars also have high sensitivity to point sources of bioluminescence (which they no doubt see very well). However, to accurately localize these point sources, high spatial resolution is also required. This requirement is fulfilled in bathypelagic deep-sea fishes by the presence of deep convexiclivate foveae [2,3,14]. These foveae, in addition to accurately signalling the direction of point sources, are also likely to be instrumental in determining their range [29]. Despite having quite decent spatial resolution (thanks to their eye size), escolars lack such deep foveae and are probably less accurate in determining the ranges and directions of point sources.
(c). The speed of vision
The speed of vision in the escolar, defined by FFF, has a peak value (CFF) of 8.8 ± 3.3 Hz at 23°C in the brightest light levels used (figure 8). The FFF falls for both lower light levels and lower temperatures. Its peak value in bright light at 12°C is 2.6 ± 1.7 Hz. At the lowest light levels used, FFF was similar at both temperatures: 1.2 ± 0.6 Hz. Compared with other fishes, vision in the escolar is slow and characteristic of animals that need to function in very dim light [32]. In day-active mammals, CFF is typically much higher—in humans, it is approximately 60 Hz [33]. In birds, CFF can be higher still. In chickens and pigeons, CFF is 100 and 143 Hz, respectively [34], the latter being the highest value known in vertebrates [35]. In fishes values of CFF tend to be 40–60 Hz with those species occupying dim light typically having lower values of CFF than those occupying bright-light environments [10,36,37].
Part of the reason for escolar's slow vision is undoubtedly their all-rod retina. Rods are slower than cones and animals with a higher proportion of rods invariably have lower FFFs and slower vision [38,39]. This is simply because the light response kinetics of cones and the second-order cells to which they synapse, are much faster than those of rods [40].
We measured FFF over a temperature range of 10–25°C. These temperatures correspond well to temperatures found in the upper 300 m of the ocean habitat occupied by escolars (figure 9a). Therefore, during the day, escolars probably occupy low temperatures (possibly as low as 5°C) and very dim light. Under these conditions, they are likely to have FFF ≈ 1–2 Hz. At night, when they migrate towards the surface [7], light levels will still be dim (although on moonlit nights it could be reasonably bright), but the temperature will be approximately 25°C. Therefore, because of the elevated temperature and higher light levels provided by moonlight, the FFF of escolar when close to the surface at night may be greater than that during the day. However, even on a clear night lit by a full moon, light levels near the surface will still be six orders of magnitude lower than that at midday. As the brightest light level we could achieve with our lamp (ca 1600 cd m−2) corresponded to intensities 10 times lower than those at midday, this means that moonlight intensities occur at a log light intensity value of around −5 in figure 8a. At this intensity—even at higher temperatures—escolars have an FFF ≈ 2 Hz. Thus, even in the warmer surface waters at night, the escolars’ visual speed will still be undeniably slow. Thus, neither during the day nor during the night is the escolar eye optimal for seeing fast-moving objects, for example squid.
An interesting comparison can be made to the eyes of swordfish. Similar to escolars [7], swordfish remain at 300–700 m during the day, while at night they are close to the surface [41]. Thus, swordfish and escolars both experience similar water temperatures and light levels over the course of a single 24 h day. However, unlike escolars, swordfish have a specialized ocular muscle and circulatory anatomy that result in retinal temperatures significantly above ambient [42]. By contrast, as far as we know, the temperature of the escolar eye is always the same as that of the surrounding water. As the biochemical processes responsible for phototransduction are faster at higher temperatures, the warm eyes of swordfish endow them with faster vision than escolar. In addition, swordfish have a well-developed area in the temporal retina, giving these fish high resolution in the forward visual field (K. A. Fritsches 2005, unpublished data). For the fast-swimming predatory swordfish, warm eyes and a sharp retina turn out to be a distinct advantage—their fast vision allows them to intercept rapidly moving prey at depth during the day [10].
(d). The visual ecology of escolars
So what do our results tell us about the lifestyle of the escolar Lepidocybium flavobrunneum? To summarize, we have found that the eyes of escolar have very high optical sensitivity and low to moderate spatial resolution that is maximal in the ventral retina viewing the dorsal world above the animal. The second area of maximal resolution is in the temporal retina that views the world ahead of the animal. Finally, escolar have low temporal resolution, even when they occupy warm moonlit surface waters at night.
Little is known about the ecology of the escolar or how they capture prey. Nakamura & Parin [6] however state that the escolars feed on various species of deep and shallow fishes, including fast-swimming tunas and mackerels. As it seems unlikely that the escolars can match the maximum swimming speeds of tunas, the high sensitivity and slow visual speed of the eye, together with its enhanced resolution in the dorsal direction, suggest that the escolar may in fact be a sit-and-wait ambush predator (somewhat similar to pike) that slowly patrol the warm surface waters at night in search of prey silhouetted in high contrast against the dim downwelling skylight. Once spotted, escolar might execute a sudden, rapid and accurately directed attack from below. In this scenario, the prey might be unable to see dark-coloured escolar until it is too late to execute an escape manoeuvre. Once an attack is launched, the escolar, with its slow vision, would be unlikely to temporally resolve its victim until intercepted. Another well-known sit-and-wait predator, the nocturnal toad Bufo, has similar slow vision (CFF = 6 Hz [43]). Slower vision would in fact be favoured for improving visual reliability in dim light if the escolars (as the toad) are slowly moving (or stationary) while looking for prey.
We may never know whether the ‘rare and rather mysterious’ escolars truly are slowly cruising predators that ambush their prey from below in the dim warm upper layers of the ocean at night. However, their large and highly sensitive eyes, their slow vision (possibly enhanced in the warm nocturnal surface waters), and their dorsally directed retinal area of maximal resolution all suggest that this could very well be the escolars’ hunting strategy.
Acknowledgements
We are very grateful to NOAA, and to the crew on the Oscar Elton Sette for their help and assistance during the research cruise and while performing experiments at sea. We thank Dr Lenore Litherland, Prof. Ronald Kröger, Carina Rasmussen, Rita Wallén, Prof. Peter Ekström and Pertti Malkki for assisting us with various aspects of the histology and microscopy, and to Dr Rikard Frederiksen for help with the ERG data analysis. We are also very grateful to Kent Andersson for his kind permission to reproduce his image of an escolar used in figure 1a. We are very grateful for the ongoing support of the Swedish Research Council (E.L. and E.W.) and the Australian Research Council (K.F.).
All animal procedures were in accordance with the American Fisheries Society Guidelines for Use of Fish in Research.
References
- 1.Cohen JE. 1994. Marine and continental food webs: three paradoxes? Phil. Trans. R. Soc. Lond. B 343, 57–69. ( 10.1098/rstb.1994.0008) [DOI] [Google Scholar]
- 2.Warrant EJ, Locket NA. 2004. Vision in the deep sea. Biol. Rev. 79, 671–712. ( 10.1017/S1464793103006420) [DOI] [PubMed] [Google Scholar]
- 3.Warrant EJ. 2000. The eyes of deep-sea fishes and the changing nature of visual scenes with depth. Phil. Trans. R. Soc. Lond. B 355, 1155–1159. ( 10.1098/rstb.2000.0658) [DOI] [PMC free article] [PubMed] [Google Scholar]
- 4.Nilsson DE, Warrant EJ, Johnsen S, Hanlon R, Shashar N. 2012. A unique advantage for giant eyes in giant squid. Curr. Biol. 22, 683–688. ( 10.1016/j.cub.2012.02.031) [DOI] [PubMed] [Google Scholar]
- 5.O'Day WT, Fernandez HR. 1976. Vision in the lanternfish Stenobrachius leucopsaurus (Myctophidae). Mar. Biol. 37, 187–195. ( 10.1007/BF00389128) [DOI] [Google Scholar]
- 6.Nakamura I, Parin NV. 1993. FAO species catalogue: snake mackerels and cutlassfishes of the world (families Gempylidae and Trichiuridae). FAO Fish. Synop. 15, 1–136. [Google Scholar]
- 7.Kerstetter DW, Rice PH, Snodgrass D, Prince ED. 2008. Behavior of an escolar Lepidocybium flavobrunneum in the Windward Passage as determined by popup satellite archival tagging. Gulf Caribb. Res. 20, 97–102. [Google Scholar]
- 8.Johnsen S. 2002. Cryptic and conspicuous colouration in the pelagic environment. Proc. R. Soc. Lond. B 269, 243–256. ( 10.1098/rspb.2001.1855) [DOI] [PMC free article] [PubMed] [Google Scholar]
- 9.Smith JLB. 1977. Smith's sea fishes, 5th edn, 4th imp Sandton, South Africa: Valiant Publishers. [Google Scholar]
- 10.Fritsches K, Brill R, Warrant EJ. 2005. Warm eyes provide superior vision in swordfishes. Curr. Biol. 15, 55–58. ( 10.1016/j.cub.2004.12.064) [DOI] [PubMed] [Google Scholar]
- 11.Collin SP, Pettigrew JD. 1988. Retinal topography in reef teleosts. I. Some species with well-developed areae but poorly-developed streaks. Brain Behav. Evol. 31, 269–282. ( 10.1159/000116594) [DOI] [PubMed] [Google Scholar]
- 12.Collin SP, Pettigrew JD. 1988. Retinal topography in reef teleosts. II. Some species with prominent horizontal streaks and high-density areae. Brain Behav. Evol. 31, 283–295. ( 10.1159/000116595) [DOI] [PubMed] [Google Scholar]
- 13.Fritsches KA, Marshall NJ, Warrant EJ. 2003. Retinal specialisations in the blue marlin: eyes built for sensitivity to low light levels. Mar. Freshw. Res. 54, 1–9. ( 10.1071/MF02126) [DOI] [Google Scholar]
- 14.Wagner HJ, Fröhlich E, Negishi K, Collin SP. 1998. The eyes of deep-sea fish II. Functional morphology of the retina. Prog. Ret. Eye Res. 17, 637–685. ( 10.1016/S1350-9462(98)00003-2) [DOI] [PubMed] [Google Scholar]
- 15.Kirschfeld K. 1974. The absolute sensitivity of lens and compound eyes. Z. Naturforsch. 29C, 592–596. [DOI] [PubMed] [Google Scholar]
- 16.Land MF. 1981. Optics and vision in invertebrates. In Handbook of sensory physiology, vol VII/6B (ed. Autrum H.), pp. 471–592. Berlin, Germany: Springer. [Google Scholar]
- 17.Hughes A. 1977. The topography of vision in mammals of contrasting life style: comparative optics and retinal organisation. In Handbook of sensory physiology, vol VII/5 (ed. Crescitelli F.), pp. 613–756. Berlin, Germany: Springer. [Google Scholar]
- 18.Collin SP. 1999. Behavioural ecology and retinal cell topography. In Adaptive mechanisms in the ecology of vision (eds Archer SN, Djamgoz MBA, Loew ER, Partridge JC, Vallerga S.), pp. 509–535. Dordrecht, The Netherlands: Kluwer Academic Publishers. [Google Scholar]
- 19.Peichl L. 2005. Diversity of mammalian photoreceptor properties: adaptations to habitat and lifestyle? Anat. Rec. 287A, 1001–1012. ( 10.1002/ar.a.20262) [DOI] [PubMed] [Google Scholar]
- 20.Collin SP, Pettigrew JD. 1989. Quantitaive comparison of the limits on visual spatial resolution set by the ganglion cell layer in twelve species of reef teleosts. Brain Behav. Evol. 34, 184–192. ( 10.1159/000116504) [DOI] [PubMed] [Google Scholar]
- 21.Douglas RH, Partridge JC, Marshall NJ. 1998. The eyes of deep-sea fish I: lens pigmentation, tapeta and visual pigments. Prog. Ret. Eye Res. 17, 597–636. ( 10.1016/S1350-9462(98)00002-0) [DOI] [PubMed] [Google Scholar]
- 22.Nicol JAC. 1989. The eyes of fishes. Oxford, UK: Oxford University Press. [Google Scholar]
- 23.Collin SP, Hoskins RV, Partridge JC. 1997. Tubular eyes of deep-sea fishes: a comparative study of retinal topography. Brain Behav. Evol. 50, 335–357. ( 10.1159/000113345) [DOI] [PubMed] [Google Scholar]
- 24.Collin SP, Partridge JC. 1996. Fish vision: retinal specializations in the eyes of deep-sea teleosts. J. Fish Biol. 49(Suppl. A), 157–174. ( 10.1111/j.1095-8649.1996.tb06073.x) [DOI] [Google Scholar]
- 25.Ahlbert I-B. 1976. Organization of the cone cells in the retina of salmon (Salmo salar) and trout (Salmo trutta trutta) in relation to their feeding habits. Acta Zool. 57, 13–35. ( 10.1111/j.1463-6395.1976.tb00208.x) [DOI] [Google Scholar]
- 26.Partridge JC, Shand J, Archer SN, Lythgoe JN, van Groningen-Luyben WAHM. 1989. Interspecific variation in the visual pigments of deep-sea fishes. J. Comp. Physiol. A 164, 513–529. ( 10.1007/BF00610445) [DOI] [PubMed] [Google Scholar]
- 27.Warrant EJ, Nilsson D-E. 1998. Absorption of white light in photoreceptors. Vis. Res. 38, 195–207. ( 10.1016/S0042-6989(97)00151-X) [DOI] [PubMed] [Google Scholar]
- 28.Shapley R, Gordon J. 1980. The visual sensitivity of the retina of the conger eel. Proc. R. Soc. Lond. B 209, 317–330. ( 10.1098/rspb.1980.0097) [DOI] [PubMed] [Google Scholar]
- 29.Locket NA. 1985. The multiple bank fovea of Bajacalifornia drakei, an alepocephalid deep-sea teleost. Proc. R. Soc. Lond. B 224, 7–22. ( 10.1098/rspb.1985.0018) [DOI] [Google Scholar]
- 30.Matthiessen L. 1882. Über die Beziehungen, welche zwischen dem Brechungsindex des Kernzentrums der Krystalllinse und den Dimensionen des Auges bestehen. Pflügers Arch. 27, 510–523. ( 10.1007/BF01802978) [DOI] [Google Scholar]
- 31.Kröger RHH, Fritsches KA, Warrant EJ. 2009. Lens optical properties in the eyes of large marine predatory teleosts. J. Comp. Physiol. A 195, 175–182. ( 10.1007/s00359-008-0396-1) [DOI] [PubMed] [Google Scholar]
- 32.Warrant EJ. 2004. Vision in the dimmest habitats on earth. J. Comp. Physiol. A 190, 765–789. ( 10.1007/s00359-004-0546-z) [DOI] [PubMed] [Google Scholar]
- 33.Brundett GW. 1974. Human sensitivity to flicker. Light. Res. Tech. 6, 127–143. ( 10.1177/096032717400600302) [DOI] [Google Scholar]
- 34.Lisney TJ, Rubene D, Rózsa J, Løvlie H, Håstad O, Ödeen A. 2011. Behavioural assessment of flicker fusion frequency in chicken Gallus gallus domesticus. Vis. Res. 51, 1324–1332. ( 10.1016/j.visres.2011.04.009) [DOI] [PubMed] [Google Scholar]
- 35.Dodt E, Wirth A. 1953. Differentiation between rods and cones by flicker electroretinography in pigeon and guinea pig. Acta Physiol. Scand. 30, 80–89. ( 10.1111/j.1748-1716.1954.tb01076.x) [DOI] [PubMed] [Google Scholar]
- 36.McComb DM, Frank TM, Hueter RE, Kajiura SM. 2010. Temporal resolution and spectral sensitivity of the visual system of three coastal shark species from different light environments. Physiol. Biochem. Zool. 83, 299–307. [DOI] [PubMed] [Google Scholar]
- 37.McComb DM, Kajiura SM, Horodysky AZ, Frank TM. 2010. Visual function in predatory fishes from the Indian River lagoon. Physiol. Biochem. Zool. 86, 285–297. ( 10.1086/670260) [DOI] [PubMed] [Google Scholar]
- 38.Horstein GP, Winkelman JE. 1962. Comparison of critical fusion frequency in diurnal and nocturnal retina of vertebrates. Arch. Int. Physiol. Biochem. 70, 660–670. ( 10.3109/13813456209092892) [DOI] [PubMed] [Google Scholar]
- 39.Ordy JM, Samorajski T. 1968. Visual acuity and ERG-CFF in relation to the morphologic organization of the retina among diurnal and nocturnal primates. Vis. Res. 8, 1205–1225. ( 10.1016/0042-6989(68)90028-X) [DOI] [PubMed] [Google Scholar]
- 40.Thoreson WB. 2007. Kinetics of synaptic transmission at ribbon synapses of rods and cones. Mol. Neurobiol. 36, 205–223. ( 10.1007/s12035-007-0019-9) [DOI] [PMC free article] [PubMed] [Google Scholar]
- 41.Takahashi M, Okumara H, Yokawa K, Okazaki M. 2003. Swimming behaviour and migration of a swordfish recorded by an archival tag. Mar. Freshw. Res. 54, 527–534. ( 10.1071/MF01245) [DOI] [Google Scholar]
- 42.Carey FG. 1982. A brain heater in the swordfish. Science 216, 1327–1329. ( 10.1126/science.7079766) [DOI] [PubMed] [Google Scholar]
- 43.Nowak LM, Green DG. 1983. Flicker fusion characteristics of rod photoreceptors in the toad. Vision Res. 23, 845–849. ( 10.1016/0042-6989(83)90051-2) [DOI] [PubMed] [Google Scholar]