

Abstract
We report results from a genome wide association study (GWAS) of five quantitative indicators of behavioral disinhibition: Nicotine, Alcohol Consumption, Alcohol Dependence, Illicit Drugs, and non-substance related Behavioral Disinhibition. The sample, consisting of 7188 Caucasian individuals clustered in 2300 nuclear families, was genotyped on over 520,000 SNP markers from Illumina’s Human 660W-Quad Array. Analysis of individual SNP associations revealed only one marker-component phenotype association, between rs1868152 and Illicit Drugs, with a p-value below the standard genome-wide threshold of 5 × 10⁻⁸. Because we had analyzed five separate phenotypes, we do not consider this single association to be significant. However, we report 13 SNPs that were associated at p < 10-5 for one phenotype and p < 10-3 for at least one other phenotype, which are potential candidates for future investigations of variants associated with general behavioral disinhibition. Biometric analysis of the twin and family data yielded estimates of additive heritability for the component phenotypes ranging from 49% to 70%, GCTA estimates of heritability for the same phenotypes ranged from 8% to 37%. Consequently, even though the common variants genotyped on the GWAS array appear in aggregate to account for a sizable proportion of heritable effects in multiple indicators of behavioral disinhibition, our data suggest that most of the additive heritability remains “missing”.
The ability to efficiently and economically genotype large numbers of single nucleotide polymorphisms (SNPs) spanning the human genome has enabled systematic, hypothesis-free searches for genetic association. The utility and feasibility of the genome-wide association study (GWAS) approach was established in the Wellcome Trust investigation of seven different common inherited diseases (Burton et al., 2007), and the subsequent five years has resulted in the identification of thousands of SNP associations in hundreds of complex phenotypes (Visscher, Brown, McCarthy, & Yang, 2012). The magnitude of the effect associated with any specific genetic variant is, however, characteristically small. Consequently, large samples are required for the reliable detection of association, especially given the multiple testing burden in a GWAS. In the behavioral domain, the number of SNP variants with confirmed associations is modest, perhaps because large-sample consortia built around behavioral phenotypes have not yet achieved the sample sizes that have allowed for the reliable identification of multiple genetic variants associated with phenotypes such as height (Allen et al., 2010) and body mass index (Speliotes et al., 2010).
Here we report a GWAS of multiple phenotypic indicators of behavioral disinhibition. Behavioral disinhibition is a higher-level dimensional construct, which has as its core feature the inability to regulate immediate response inclinations at the expense of long-term gains or losses (Gorenstein & Newman, 1980). There is a substantial and consistent research literature showing that individuals high in behavioral disinibition are at elevated risk for developing a broad array of behavioral disorders including substance use disorders (Sher, Bartholow, & Wood, 2000), externalizing disorders of both childhood (e.g., attention deficit/hyperactivity disorder) (Quay, 1997) and adulthood (e.g., antisocial personality disorder) (Iacono, Malone, & McGue, 2008), and personality markers of impulsivity or sensation seeking (Young, Stallings, Corley, Krauter, & Hewitt, 2000). Behavioral disinhibition is, consequently, hypothesized to represent a higher-level trait that accounts for the substantial comorbidity that exists among substance use disorders and between substance use disorders and externalizing disorders (Krueger, 1999; Vollebergh et al., 2001). Importantly for the research reported here, the familial transmission of behavioral disinhibition disorders appears to owe largely to the transmission of generalized risk; there is limited evidence of disorder-specific familial transmission (Hicks, Krueger, Iacono, McGue, & Patrick, 2004). Moreover, twin studies find that most of the genetic influences on individual behavioral disinhibition disorders can be attributed to genetic influences at the general factor level, with estimates of the heritability of the behavioral disinhibition ranging from 60-80% (K.S. Kendler, Prescott, Myers, & Neale, 2003; Krueger et al., 2002; Young et al., 2000).
Candidate-gene studies also support the existence of common genetic influences on multiple indicators of behavioral inhibition. For example, genetic variation in γ -aminobutyric acid (GABA), the primary inhibitory neurotransmission system, has been implicated in the general addiction process (Krystal et al., 2006). Agarwal et al. (2006) reported that SNPs in the GABRA2 receptor gene were more strongly associated with comorbid alcohol and illicit drug dependence than to either of these disorders alone. Other studies have reported significant associations between GABRA2 and indicators of polysubstance abuse (Corley et al., 2008; Drgon, D’Addario, & Uhl, 2006) and antisocial behavior (Corley et al., 2008; Dick et al., 2006; Dick et al., 2009). Similarly, variation in the gene coding for the cholinergic muscarinic receptor 2 (CHRM2) has been associated with risk for smoking (Mobascher et al., 2010), comorbid alcohol dependence and drug dependence (Dick et al., 2007), and multiple indicators of externalizing psychopathology, including symptom counts for alcohol dependence, illicit drug dependence, childhood conduct disorder, and adult antisocial personality disorder as well as personality indicators of novelty seeking and sensation seeking (Dick et al., 2008).
Within the domain of behavioral phenotypes that fall within the behavioral disinhibition rubric, there have been only a few previous GWAS. Among these phenotypes, the strongest evidence for significant GWAS association is for smoking. Specifically, the number of cigarettes smoked per day has been significantly associated with multiple sequence variants in the cholinergic nicotinic receptor subunit gene cluster on chromosome 15q25.1 (CHRNA5-CHRNA3-CHRNB4)(N. L. Saccone et al., 2010), as well as a second nicotinic subunit cluster on 8p11 (CHRNB3-CHRNA6) (Thorgeirsson et al., 2010) and nicotine-metabolizing enzyme genes on 19q13 (CYP2A6-CYP2B6) (Thorgeirsson et al., 2010). As with most other GWAS findings, the magnitude of the effects underlying these associations is small. Fewer variants have been identified in GWAS of alcohol-related phenotypes as compared to smoking phenotypes. In a meta-analysis including a discovery sample of > 26,000 drinkers and a replication sample of > 21,000 drinkers, only the single variant, rs6943555, in the autism susceptibility candidate 2 gene (AUTS2) was found to be significantly associated with average daily alcohol consumption (Schumann et al., 2011). There have been no confirmed associations from GWAS of forms of substance abuse other than alcohol and nicotine, and while a GWAS of conduct disorder did report four variants that achieved a genome-wide level of significance (i.e., p < 5 × 10⁻⁸) (Dick et al., 2011), those associations have yet to be replicated.
In the present paper we report a GWAS analysis of five factor-analytically derived measures of behavioral disinhibition in a sample of 7188 Caucasian individuals clustered in 4-member families. The five quantitative phenotypes are: alcohol consumption, alcohol dependence, nicotine use, illicit drug use, and non-substance related behavioral disinhibition. Our major goal was to identify variants associated with multiple, rather than a single, phenotype, suggesting that the variant was associated with the core behavioral disinhibition construct.
Methods
Sample
The sample of 7188 individuals clustered in 2300 families was drawn from participants in ongoing longitudinal research at the Minnesota Center for Twin and Family Research (MCTFR). Families consisted of a pair of offspring and their rearing parents, although some members of participating families are not included in the present study because either they did not contribute a DNA sample, did not complete the phenotypic assessment, or did not meet this study’s definition of being of European ancestry (see below). Family type is distinguished by offspring relationship, which is either monozygotic twins, dizygotic twins, full biological siblings, adopted siblings, or mixed siblings with one being biologically related to the parents and the other being an adopted child. The sample included 3852 parents, 2072 women (mean [SD] age = 42.8 [5.3]) and 1780 men (44.9 [5.7]), and 3336 offspring, 1788 women (18.0 [0.8]) and 1548 men (17.9 [0.7]). Because offspring had completed multiple longitudinal assessments, we selected measures for the analysis reported here from the assessment that took place closest to their 17th birthday, so long as that assessment was completed when they were between 16.5 and 21 years old. This allowed us to maximize the size of the offspring sample, while ensuring that the sample used in the current analyses was restricted to Caucasian participants, who constitute > 90% of MCTFR participants. Ethnicity was determined from self-reports and information derived from birth records and confirmed using the results from an Eigenstrat analysis (Price et al., 2006) as described in Miller et al. (2012), which also provides additional details concerning the MCTFR GWAS sample.
Genotyping
The sample was genotyped using Illumina’s Human660W-Quad Array (Illumina, Inc., San Diego, CA) following standard protocol. Of the 561,490 non-intensity SNP markers on the array, 527,829 (94.0%) were retained after eliminating markers that had 1) call rates < 99%, 2) minor allele frequency < 1%, 3) significant deviation from Hardy-Weinberg equilibrium at p < 1e-7, 3) more than two Mendelian inconsistencies across families or more than one mismatch in duplicated samples, 4) an association with participant sex or batch at p < 1e-7, or 5) been identified by Illumina as a bad marker on the array. Samples were eliminated if they had 1) more than 5000 non-calls, 2) low Gen_Call scores, 3) extreme homozygosity or heterozygosity, or 4) failed to have familial relationships or sex confirmed, suggesting a sample mixup. Analysis here is based on the 527,829 autosomal SNPs remaining following these data cleaning steps. Additional details concerning quality control procedures are given by Miller et al. (2012).
Measures
Clinical Phenotypes
GWAS was completed for five composite quantitative clinical phenotypes, which were derived using a hierarchical factor analytic approach as described in Hicks et al. (Hicks, Schalet, Malone, Iacono, & McGue, 2011), which also provides additional details on the development of the clinical phenotypes. The five phenotypes (brief description) are: 1) Nicotine (composite of measures of quantity and frequency of nicotine use and symptoms of nicotine dependence), 2) Alcohol Consumption (composite of measures of alcohol use frequency and quantity), 3) Alcohol Dependence (composite of DSM symptoms of alcohol dependence/abuse and non-diagnostic alcohol-related problems), 4) Illicit Drugs (composite of frequency of use of 11 different drug classes and DSM symptoms of drug dependence), and 5) Behavioral Disinhibition (composite of measures non-substance use behavioral disinhibition including symptoms of conduct disorder and aggression). As expected, the clinical phenotypes were significantly and moderately intercorrelated (ranging from .46 to .71; Supplemental Table S1).
Covariates
Covariates included age, sex, birth year, generation (parent versus offspring), and the two-way interaction between generation and age, birth year and generation, and generation and sex. In addition, in order to account for any residual population structure within the Caucasian sample, the first 10 principal components from an Eigenstrat analysis (Price et al., 2006) of the SNP data were used as covariates. When the clinical phenotypes were regressed on the covariates alone, between 13% and 28% of the variance was accounted for (Table 1). All demographic factors (including two-way interactions) were statistically significant in these regressions. In only a few cases, however, did a principal component from the Eigenstrat analysis add significantly to the prediction, suggesting there was little residual population structure in this Caucasian sample.
Table 1.
Proportion of variance accounted for by covariates, and estimates of variance components (95% CI) from GCTA and biometric analysis of the five covariate-adjusted clinical phenotypes
| Phenotype | Covariates | GCTA | Biometric Estimates | ||
|---|---|---|---|---|---|
| a2 | c2 | e2 | |||
| Nicotine | .13 | .19 (.00, .39) | .55 (.43, .67) | .18 (.06, .29) | .27 (.25, .30) |
| Alcohol Consumption | .28 | .14 (.00, .34) | .49 (.37, .60) | .24 (.13, .34) | .27 (.25, .30) |
| Alcohol Dependence | .24 | .08 (.00, .29) | .70 (.62, .73) | .00 (.00, .07) | .30 (.27, .33) |
| Illicit Drugs | .14 | .37 (.17, .57) | .55 (.45, .67) | .16 (.05, .26) | .28 (.26, .31) |
| Behavioral Disinhibition | .19 | .28 (.08, .48) | .70 (.59, .77) | .05 (.00, .16) | .25 (.23, .28) |
Analysis
SNP-based Tests
Each of the five clinical phenotypes was regressed on each of the 527,828 autosomal SNPs, using the demographic and principal component scores described above as covariates. These regressions were fit using a Rapid Feasible Generalized Least Squares (RFGLS) algorithm, which we developed to efficiently account for the unique familial clustering of the MCTFR data (Li, Basu, Miller, Iacono, & McGue, 2011). Briefly, the RFGLS algorithm takes into account both genetic and environmental contributions to phenotypic similarity among family members by modeling the covariance structure separately in the twin, sibling, and adoptive families. In the regression analysis, the SNP effect was modeled in terms of both an additive effect of the number of minor alleles (i.e., the main effect) and interaction between number of minor alleles and generation (i.e., to determine whether SNP effects differed in the parent and offspring generations.)
Gene-based Tests
The significance of the association of each of the five clinical phenotypes with up to 17,567 autosomal genes was tested using the versatile gene-based test for genome-wide association studies (VEGAS) approach (Liu et al., 2010). For each gene, VEGAS uses as a test statistic the sum of the individual test statistics for SNPs lying within ± 50 kb of the 5’ and 3’ UTR for that gene. To determine the significance level of the observed test statistic, a null distribution is generated using Monte Carlo methods and based on the LD structure of the SNPs within each gene as determined from a reference sample. In our case, we used as the reference the CEU HapMap sample.
Heritable Variance
The total additive heritability for each of the five covariate-adjusted clinical phenotypes was determined through analysis of the twin and adoption data using standard biometric approaches (Neale, Boker, Xie, & Maes, 1999). We also used genome-wide complex trait analysis (GCTA) to estimate the percent of phenotypic variance accounted for by additive effects of all the genotyped SNPs(Yang, Lee, Goddard, & Visscher, 2011). Following standard guidelines, only individuals with coefficients of relationship < .025 were included in the GCTA. Biometric analysis and GCTA was undertaken on the residuals of each of the five clinical phenotypes on the full covariate set described above.
Results
Analysis of Individual SNPs
Main Effects
The familial correlations estimated by RFGLS for the five phenotypes are reported in Supplemental Table 2. Manhattan (Supplemental figures S1 to S5) and Q-Q plots (Supplemental figures S6 to S10) for the tests for additive effects of the 527,828 autosomal SNPs are included with the supplementary material. In the main effects analysis, the genomic inflation factors ranged from 1.01 (for Behavioral Disinhibition) to 1.03 (for Nicotine), suggesting that there is little evidence for stratification effects in the analysis. In total there were 31 SNPS that were associated with one or more of the phenotypes at p < 10-5: 3 for Alcohol Consumption, 5 for Alcohol Dependence, 12 for Illicit Drugs, 8 for Nicotine, and 4 for Behavioral Disinhibition. In 500K tests for each phenotype, we would expect 5 to be significant at this level by chance. The 31 SNPs along with their estimated regression coefficients and associated p-values for each of the five phenotypes are listed in Supplemental Table 3. Of note is that for each of the 31 SNPs the estimated regression coefficient was in the same direction across all 5 phenotypes. Among the 31 SNPS, we identified 13 that were also significant at p < 10-3 for at least two additional phenotypes, suggesting they might be of relevance for the behavioral disinhibition construct. Results for these SNPs are given in Table 2. Only one SNP (rs804292, which maps to the 3’ UTR of NEIL2, a gene involved in DNA repair with no obvious relevance for substance abuse) had a p-value < 10-5 for more than one of the five phenotypes (Alcohol Dependence and Nicotine). Across all the markers and phenotypes, the lowest observed p value was 4.9 × 10⁻⁸ for rs1868152 for the Illicit Drug phenotype. This SNP is more than 30kb downstream of the CRYGS gene on 3q27.3. CRYGS codes for an eye lens protein that has been implicated in cataract formation but has not been previously linked to substance abuse or behavioral disinhibition. Only one of the gene assignments for the top 13 SNPs has any obvious connection with a behavioral phenotype. The marker rs1793257 maps to an intron in OPCML, an opioid binding protein. Genetic variation in OPCML has been associated with depression (Schol-Gelok et al., 2010), although it has been more strongly linked with cancer risk.
Table 2.
SNPs associated with one clinical phenotype at p < E-05 that were also associated with at least one other clinical phenotype at p < E-03.
| Locus Information for Associated SNPs | Alcohol Consumption | Alcohol Dependence | Illicit Drugs | Nicotine | Behavioral Disinhibition | |||||||||||
|---|---|---|---|---|---|---|---|---|---|---|---|---|---|---|---|---|
|
| ||||||||||||||||
| SNP | CHR | BP(Build 37.3) | SNP Class | Gene | MA | MAF | Beta | p | Beta | p | Beta | p | Beta | p | Beta | p |
| rs1296438 | 1p32.3 | 53,937,177 | Flanking 3’ | GLIS1 | G | .26 | 2.05 | 1.3e-2 | .25 | 2.3e-3 | 8.22 | 1.0e-4 | 5.87 | 7.9e-6 | 1.37 | 6.2e-4 |
| rs1298637 | 1p32.3 | 53,958,603 | Flanking 3’ | GLIS1 | A | .26 | 2.11 | 1.1e-2 | .25 | 1.7e-3 | 7.97 | 1.6e-4 | 5.97 | 5.3e-6 | 1.42 | 3.8e-4 |
| rs1368882 | 1p32.3 | 55,107,019 | Flanking 5’ | GLIS1 | A | .38 | 1.84 | 1.5e-2 | .27 | 2.9e-4 | 4.90 | 1.2e-2 | 4.46 | 2.1e-4 | 1.75 | 1.9e-6 |
| rs10926554 | 1q43 | 241,894,086 | Intron | WDR64 | A | .13 | -2.73 | 1.3e-2 | -.35 | 1.0e-3 | -13.13 | 3.3e-6 | -7.02 | 5.9e-5 | -2.00 | 1.8e-4 |
| rs6712333 | 2q37.1 | 231,230,171 | Intron | SP140L | A | .12 | 3.52 | 2.3e-3 | .45 | 6.1e-5 | 9.86 | 8.3e-4 | 8.32 | 5.3e-6 | 1.55 | 5.4e-3 |
| rs7620363 | 3p22.3 | 34,013,205 | Intergenic | A | .35 | -2.62 | 7.1e-4 | -.23 | 2.4e-3 | -6.49 | 1.0e-3 | -4.31 | 4.6e-4 | -1.66 | 9.2e-6 | |
| rs11918665 | 3q27.3 | 186,213,784 | Flanking 3’ | CRYGS | A | .13 | 3.82 | 5.5e-4 | .29 | 7.0e-3 | 15.03 | 1.1e-7 | 6.20 | 4.2e-4 | 1.98 | 2.2e-4 |
| rs1868152 | 3q27.3 | 186,220,063 | Flanking 3’ | CRYGS | A | .12 | 3.81 | 7.0e-4 | .30 | 5.6e-3 | 15.68 | 4.9e-8 | 6.61 | 2.2e-4 | 2.26 | 3.5e-5 |
| rs4440177 | 4q32.2 | 163,243,053 | Intergenic | A | .34 | 2.68 | 6.6e-4 | .35 | 6.3e-6 | 8.15 | 5.3e-5 | 4.42 | 4.1e-4 | 1.23 | 1.3e-3 | |
| rs13259289 | 8p23.2 | 4,110,032 | Intron | CSMD1 | G | .40 | -2.76 | 2.2e-4 | -.25 | 5.3e-4 | -8.68 | 5.9e-6 | -2.85 | 1.7e-2 | -1.45 | 6.4e-5 |
| rs804292 | 8p23.1 | 11,643,915 | 3’ UTR | NEIL2 | G | .23 | -2.88 | 1.1e-3 | -.41 | 1.6e-6 | -9.00 | 6.8e-5 | -6.53 | 3.4e-6 | -1.62 | 1.5e-4 |
| rs1793257 | 11q25 | 12,584,119 | Intron | OPCML | A | .04 | 0.75 | 6.9e-1 | .83 | 7.4e-6 | 14.10 | 3.7e-3 | 7.51 | 1.3e-2 | 3.23 | 4.6e-4 |
| rs4788985 | 17q25.2 | 75,313,335 | Flanking 5’ | SEPT9 | G | .49 | 2.46 | 7.8e-4 | .18 | 1.2e-2 | 8.35 | 8.9e-6 | 4.37 | 1.8e-4 | 1.04 | 3.5e-3 |
Interaction Effects
Manhattan (Supplemental figures S11 to S15) and Q-Q plots (Supplemental figures S16 to S20) for the tests of the interaction of the SNP by generation interaction effect are included with the supplementary material. The interaction effect was significant at p < 10-5 for 28 SNPS: 1 for Alcohol Consumption, 11 for Alcohol Dependence, 8 for Illicit Drugs, 3 for Nicotine, and 5 for Behavioral Disinhibition (Supplemental Table 4). The lowest interaction p value of 4 × 10⁻⁷ was observed for rs11681792 with the Behavioral Disinhibition phenotype. For none of the 28 SNPs did we observe a second interaction effect at p < 10-5 across the 5 phenotypes, but for 4 of the SNPs we did observe two interaction effects at p < 10-3 in addition to the initial test. These 4 SNPs are listed in Table 3. All 4 SNPs showed a similar pattern of interaction that was consistent across the 5 phenotypes; namely that the SNP effect differed in direction between the parent and offspring generation. This is not unexpected, as the test statistic will be maximized when the observed direction of effect is not the same in the two generations, even when the null hypothesis is true. Two of the 4 SNPs are intergenic, and only one mapped near a gene that has been implicated in a behavioral study. The marker rs7968335 is approximately 30K bases downstream of SLC6A15, which has been associated with depression in a previous GWAS (Kohli et al., 2011).
Table 3.
SNPs showing a SNP by Generation interaction effect at p < E-03 for at least two clinical phenotypes.
| rs10037670 | rs2380220 | rs2380222 | rs7968335 | |
|
| ||||
| CHR | 5q33.2 | 6q16.1 | 6q16.1 | 12q21.31 |
|
| ||||
| Base Position (Build 37.3) | 153,791,683 | 96,074,133 | 96,082,116 | 83,748,272 |
|
| ||||
| SNP Class | Flanking 3’ UTR | Intergenic | Intergenic | Flanking 3’ UTR |
|
| ||||
| Gene | GALNT10 | SLC6a15 | ||
|
| ||||
| Minor Allele | G | A | G | A |
|
| ||||
| MAF | .208 | .159 | .160 | .410 |
|
| ||||
| Alcohol Consumption | ||||
| Interaction p value | 2.9E-03 | 4.3E-05 | 5.2E-05 | 6.5E-04 |
| Parent Beta | -0.894 | -1.179 | -1.207 | 0.233 |
| Parent Beta p | 2.7E-02 | 8.1E-03 | 6.6E-03 | 4.8E-01 |
| Offspring Beta | 2.005 | 3.227 | 3.143 | -2.484 |
| Offspring Beta p | 3.0E-02 | 1.6E-03 | 2.1E-03 | 1.1E-03 |
|
| ||||
| Alcohol Dependence | ||||
| Interaction p value | 4.3E-03 | 4.4E-06 | 5.0E-06 | 7.3E-06 |
| Parent Beta | -0.184 | -0.249 | -0.255 | 0.196 |
| Parent Beta p | 4.1E-02 | 1.2E-02 | 9.5E-03 | 7.2E-03 |
| Offspring Beta | 0.164 | 0.370 | 0.359 | -0.251 |
| Offspring Beta p | 6.8E-02 | 3.2E-04 | 3.2E-04 | 6.9E-04 |
|
| ||||
| Illicit Drugs | ||||
| Interaction p value | 3.8E-06 | 3.7E-04 | 3.0E-04 | 1.0E-01 |
| Parent Beta | -5.250 | -3.737 | -3.830 | 1.381 |
| Parent Beta p | 6.6E-03 | 8.0E-02 | 7.2E-02 | 3.8E-01 |
| Offspring Beta | 8.206 | 7.767 | 7.782 | -2.499 |
| Offspring Beta p | 5.2E-04 | 3.1E-03 | 2.8E-03 | 2.0E-01 |
|
| ||||
| Nicotine | ||||
| Interaction p value | 3.5E-04 | 4.6E-04 | 2.5E-04 | 2.0E-01 |
| Parent Beta | -2.089 | -2.445 | -2.722 | 1.3E-02 |
| Parent Beta p | 1.8E-01 | 1.6E-01 | 1.2E-01 | 0.613 |
| Offspring Beta | 5.217 | 5.473 | 5.525 | 6.3E-01 |
| Offspring Beta p | 3.9E-04 | 7.7E-04 | 6.6E-04 | -3.551 |
|
| ||||
| Behavioral Disinhibition | 5.7E-05 | 3.6E-04 | 3.3E-04 | 1.9E-04 |
| Interaction p value | -0.397 | -0.613 | -0.638 | 0.479 |
| Parent Beta | 1.6E-01 | 4.7E-02 | 3.8E-02 | 3.6E-02 |
| Parent Beta p | 1.601 | 1.349 | 1.330 | -1.040 |
| Offspring Beta | 3.6E-04 | 6.7E-03 | 7.4E-03 | 4.8E-03 |
| Offspring Beta p | ||||
Analysis of Candidate SNPs from Published GWAS
We identified 51 SNPs associated in published GWAS at p < 5 × 10⁻⁷ with phenotypes related to behavioral disinhibition (including substance use and abuse, conduct disorder, and attention deficit/hyperactivity disorder) from A Catalog of Published Genome-Wide Association Studies (genome.gov, accessed January, 2012). Of these 51 SNPs, 16 had been genotyped on the Illumina 660W array and an additional 26 had been imputed with an r2 ≥ .50 using HapMap2 (mean = .977, range = .917 to 1.00). The remaining 9, which could not be imputed at r2 ≥ .50, are not analyzed here. The smallest p value for the association of any of these 42 SNPs with any of the five clinical phenotypes was .012 (full results summarized in Supplemental Table 5), which is an order of magnitude greater (i.e., less significant) than the Bonferroni corrected threshold for 42 tests (i.e., .05/42 = .001). Of particular note, the SNP in the autism susceptibility candidate 2 gene (AUTS2) on 7q11.22 identified as being significantly associated with alcohol consumption in a sample of more than 45,000 individuals, rs6943555, (Schumann et al., 2011) was not associated with either our Alcohol Consumption (p=.54) or Alcohol Dependence (p=.35) variables in our sample. Similarly, the SNPs in the nicotinic receptor gene cluster on 15q25.1 that have been associated with number of cigarettes smoked per day in 75,853 current smokers in the Tobacco and Genetics Consortium (rs1051730 and rs16969968) (Furberg et al., 2010) were not associated with our Nicotine composite variable (p > .40), although in measuring nicotine-related behavioral disinhibition we included both smokers and non-smokers in our analysis. Furberg et al. (2010) did not find association for rs1051730 and rs16969968 with ‘smoking initiation’ in their full sample of over 140,000 smokers and non-smokers. That said, we ultimately found no evidence of association of these 42 SNPs identified in previous relevant GWAS with any of our five phenotypes.
Gene-based Analyses
We computed the VEGAS summary statistic and associated p-value for 17,567 genes for each of the five phenotypes. For none of the phenotypes did the p-value for any gene reach significance at the Bonferroni corrected threshold of .05/17,567 = 2.8 × 10⁻⁶. The smallest gene based p-value we observed was 6.6 × 10⁻⁶ for the association of Nicotine with DMRTB1, a transcription factor. We also sought to determine whether there was enrichment of low p-values for 165 autosomal genes identified as being candidates for substance abuse and related phenotypes in previous research (Hodgkinson et al., 2008; S. F. Saccone et al., 2009). Full results for these candidate genes are listed in Supplemental Table 6. For Alcohol consumption, 4.8% of the 165 candidate genes were associated at p < .05 versus 5.0% of non-candidate genes. The comparable percentages of gene-based tests meeting the nominal p < .05 threshold for candidate genes versus genes not in the candidate set were: 6.1% versus 5.4% for Alcohol Dependence; 6.7% versus 7.3% for Illicit Drugs; 4.2% versus 5.7% for Nicotine; and 3.6% versus 4.7% for Behavioral Disinhibition. None of the phenotypes showed significant enrichment of candidate genes at the nominal p-value threshold of .05.
Total Heritable Effect
Parameter estimates from fitting the ACE biometric model separately to the five clinical phenotypes are given in Table 1. For each phenotype, the standardized estimate of the contribution of additive genetic factors (a2) is significant and large, with estimates for a2 ranging from .49 (for Alcohol Consumption) to .70 (for both Alcohol Dependence and Behavioral Disinhibition). The estimated contribution of shared environmental factors (c2) was moderate but significant for three of the phenotypes (ranging from .16 to .24) and zero or near-zero for the remaining two (Alcohol Dependence and Behavioral Disinhibition). Estimates of the total contribution of genotyped SNPs from GCTA are also given in Table 1. In deriving the GCTA estimates, we followed standard practice by eliminating members of pairs in which the coefficient of relatedness (GRM) was greater than .025 (Yang et al., 2011). This reduced our sample to 3671. Because GCTA is based on differences in genetic resemblance among individuals who are only remotely related, the confidence intervals associated with the estimates are wide. Nonetheless, it is notable that except for the Illicit Drugs phenotype, all of the GCTA estimates are substantially less than the corresponding biometric estimates of a2.
To investigate the impact of different GRM thresholds for sample elimination on the GCTA estimates, we varied the GRM threshold from .01 to 1.0 (i.e., all individuals included) for each of the five clinical phenotypes. Figure 1 provides illustrative results from these analyses for the Alcohol Consumption factor; plots for the remaining four clinical phenotypes are given in the Supplementary material (Supplemental Figures S21 to S24). As can be seen in the plot, the GCTA estimates cluster between 10% and 20% when the GRM threshold is less than .10. When the threshold is increased to .50, in which case first-degree relatives are being included, the estimate increases to 30%, and it further increases to 60% when the threshold is set to its boundary value of 1.0, in which case MZ twin pairs are also included. At the higher GRM thresholds, the GCTA estimate is being driven by the relationship of phenotypic similarity to genetic relatedness among closely-related individuals (i.e., it is essentially biometric). At the lower GRM thresholds, GCTA is estimating the proportion of phenotypic variance accountable by all of the markers genotyped in the GWAS. Consequently, the differences in the GCTA estimates at the differing GRM threshold gives some indication of the extent to which heritability would remain missing even in an infinite GWAS sample.
Figure 1.
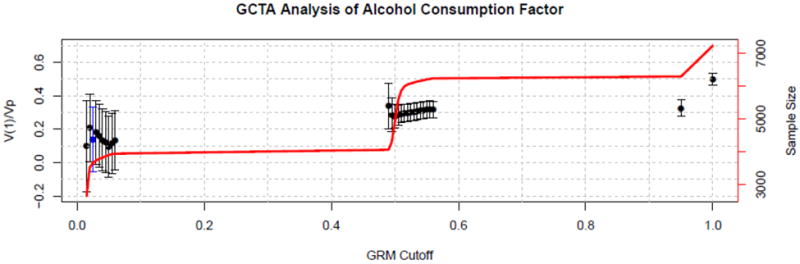
GCTA estimate of the proportion of variance in the Alcohol Consumption factor accounted for by additive genetic effects as a function of the coefficient of genetic relatedness (GRM) threshold. Error bars demarcate plus/minus two standard errors from the estimates. The solid line gives the sample size upon which the corresponding GCTA estimate is based. When the GRM threshold hits .50, first-degree relative pairs are included in the analysis, and when it hits 1.0, monozygotic twin pairs are also included. The standard GCTA estimate is based on a GRM threshold of .025, which is highlighted in blue in the plot.
Discussion
A GWAS of five moderately to strongly heritable quantitative indicators of behavioral disinhibition in a sample of 7188 Caucasians failed to yield any confirmed associations. Although the p-value for the association of one SNP, rs1868152, with one of the phenotypes, Illicit Drug use, was lower than the GWAS standard of 5 × 10⁻⁸, we do not consider this a confirmed positive result because the observed p-value of 4.9 × 10⁻⁸ was just below the critical threshold of 5.0 × 10⁻⁸, which does not take into account the multiple phenotypic tests we ran for each SNP. Our failure to observe any significant effects likely reflects the polygenic nature of the phenotypes we investigated, a conclusion that has now been reached with many other phenotypes (Manolio et al., 2009). Although the power of our design is complicated by the multiple clustered nature of the sample, power must lie between that for a sample of 2300 (i.e., the number of independent families) and 7188 (i.e., the number of individuals) observations. Consequently, with a two-tailed test at p < 5 × 10⁻⁸, we have power of at least 80% to detect effects with r2 between .005 and .017. Given GWAS findings with other quantitative traits (Visscher et al., 2012), the lower bound of this interval is on the high end of what might be expected. In any case, although we failed to identify variants with p values below the standard GWAS threshold, Panagiotou et al. (2012) have recently shown that a high proportion of associations with borderline significance in an initial analysis (which they defined as a p value < 1 × 10⁻⁷) go on to be confirmed in subsequent GWAS. The 13 variants given in Table 2 that showed effects that were consistent across the five phenotypes represent candidates we believe worthy of future consideration.
Our VEGAS-based analysis of 165 candidate genes for behavioral disinhibition also failed to yield any clear significant effects. Previous GWAS of phenotypes related to behavioral disinhibition have also failed to find support for candidate-gene associations (K. S. Kendler et al., 2011), and GWAS of other behavioral phenotypes including schizophrenia (Collins et al., 2012) and depression (Bosker et al., 2011) have similarly failed to find evidence of association with what had previously been identified as strong candidate genes for these disorders. This may reflect the now well-known limitations of candidate-gene research (Sullivan, 2007). Nonetheless, our failure to find associations between our nicotine phenotype and variants in the cholinergic nicotinic receptor subunit gene clusters on 15q25.1 (CHRNA5-CHRNA3-CHRNB4) (N. L. Saccone et al., 2010) and 8p11 (CHRNB3-CHRNA6) (Thorgeirsson et al., 2010) as well as nicotine-metabolizing enzyme genes on 19q13 (CYP2A6-CYP2B6) (Thorgeirsson et al., 2010) may seem a bit surprising since these variants have been identified in earlier GWAS of smoking.
We believe several factors may have contributed to our failure to replicate SNP associations identified in earlier meta-analyses of smoking data. First, and we think most significant, our nicotine phenotype is defined differently from how smoking was defined in these previous studies. Specifically, earlier studies implemented an exposure screen for having smoked at least 100 cigarettes in a lifetime before being considered a non-smoking control. In this way, they ensured that everyone in the sample would have had sufficient exposure to nicotine to have had an opportunity to develop a regular smoking habit. We applied no similar screen because exposure to nicotine is by itself an indicator of behavioral disinhibition (Reynolds & Fields, 2012) and we did not want to eliminate from the analysis individuals who had smoked fewer than 100 cigarettes as these individuals may be especially low on the behavioral disinhibition dimension. Second, in studies that have found significant SNP associations with smoking, the sample size has been substantially larger than the size of the sample in this study. For example, the ENGAGE consortium includes more than 30,000 genotyped participants for each of their smoking phenotypes (Thorgeirsson et al., 2010). While we were unable here to detect the effect of individual SNP associations, we are able to detect the aggregate effect of multiple SNPs. Specifically, in a previous analysis with a subset of the sample used here, we found a significant association of smoking (in current smokers) with an aggregated score based on 92 SNPs identified in a previous meta-analysis of smoking (Vrieze, McGue, & Iacono, 2012).
One of the unique features of our sample is that it includes observations in two distinct generations, parents (who were middle-age at the time of assessment) and their offspring (who were between 16 and 21). One might expect that the mean levels of each of the five behavioral disinhibition phenotypes would vary between the parent and offspring generations. Consistent with this expectation, generation had a large covariate effect in the RFGLS analysis. Of greater significance in the present analysis, however, is whether any SNP effects varied across the generations. In order to account for this possibility, we included a SNP by generation interaction term in the regression models and found little evidence for differential effects. Moreover, biometric analysis of the familial data suggested that while collateral first-degree relatives (i.e., biological siblings, dizygotic twins) were consistently more similar than intergenerational relatives (i.e., parents and their offspring), this increased similarity could be attributed to greater environmental similarity among sibling as compared to parent-offspring pairs (i.e., to shared environmental effects). The pattern of familial correlations is consistent with heritable factors having a similar phenotypic effect across the two generations. Nonetheless, whether SNP effects for behavioral phenotypes vary by age is a distinct possibility supported by the observation that the heritability of many behavioral traits increases with age, at least between adolescence and early adulthood (Bergen, Gardner, & Kendler, 2007). Indeed, in the previously mentioned study where we looked at the association of smoking with the aggregate effect of 92 SNPs, we found that the resulting SNP score was significantly associated with smoking at ages 20 and 24 but not at ages 14 and 17. The developmentally contingent nature of genetic effects for behavioral phenotypes is a major research question that will undoubtedly be a focus of future research in this area.
A second unique feature of our sample is that the family structure of the data allows us to estimate heritability using both biometric as well as GCTA methods. The comparison of the two sets of heritability estimates can be informative in terms of the missing heritability problem (Manolio et al., 2009). Specifically, GCTA estimates the extent to which additive genetic effects captured by variants included on the GWAS array account for phenotypic differences (Yang et al., 2011). In principle, GCTA estimates the magnitude of heritable variance detectable from markers from the genotype array when statistical power is perfect (i.e., sample size is infinite) (Visscher, Yang, & Goddard, 2010). Alternatively, biometric estimates of heritability index all additive genetic effects, regardless of whether they are captured by the SNP array. GCTA estimates for height (Yang et al., 2010) and general intelligence (Davies et al., 2011) indicate that somewhat more than half the heritable variance for these traits can be accounted for by common SNPs. GCTA estimates for personality (Vinkhuyzen et al., 2012) and schizophrenia (Lee et al., 2012) suggest that less than half the heritable variance is being accounted for. In our case, for only one phenotype (Illicit Drugs) was the GCTA estimate (.37) at least 50% of the biometric estimate (.55). For the other phenotypes, the GCTA estimate ranged from 40% of the biometric estimate (for Behavioral Disinhibition) to only 11% of the estimate for Alcohol Dependence. While it is important to emphasize that the confidence intervals associated with the GCTA estimates are broad, these findings when combined with previous results for schizophrenia and personality suggest that much of the heritable variation for some behavioral phenotypes cannot be captured by common SNPs.
In summary, we undertook a GWAS analysis of multiple indicators of behavioral disinhibition using more than 500K SNPs in a sample of over 7000 individuals of European ancestry. While we failed to find any confirmed associations that satisfy the recognized standard for declaring genomewide significance, consistent association findings were observed for several SNPs across the multiple indicators. These markers may be worthy of future investigation. A comparison of biometric and GCTA estimates of heritability for the five clinical phenotypes further suggests that the genetic architecture of the five clinical phenotypes is complex and that much of the heritable effects may not be accounted for by common SNPs.
Supplementary Material
Acknowledgments
This research was supported in part by USPHS Grants from the National Institute on Alcohol Abuse and Alcoholism (AA09367 and AA11886), the National Institute on Drug Abuse (DA05147, DA13240, and DA024417), and the National Institute on Mental Health (MH066140).
References
- Agrawal A, Edenberg HJ, Foroud T, Bierut LJ, Dunne G, Hinrichs AL, Dick DM, et al. Association of GABRA2 with drug dependence in the collaborative study of the genetics of alcoholism sample. Behavior Genetics. 2006;36(5):640–650. doi: 10.1007/s10519-006-9069-4. [DOI] [PubMed] [Google Scholar]
- Allen HL, Estrada K, Lettre G, Berndt SI, Weedon MN, Rivadeneira F, Procardis C, et al. Hundreds of variants clustered in genomic loci and biological pathways affect human height. Nature. 2010;467(7317):832–838. doi: 10.1038/nature09410. [DOI] [PMC free article] [PubMed] [Google Scholar]
- Bergen SE, Gardner CO, Kendler KS. Age-related changes in heritability of behavioral phenotypes over adolescence and young adulthood: A meta-analysis. Twin Research and Human Genetics. 2007;10(3):423–433. doi: 10.1375/twin.10.3.423. Article. [DOI] [PubMed] [Google Scholar]
- Bosker FJ, Hartman CA, Nolte IM, Prins BP, Terpstra P, Posthuma D, Nolen WA, et al. Poor replication of candidate genes for major depressive disorder using genome-wide association data. Molecular Psychiatry. 2011;16(5):516–532. doi: 10.1038/mp.2010.38. Article. [DOI] [PubMed] [Google Scholar]
- Burton PR, Clayton DG, Cardon LR, Craddock N, Deloukas P, Duncanson A, et al. Breast Canc Susceptib, C. Genome-wide association study of 14,000 cases of seven common diseases and 3,000 shared controls. Nature. 2007;447(7145):661–678. doi: 10.1038/nature05911. Review. [DOI] [PMC free article] [PubMed] [Google Scholar]
- Collins AL, Kim Y, Sklar P, O’Donovan MC, Sullivan PF Int Schizophrenia, C. Hypothesis-driven candidate genes for schizophrenia compared to genome-wide association results. Psychological Medicine. 2012;42(3):607–616. doi: 10.1017/s0033291711001607. Article. [DOI] [PMC free article] [PubMed] [Google Scholar]
- Corley RP, Zeiger JS, Crowley T, Ehringer MA, Hewitt JK, Hopfer CJ, Krauter K, et al. Association of candidate genes with antisocial drug dependence in adolescents. Drug and Alcohol Dependence. 2008;96(1-2):90–98. doi: 10.1016/j.drugalcdep.2008.02.004. [DOI] [PMC free article] [PubMed] [Google Scholar]
- Davies G, Tenesa A, Payton A, Yang J, Harris SE, Liewald D, Deary IJ, et al. Genome-wide association studies establish that human intelligence is highly heritable and polygenic. Molecular Psychiatry. 2011;16(10):996–1005. doi: 10.1038/mp.2011.85. [DOI] [PMC free article] [PubMed] [Google Scholar]
- Dick DM, Agrawal A, Wang JC, Hinrichs A, Bertelsen S, Bucholz KK, Bierut LJ, et al. Alcohol dependence with comorbid drug dependence: genetic and phenotypic associations suggest a more severe form of the disorder with stronger genetic contribution to risk. Addiction. 2007;102(7):1131–1139. doi: 10.1111/j.1360-0443.2007.01871.x. [DOI] [PubMed] [Google Scholar]
- Dick DM, Aliev F, Krueger RF, Edwards A, Agrawal A, Lynskey M, et al. Consortia, G. Genome-wide association study of conduct disorder symptomatology. Molecular Psychiatry. 2011;16(8):800–808. doi: 10.1038/mp.2010.73. [DOI] [PMC free article] [PubMed] [Google Scholar]
- Dick DM, Aliev F, Wang JC, Grucza RA, Schuckit M, Kuperman S, Goate A, et al. Using dimensional models of externalizing psychopathology to aid in gene identification. Archives of General Psychiatry. 2008;65(3):310–318. doi: 10.1001/archpsyc.65.3.310. Article. [DOI] [PubMed] [Google Scholar]
- Dick DM, Bierut L, Hinrichs A, Fox L, Bucholz KK, Kramer J, Foroud T, et al. The role of GABRA2 in risk for conduct disorder and alcohol and drug dependence across developmental stages. Behavior Genetics. 2006;36(4):577–590. doi: 10.1007/s10519-005-9041-8. [DOI] [PubMed] [Google Scholar]
- Dick DM, Latendresse SJ, Lansford JE, Budde JP, Goate A, Dodge KA, Bates JE, et al. Role of GABRA2 in Trajectories of Externalizing Behavior Across Development and Evidence of Moderation by Parental Monitoring. Archives of General Psychiatry. 2009;66(6):649–657. doi: 10.1001/archgenpsychiatry.2009.48. [DOI] [PMC free article] [PubMed] [Google Scholar]
- Drgon T, D’Addario C, Uhl GR. Linkage disequilibrium, haplotype and association studies of a chromosome 4 GABA receptor gene cluster: Candidate gene variants for addictions. American Journal of Medical Genetics Part B-Neuropsychiatric Genetics. 2006;141B(8):854–860. doi: 10.1002/ajmg.b.30349. [DOI] [PMC free article] [PubMed] [Google Scholar]
- Furberg H, Kim Y, Dackor J, Boerwinkle E, Franceschini N, Ardissino D, Sullivan PF, et al. Genome-wide meta-analyses identify multiple loci associated with smoking behavior. Nature Genetics. 2010;42(5):441–U134. doi: 10.1038/ng.571. [DOI] [PMC free article] [PubMed] [Google Scholar]
- Gorenstein EE, Newman JP. Disinhibitory psychopathology: A new perspective and model for research. Psychological Review. 1980;87(3):301–315. doi: 10.1037/0033-295x.87.3.301. Article. [DOI] [PubMed] [Google Scholar]
- Hicks BM, Krueger RF, Iacono WG, McGue M, Patrick CJ. Family transmission and heritability of externalizing disorders - A twin-family study. Archives of General Psychiatry. 2004;61(9):922–928. doi: 10.1001/archpsyc.61.9.922. [DOI] [PubMed] [Google Scholar]
- Hicks BM, Schalet BD, Malone SM, Iacono WG, McGue M. Psychometric and Genetic Architecture of Substance Use Disorder and Behavioral Disinhibition Measures for Gene Association Studies. Behavior Genetics. 2011;41(4):459–475. doi: 10.1007/s10519-010-9417-2. [DOI] [PMC free article] [PubMed] [Google Scholar]
- Hodgkinson CA, Yuan QP, Xu K, Shen PH, Heinz E, Lobos EA, Goldman D, et al. Addictions biology: Haplotype-based analysis for 130 candidate genes on a single array. Alcohol and Alcoholism. 2008;43(5):505–515. doi: 10.1093/alcalc/agn032. Article. [DOI] [PMC free article] [PubMed] [Google Scholar]
- Iacono WG, Malone SM, McGue M. Annual Review of Clinical Psychology. Vol. 4. Palo Alto: Annual Reviews; 2008. Behavioral disinhibition and the development of early-onset addiction: Common and specific influences; pp. 325–348. [DOI] [PubMed] [Google Scholar]
- Kendler KS, Kalsi G, Holmans PA, Sanders AR, Aggen SH, Dick DM, Gejman PV, et al. Genomewide Association Analysis of Symptoms of Alcohol Dependence in the Molecular Genetics of Schizophrenia (MGS2) Control Sample. Alcoholism-Clinical and Experimental Research. 2011;35(5):963–975. doi: 10.1111/j.1530-0277.2010.01427.x. Article. [DOI] [PMC free article] [PubMed] [Google Scholar]
- Kendler KS, Prescott CA, Myers J, Neale MC. The structure of genetic and environmental factors for common psychiatric and substance use disorders in men and women. Archives of General Psychiatry. 2003;60:929–937. doi: 10.1001/archpsyc.60.9.929. [DOI] [PubMed] [Google Scholar]
- Kohli MA, Lucae S, Saemann PG, Schmidt MV, Demirkan A, Hek K, Binder EB, et al. The Neuronal Transporter Gene SLC6A15 Confers Risk to Major Depression. Neuron. 2011;70(2):252–265. doi: 10.1016/j.neuron.2011.04.005. Article. [DOI] [PMC free article] [PubMed] [Google Scholar]
- Krueger RF. The structure of common mental disorders. Archives of General Psychiatry. 1999;56:921–926. doi: 10.1001/archpsyc.56.10.921. [DOI] [PubMed] [Google Scholar]
- Krueger RF, Hicks BM, Patrick CJ, Carlson SR, Iacono WG, McGue M. Etiologic connections among substance dependence, antisocial behavior, and personality: Modeling the externalizing spectrum. Journal of Abnormal Psychology. 2002;111(3):411–424. [PubMed] [Google Scholar]
- Krystal JH, Staley J, Mason G, Petrakis IL, Kaufman J, Harris RA, Lappalainen J, et al. gamma-Aminobutyric acid type A receptors and alcoholism - Intoxication, dependence, vulnerability, and treatment. Archives of General Psychiatry. 2006;63(9):957–968. doi: 10.1001/archpsyc.63.9.957. [DOI] [PubMed] [Google Scholar]
- Lee SH, DeCandia TR, Ripke S, Yang J, Sullivan PF, Goddard ME, et al. Mol Genetics, S. Estimating the proportion of variation in susceptibility to schizophrenia captured by common SNPs. Nature Genetics. 2012;44(3):247–U235. doi: 10.1038/ng.1108. Article. [DOI] [PMC free article] [PubMed] [Google Scholar]
- Li X, Basu S, Miller MB, Iacono WG, McGue M. A Rapid Generalized Least Squares Model for a Genome-Wide Quantitative Trait Association Analysis in Families. Human Heredity. 2011;71(1):67–82. doi: 10.1159/000324839. [DOI] [PMC free article] [PubMed] [Google Scholar]
- Liu JZ, McRae AF, Nyholt DR, Medland SE, Wray NR, Brown KM, et al. Investigators, A. A Versatile Gene-Based Test for Genome-wide Association Studies. American Journal of Human Genetics. 2010;87(1):139–145. doi: 10.1016/j.ajhg.2010.06.009. [DOI] [PMC free article] [PubMed] [Google Scholar]
- Manolio TA, Collins FS, Cox NJ, Goldstein DB, Hindorff LA, Hunter DJ, Visscher PM, et al. Finding the missing heritability of complex diseases. Nature. 2009;461(7265):747–753. doi: 10.1038/nature08494. [DOI] [PMC free article] [PubMed] [Google Scholar]
- Miller MB, Basu S, Cunningham JM, Eskin E, Malone SM, Oetting WS, McGue M, et al. The Minnesota Center for Twin and Family Research Genome-wide Association Study. Twin Research and Human Genetics. 2012 doi: 10.1017/thg.2012.62. in press. [DOI] [PMC free article] [PubMed] [Google Scholar]
- Mobascher A, Rujescu D, Mittelstrass K, Giegling I, Lamina C, Nitz B, Winterer G, et al. Association of a Variant in the Muscarinic Acetylcholine Receptor 2 Gene (CHRM2) With Nicotine Addiction. American Journal of Medical Genetics Part B-Neuropsychiatric Genetics. 2010;153B(2):684–690. doi: 10.1002/ajmg.b.31011. Article. [DOI] [PubMed] [Google Scholar]
- Neale MC, Boker SM, Xie G, Maes HH. Mx: Statistical modeling. 5. Box 126 MCV, Richmond VA 23298: Department of Psychiatry; 1999. [Google Scholar]
- Panagiotou OA, Ioannidis JPA Genome-Wide Significance, P. What should the genome-wide significance threshold be? Empirical replication of borderline genetic associations. International Journal of Epidemiology. 2012;41(1):273–286. doi: 10.1093/ije/dyr178. Article. [DOI] [PubMed] [Google Scholar]
- Price AL, Patterson NJ, Plenge RM, Weinblatt ME, Shadick NA, Reich D. Principal components analysis corrects for stratification in genome-wide association studies. Nature Genetics. 2006;38(8):904–909. doi: 10.1038/ng1847. [DOI] [PubMed] [Google Scholar]
- Quay HC. Inhibition and attention deficit hyperactivity disorder. Journal of Abnormal Child Psychology. 1997;25(1):7–13. doi: 10.1023/a:1025799122529. Article; Proceedings Paper. [DOI] [PubMed] [Google Scholar]
- Reynolds B, Fields S. Delay discounting by adolescents experimenting with cigarette smoking. Addiction. 2012;107(2):417–424. doi: 10.1111/j.1360-0443.2011.03644.x. Article. [DOI] [PMC free article] [PubMed] [Google Scholar]
- Saccone NL, Culverhouse RC, Schwantes-An TH, Cannon DS, Chen XN, Cichon S, Bierut LJ, et al. Multiple Independent Loci at Chromosome 15q25.1 Affect Smoking Quantity: a Meta-Analysis and Comparison with Lung Cancer and COPD. Plos Genetics. 2010;6(8) doi: 10.1371/journal.pgen.1001053. [DOI] [PMC free article] [PubMed] [Google Scholar]
- Saccone SF, Bierut LJ, Chesler EJ, Kalivas PW, Lerman C, Saccone NL, Rutter JL, et al. Supplementing High-Density SNP Microarrays for Additional Coverage of Disease-Related Genes: Addiction as a Paradigm. Plos One. 2009;4(4) doi: 10.1371/journal.pone.0005225. Article. [DOI] [PMC free article] [PubMed] [Google Scholar]
- Schol-Gelok S, Janssens A, Tiemeier H, Liu F, Lopez-Leon S, Zorkoltseva IV, van Duijn CM, et al. A Genome-Wide Screen for Depression in Two Independent Dutch Populations. Biological Psychiatry. 2010;68(2):187–196. doi: 10.1016/j.biopsych.2010.01.033. Article. [DOI] [PubMed] [Google Scholar]
- Schumann G, Coin LJ, Lourdusamy A, Charoen P, Berger KH, Stacey D, Elliott P, et al. Genome-wide association and genetic functional studies identify autism susceptibility candidate 2 gene (AUTS2) in the regulation of alcohol consumption. Proceedings of the National Academy of Sciences of the United States of America. 2011;108(17):7119–7124. doi: 10.1073/pnas.1017288108. [DOI] [PMC free article] [PubMed] [Google Scholar]
- Sher KJ, Bartholow BD, Wood MD. Personality and substance use disorders: A prospective study. Journal of Consulting and Clinical Psychology. 2000;68(5):818–829. doi: 10.1037//0022-006x.68.5.818. Article. [DOI] [PubMed] [Google Scholar]
- Speliotes EK, Willer CJ, Berndt SI, Monda KL, Thorleifsson G, Jackson AU, et al. Magic. Association analyses of 249,796 individuals reveal 18 new loci associated with body mass index. Nature Genetics. 2010;42(11):937–U953. doi: 10.1038/ng.686. [DOI] [PMC free article] [PubMed] [Google Scholar]
- Sullivan PF. Spurious genetic associations. Biological Psychiatry. 2007;61(10):1121–1126. doi: 10.1016/j.biopsych.2006.11.010. Article. [DOI] [PubMed] [Google Scholar]
- Thorgeirsson TE, Gudbjartsson DF, Surakka I, Vink JM, Amin N, Geller F, Consortium E, et al. Sequence variants at CHRNB3-CHRNA6 and CYP2A6 affect smoking behavior. Nature Genetics. 2010;42(5):448–U135. doi: 10.1038/ng.573. [DOI] [PMC free article] [PubMed] [Google Scholar]
- Vinkhuyzen AAE, Pedersen NL, Yang J, Lee SH, Magnusson PKE, Iacono WG, Wray NR, et al. Common SNPs explain some of the variation in the personality dimensions of neuroticism and extraversion. Translational Psychiatry. 2012;2 doi: 10.1038/tp.2012.27. Article. [DOI] [PMC free article] [PubMed] [Google Scholar]
- Visscher PM, Brown MA, McCarthy MI, Yang J. Five Years of GWAS Discovery. American Journal of Human Genetics. 2012;90(1):7–24. doi: 10.1016/j.ajhg.2011.11.029. Review. [DOI] [PMC free article] [PubMed] [Google Scholar]
- Visscher PM, Yang JA, Goddard ME. A Commentary on ‘Common SNPs Explain a Large Proportion of the Heritability for Human Height’ by Yang et al. (2010) Twin Research and Human Genetics. 2010;13(6):517–524. doi: 10.1375/twin.13.6.517. Editorial Material. [DOI] [PubMed] [Google Scholar]
- Vollebergh WAM, Iedema J, Bijl RV, de Graaf R, Smit F, Ormel J. The structure and stability of common mental disorders - The NEMESIS Study. Archives of General Psychiatry. 2001;58(6):597–603. doi: 10.1001/archpsyc.58.6.597. [DOI] [PubMed] [Google Scholar]
- Vrieze SI, McGue M, Iacono WG. The interplay of genes and adolescent development in substance use disorders: leveraging findings from GWAS meta-analyses to test developmental hypotheses about nicotine consumption. Human Genetics. 2012;131(6):791–801. doi: 10.1007/s00439-012-1167-1. Review. [DOI] [PMC free article] [PubMed] [Google Scholar]
- Yang JA, Benyamin B, McEvoy BP, Gordon S, Henders AK, Nyholt DR, Visscher PM, et al. Common SNPs explain a large proportion of the heritability for human height. Nature Genetics. 2010;42(7):565–U131. doi: 10.1038/ng.608. Article. [DOI] [PMC free article] [PubMed] [Google Scholar]
- Yang JA, Lee SH, Goddard ME, Visscher PM. GCTA: A Tool for Genome-wide Complex Trait Analysis. American Journal of Human Genetics. 2011;88(1):76–82. doi: 10.1016/j.ajhg.2010.11.011. Article. [DOI] [PMC free article] [PubMed] [Google Scholar]
- Young SE, Stallings MC, Corley RP, Krauter KS, Hewitt JK. Genetic and environmental influences on behavioral disinhibition. American Journal of Medical Genetics. 2000;96(5):684–695. doi: 10.1002/1096-8628(20001009)96:5<684∷aid-ajmg16>3.0.co;2-g. Article. [DOI] [PubMed] [Google Scholar]
Associated Data
This section collects any data citations, data availability statements, or supplementary materials included in this article.