Abstract
Layers 5 and 6 of primate primary visual cortex (V1) harbor morphologically diverse cell groups that have corticocortical and corticosubcortical projections. Layer 6 middle temporal area (MT)-projecting neurons are particularly interesting, as they are the only deep-layer cortical neurons that provide both corticocortical feed-forward inputs (to area MT) and corticosubcortical feedback projections (to superior colliculus [SC]) (Fries et al. [1985] Exp Brain Res 58:613–616). However, due to limitations in anatomical tracing techniques, little is known about the detailed morphologies of these cells. We therefore applied a genetically modified rabies virus as a retrograde tracer to fill the dendrites of projection neurons with green fluorescent protein (GFP) (Wickersham et al. [2007] Nat Methods 4:47–49). We injected virus into SC or area MT of macaque monkeys and examined labeled cells in V1. Two-thirds of labeled neurons following SC injections were found in layer 5, consisting of “tall-tufted” and “nontufted” cells; the remaining cells were layer 6 “nontufted.” Area MT injections labeled neurons in layers 4B and 6, as previously described (Shipp and Zeki [1989] Eur J Neurosci 1:309–332). The layer 6 neurons projecting to MT were remarkably similar to the layer 6 SC-projecting neurons. In contrast to the dense and focused dendritic arbors of layer 5 “tall-tufted” pyramids, all “nontufted” cells had sparse, but unusually long basal dendrites. The nontufted cells closely resemble Meynert cells (le Gros Clark [1942] J Anat 76:369–376; Winfield et al. [1983] Proc R Soc Lond B Biol Sci 217:129–139), but the full in vivo reconstructions presented here show that their basal dendrites can extend much further (up to 1.2 mm) and are less asymmetric than inferred from Golgi reconstructions. J. Comp. Neurol. 520:52–80, 2012.
INDEXING TERMS: macaque, V1 circuits, SC, area MT, rabies virus, Meynert cells
The exceptional organization of primate visual cortex provides systems neuroscientists with a useful model for studying circuitry and connectivity. The primate primary visual cortex (V1) is organized into numerous laminar and columnar subdivisions that are anatomically and functionally specialized (Callaway, 1998a). Each layer contains different cell types that participate in different functional circuits (Callaway, 2002). Golgi impregnation and intracellular labeling studies have identified a variety of cell types in all layers of primate V1 (Lund, 1988; Katz et al., 1989; Anderson et al., 1993; Callaway and Wiser, 1996; Wiser and Callaway, 1996; Yabuta and Callaway, 1998). Each cell type is unique in terms of somal location, size, shape, dendritic/axonal arborization patterns, input sources, and physiological properties (Callaway, 1998a). And because the local functional connections of many morphologically identified cell types have been described (Sawatari and Callaway, 2000; Briggs and Callaway, 2001, 2005; Yabuta et al., 2001) morphological observations can be used to predict connectivity and function.
Of the six cortical layers, layers 5 and 6 harbor the greatest diversity of neurons, both morphologically and physiologically (Chan-Palay et al., 1974; Winfield et al., 1981; Lund et al., 1988; Movshon and Newsome, 1996; Wiser and Callaway, 1996; Briggs and Callaway, 2001). Although the diversity of pyramids was already clear from Golgi studies (Lund, 1973, 1987; Lund et al., 1977, 1988; Valverde, 1985), the development of intracellular staining in brain slices provided still more detail, particularly about the local axonal arbors that are not easily seen with Golgi stain. These studies also made clear that the great majority of pyramidal neurons in deep layers of macaque V1 make only local projections and do not connect to distant cortical or subcortical structures (Callaway and Wiser, 1996; Wiser and Callaway, 1996). But for those cell types that do project to distant structures, these methods are not able to reveal the particular structures that they target. It is also clear that some cell types observed in Golgi studies have not been found during intracellular labeling studies. Of particular note are the tall-tufted layer 5 pyramids and “Meynert” cells (le Gros Clark, 1942; Lund and Boothe, 1975; Winfield et al., 1983; Valverde, 1985). This has left a gap in our knowledge of the relationships between the morphologies and distant projections of deep layer pyramids.
The roughly 30% of deep-layer macaque V1 neurons that project out of V1 send their axons to distant targets, including the lateral geniculate nucleus, pulvinar, the superior colliculus (SC), middle temporal cortical area (MT), and possibly the claustrum (Lund et al., 1975; LeVay and Sherk, 1981; Fries and Distel, 1983; Ungerleider et al., 1983; Fitzpatrick et al., 1994; Wiser and Call-away, 1996; Callaway and Wiser, 1996). Superior colliculus-projecting cells are found in both layers 5 and 6 of macaque V1 (Fries and Distel, 1983; Fries, 1984). Area MT-projecting cells are located in layers 4B and 6 in both Old and New World monkeys (Shipp and Zeki, 1989; vogt Weisenhorn et al., 1995). Layer 6 MT- and SC-projecting cells are particularly interesting because at least some of these cells project to both targets (Fries et al., 1985); and the direct MT projection from V1 is the only known feed-forward connection that originates from layer 6 (Shipp and Zeki, 1989; Movshon and Newsome, 1996). Based on the limited morphological details revealed by retrograde horseradish peroxidase (HRP) or fluorescent labeling, layer 5 and layer 6 SC-projecting cells were described as common pyramids and solitary cells of Meynert, respectively (Lund et al., 1975; Fries and Distel, 1983; Fries, 1984; Shipp and Zeki, 1989). Reconstructions of the local axon collaterals of layer 6 Meynert cells labeled in vivo show that they have highly specialized terminals arbors, further suggesting a unique role relative to more typical cortical neurons (Rockland and Knutson, 2001).
However, due to limitations of the labeling techniques used, detailed morphologies of SC- and deep-layer MT-projecting V1 neurons are still unknown. In this study we applied a transsynaptically incompetent rabies virus that acts as a retrograde tracer (Wickersham et al., 2007). This virus fills the dendrites of neurons projecting to the injection sites with green fluorescent protein (GFP). We injected the virus into SC or area MT of macaque monkeys and assessed the morphologies of labeled neurons found in V1. This new method enables us to confidently and directly link the detailed morphologies of these deep layer neurons to their respective projection targets.
By directly linking detailed dendritic morphology to distant projection targets of individual neurons we have been able to resolve several outstanding issues about Meynert cells. Because Meynert cells were first described nearly 150 years ago (Meynert, 1867), a clear understanding of these issues also requires a historical perspective on how definitions have evolved as a result of experimental observations and assumptions that were made in the face of limited data (see Discussion). The first descriptions of the dendritic arbors of Meynert cells were made based on Golgi staining and described them as “being characterized by having a base which is very broad in proportion to its height, and in possessing stout basal dendrites which extend for considerable distances parallel to the surface” (Cajal, 1899; le Gros Clark, 1942). Later experiments used limited morphological information from retrogradely labeled neurons to try to link projection targets to the previous Golgi descriptions. Such studies often used cell body size as a common intermediate, but the validity of these inferences rested on the assumption that different cell types would differ in cell body size. Our data show that this assumption led to some incorrect inferences as well as unwarranted changes in the definition of Meynert cells—to include all deep-layer neurons with large somata. Our results show that the original definition of Meynert cells (Cajal, 1899; le Gros Clark, 1942) makes an important distinction that separates SC-projecting neurons into two separate types, including both Meynert cells and other neurons with the “tall-tufted” morphology observed for SC-projecting cells in non-primate species. Furthermore, all layer 6 MT-projecting neurons appear to be Meynert cells, but not all Meynert cells project to MT; layer 5 Meynert cells project to SC, but not MT. Finally, these results shed light on likely specializations of the primate visual system not observed in other species.
MATERIALS AND METHODS
Animals
Three adult monkeys were used: one Macaque mulatta (female, referred to in the text as HNM1) and two Macaque fascicularis (both males, HNM2 and HNM3), obtained from the University of California, Davis and the University of California, Los Angeles, respectively. All procedures were done following protocols approved by the Salk Institute Animal Care and Use Committee. Animals were 3 to 7 years old at the time of perfusion. In addition, all procedures using rabies virus were performed under biosafety level 2 precautions as described previously (Kelly and Strick, 2000).
Rabies virus
To retrogradely label neurons that project directly from V1 to SC or MT, we injected the recombinant rabies virus SADΔG-EGFP into either SC or MT (Wickersham et al., 2007). Studies have shown that the rabies virus infects neurons at axon terminals and travels retrogradely to the projecting cell bodies and their dendrites (Ugolini, 1995; Kelly and Strick, 2000). Rabies virus is an enveloped RNA virus, with a genome consisting of 5 genes—nucleoprotein (N), phosphoprotein (P), matrix protein (M), glycoprotein (G), and polymerase (L). The rabies virus used in our experiments was derived from the SADB19 vaccine strain of rabies virus but was modified by having its glycoprotein gene deleted from its genome and replaced by a GFP gene (Etessami et al., 2000). The newly synthesized viral particles lack the glycoprotein that is essential for viral entry and release, causing them to be trapped inside the cell while they continually express GFP to fill the dendritic/axonal arbors (Wickersham et al., 2007).
Surgical procedures
Animal surgery
Monkeys were initially anesthetized with ketamine and xylazine intramuscularly. An intravenous line was inserted and the trachea intubated. The animals were positioned into a stereotaxic holder and anesthesia was switched to inhaled isoflurane 1–2% in oxygen throughout the surgery. A midline scalp incision was made and a craniotomy drilled through the skull to expose the dorsal surface of parietal and occipital lobes, depending on the locations of injections (SC or MT). A cut was made in the dura and coordinates of injection locations were measured.
Injection sites and parameters
Locations of SC injection sites (for HNM1 and HNM2) were determined based on stereotaxic coordinates and electrophysiological recordings. Superficial layers of SC (≈ 900 μm) contain visually responsive neurons (Kaas and Huerta, 1988). To determine the location of SC, we used low impedance tungsten microelectrodes of ≈ 1MΩ to detect visually evoked extracellular action potentials of neurons in the superficial layers in response to ON-OFF flashes of light. Stereotaxic coordinates identified during the electrical recordings were then used to guide virus injections into the SC. Locations of MT injection sites (for HNM3) were determined based on structural magnetic resonance (MR) images. We used MR images to calculate the stereotaxic coordinates for our bilateral MT injections along the posterior bank of the superior temporal sulcus (STS) as described previously (Nassi and Callaway, 2007). The monkey was scanned using a 3-Tesla GE Excite HDx scanner at the Keck Center for Functional MRI at the University of California, San Diego (La Jolla, CA).
Recording and injecting electrodes entered the brain at a 38° angle and hit SC after passing through some visual cortical tissues. Because the rabies virus only infects axonal terminals, the probability of infecting fibers of passage is very low, ensuring that all labeled cells are cells projecting to injection sites. MT injections were made at an angle parallel to the posterior bank of the STS at five different depths, 0.5 mm apart.
Injections were made using glass micropipettes (25–30 μm tip diameter) with air pressure pulses applied via a Picospritzer II (General Valve, Fairfield, NJ). We adjusted pulse pressure (between 20–40 psi), duration (10–50 ms), and frequency (0.5–2.0 Hz) to produce an injection rate of about 1 μl per every 5 minutes (or 0.2 μl/min).
G-deleted rabies virus carrying GFP (4 × 10⁸ to 8 × 10⁹ IU/ml) and 10% tetramethylrhodamine dextran were injected into the SC or area MT of three monkeys (HNM1 and HNM2: bilateral SC injections with G-deleted rabies virus; HNM3: bilateral SC injections with tetramethylrhodamine dextran and bilateral MT injections with G-deleted rabies virus). Complete injection parameters are summarized in Table 1.
TABLE 1.
Injection Parameters
| HNM1 | HNM2 | HNM3 | ||
|---|---|---|---|---|
| Number of survival days | 7 | 7 | 5 | |
| SC injections | Number of penetrations per hemisphere | 4 | 4 | 4 |
| Number of injections per penetration (depths)* | 2 (−1, −1.5 mm) | 2 (−0.5, −1.5 mm) | 3 (−0.5, −1, & −1.5 mm) | |
| Amount of virus or dye per injection (concentration) | 1 μl RV (4.16× 10⁸iu/ml) | 1 μl RV (8.53× 10⁹iu/ml) | 1 μl RD (10%) | |
| MT injections | Number of penetrations per hemisphere | n/a | n/a | 2 |
| Number of injections per penetration | n/a | n/a | 5 | |
| Amount of virus or dye per injection | n/a | n/a | 0.5 μl RV (6.44× 10⁸ iu/ml) |
Injection depth from the superior collicular surface. RV, G-deleted GFP rabies virus; RD, tetramethylrhodamine dextran.
Immunohistochemistry
After a survival period of 5 to 7 days the animals were sacrificed and perfused with 4% paraformaldehyde (PFA). Their brains were removed and stored in 30% sucrose for a week, then sectioned on a freezing microtome. The occipital lobe encompassing the primary visual cortex was sectioned parasagittally at 40–60 μm thickness. Blocks of brain containing STS were sectioned coronally at 50 μm thickness. The brain stem containing the superior colliculi was also sectioned at 50-μm thickness coronally. Initially, a series of every 12th section was processed for cytochrome oxidase (CO) activity to reveal cortical layers followed by GFP immunostaining to reveal the extent of rabies infection. We used this series to identify the extent of GFP labeling in the entire V1 and to narrow down the specific regions containing GFP labeled cells. We then processed every brain section in the regions of interest for CO activity and GFP signal.
Combined CO and anti-GFP staining
The CO staining protocol used in these studies is the same as originally described by Wong-Riley and has been combined with antibody staining and used routinely in our laboratory during the past 2 decades (Wong-Riley, 1979; Lyon et al., 2010). In brief, after sectioning brain sections were rinsed with 1× phosphate-buffered saline (PBS, pH 7.4) and then incubated in CO staining solution for 12 hours at room temperature. CO solution contains 0.03% cytochrome C, 0.02% catalase, and 5% 3,3′-diaminobenzidine (DAB) in PBS. After 12 hours the CO reaction was stopped by rinsing sections in PBS. Endogenous peroxidase activity was then quenched by incubating sections 10% methanol and 3% H2O2 in PBS, followed by PBS rinses.
Sections were then stained with anti-GFP antibodies. The following primary antibodies were used: rabbit anti-GFP (Invitrogen, La Jolla, CA; A11122, 1:500), chicken anti-GFP (Aves Labs, Tigard, OR; GFP-1020, 1:500), rabbit anti-tetramethylrhodamine dextran (Invitrogen; A6397, 1:250) (Table 2). For one animal (HNM3) fluorescent secondary antibodies were used and the tissue was not stained for CO; we used donkey antichicken Cy2-conjugated secondary antibodies (Jackson ImmunoResearch, West Grove, PA; 703-225-155, 1:200), and donkey anti-rabbit Cy3-conjugated secondary antibodies (Millipore, Bedford, MA; AP128C, 1:200). In two cases (HNM1 and HNM2), GFP signals were detected using a goat antirabbit biotinylated secondary antibody (Vector Laboratories, Burlingame, CA; BA-1000, 1:250), amplified with the Avidin-Biotin-Peroxidase Complex system using DAB as chromogen, and enhanced with nickel and cobalt (Vectas-tain ABC Kit, Peroxidase Standard PK-4000, Vector Laboratories). Fluorescent sections (HNM3) were counter-stained with 10 μM DAPI (Sigma-Aldrich, St. Louis, MO; D9542) in PBS for 10 minutes to reveal cortical layers. Sections were dehydrated through a series of ethanol dilutions and xylene, then coverslipped using Krystalon (EMD Chemicals 64969–95, Gibbstown, NJ). Nonfluorescent sections were dehydrated following the same dehydration protocol, but were coverslipped using Permount (Fisher Scientific, Pittsburgh, PA; SP15–500).
TABLE 2.
Antibodies Characterization
| Antigen | Immunogen | Manufacturing details | Working dilution |
|---|---|---|---|
| Green fluorescent protein (GFP) | Purified recombinant green fluorescent protein | Aves Labs (Tigard, OR), chicken polyclonal, GFP-1020 | 1:500 |
| Green fluorescent protein (GFP) | Purified recombinant green fluorescent protein | Invitrogen (Carlsbad, CA), rabbit polyclonal, A111–22 | 1:500 |
| Tetramethyl-rhodamine dextran | Tetramethyl-rhodamine | Invitrogen (Carlsbad, CA), rabbit polyclonal, A6397 | 1:250 |
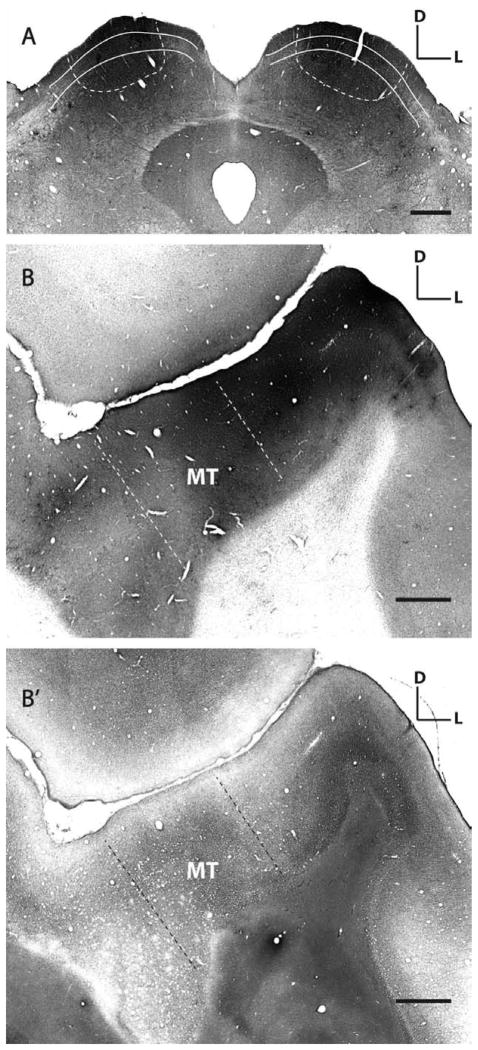
The brainstems for all cases were stained for CO activity to reveal the different superior collicular layers and for GFP signal to reveal the spread of viral infection (Fig. 1A). Cytochrome oxidase staining of the SC revealed the visually responsive superficial layers 1 to 3, as well as the intermediate and deep layers that are responsible for sen-sorimotor integration and saccade generation (Schiller and Stryker, 1972; Graham et al., 1979; Wurtz and Albano, 1980; Kaas and Huerta, 1988). Our goal was to infect axon terminals of neurons whose cell bodies reside in V1 and project their axons to the superficial layers of the SC (Graham et al., 1979; Tigges and Tigges, 1981; Graham, 1982; Lock et al., 2003). For the first monkey experiment (HNM1), injections were made at the depth of 1 and 1.5 mm below the SC surface. The injections hit mostly the intermediate and deep SC layers; therefore, only a few layer 5 SC-projecting neurons were labeled in V1 and only one was reconstructed in HNM1’s brain. For the second monkey (HNM2) injections were made at 0.5 and 1.5 mm depth below the SC surface, which allowed the virus to infect axon terminals from neurons over a greater extent of SC layers and resulted in extensive labeling of neurons in layers 5 and 6 of V1 (see Results).
Figure 1.
Rabies virus injection sites in superior colliculus and middle temporal area. A: SC injection sites in monkey HNM2 showing the extent of rabies infection. Shown here is a 50-μm thick cytochrome oxidase-stained (CO, gray background) SC section that shows GFP (black) expressed in rabies-infected neurons. For each monkey we made four injections in each SC, at two different depths (− 0.5 or − 1 mm and − 1.5 mm from the SC surface), 1 μl of virus for each injection. White lines indicate the superficial layers of the SC; white dashed lines indicate the extent of labeling. B: MT injection sites in monkey HNM3 showing the extent of rabies infection. Single coronally cut cortical section stained for CO and GFP shows the spread of the injections. The adjacent section (B′) is stained for myelin to show heavily myelinated area MT (the area between two dash lines) in the superior temporal sulcus. D, dorsal; L, lateral. Scale bars =1 mm.
Gallyas staining for myelin
Distinct characteristics of area MT include heavy myelination, dark and patchy CO staining, and greater cortical thickness (Van Essen et al., 1981; Tootell et al., 1985). In the case of HNM3, alternating series of cortical sections encompassing the STS were processed for myelin and CO/GFP staining (Fig. 1B). Modified Gallyas myelin stain was used to reveal the heavy myelination characteristic of area MT (Fig. 1B′), confirming that the rabies injection was targeted to MT (Gallyas, 1979).
The modified Gallyas myelin stain encompasses three main steps: 1) acetylation; dry and mounted sections were submerged in a mixture of pyridine and acetic anhydride in a 2:1 ratio for 30 minutes; 2) impregnation of tissues in ammoniac silver nitrate—slides with mounted sections were submerged in a 0.1% solution of silver and ammonium nitrate for 1 hour; and 3) exposure of tissues to a series of chemical developers. Developers include: a) a mixture of 2.5% sodium carbonate, 0.1% ammonium nitrate, 0.1% silver nitrate, 0.5% tungstosilicic acid, 0.25% formalin; b) 0.5% potassium ferracyanide; and c) 0.8% sodium thiosulfate (for more details, see Gallyas, 1971, 1979).
Data analysis
Partial reconstruction of neurons from the “unbiased” sampling of population data
Ideally, reconstructing the complete morphology of a randomly sampled group of cells would be the most unbiased way to characterize a population. But due to the high degree of overlap between dendritic and axonal processes in densely labeled regions, detailed reconstruction of randomly chosen cells was not feasible. However, it was possible to trace the apical dendrite of a cell through different sections and to examine its morphology (tufted vs. nontufted), its termination layer, and its blob/ interblob preference. Therefore, these more limited measures were made for a larger population of neurons. For results from HNM1 and HNM3, all labeled deep-layer neurons throughout V1 were subject to these analyses and thus any sampling biases were limited to those imposed by the labeling methods. For HNM2, the very large number of labeled neurons precluded analyses of all neurons. In this case, to obtain an “unbiased” sample of the population data, we counted every cell on every 12th section of the entire V1. Only cells with greater than 50% of their soma located on the 12th sections were counted. All cells were classified based on the location of their cell bodies. We are confident that such an unbiased sampling of cells would yield an objective and representative description of SC-projecting neurons in V1.
Morphological features obtained for each neuron in these unbiased samples (from HNM1, 2, and 3) are: laminar location of the soma represented by the laminar depth index (LDI, see below), somal volume, the location of the soma relative to CO blob/interblob represented by the blob distance index (BDI, see below), the appearance of its apical dendrite (tufted vs. nontufted) and the laminar depth of the apical dendrite’s termination (Fig. 2). An apical dendrite was listed as “unidentifiable” when we could not confidently and correctly determine the cell’s apical dendritic morphology due to 1) the faint quality of the labeling, perhaps as a result of having relatively few number of rabies viral particles being taken up by projecting axons; 2) the noisy background from the dense labeling of nearby labeled cells; or 3) accidental tissue damage.
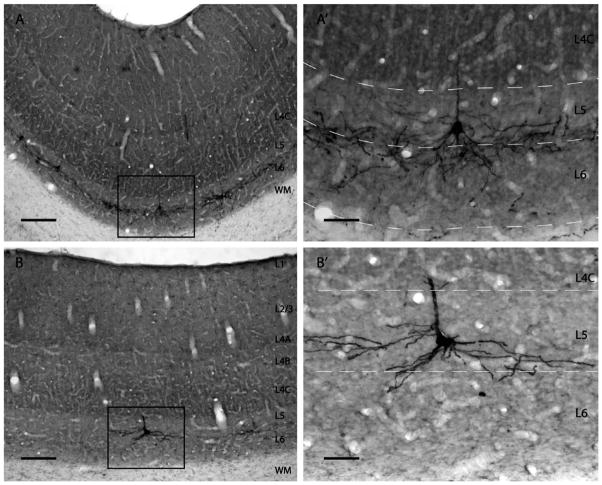
Figure 2.
Retrogradely labeled neurons in V1 from SC injections. A,B: Low-power views of GFP-labeled (black) SC-projecting neurons in V1 (HNM2) from regions of dense or sparse label, respectively. Higher-power views of the boxed regions are shown in A′and B′. Cytochrome oxidase staining (gray) reveals different cortical layers. GFP-labeled cells were found exclusively in layers 5 and 6 of V1 and are concentrated at the border between these layers. At regions of dense label (A,A′) the cell bodies and labeled neuronal processes from many different neurons are extensively intermingled. Ascending apical dendrites and branches can also be seen in more superficial layers. In regions with sparser label (B,B′) it is possible to separately identify and reconstruct the neuronal processes originating from individual neurons (see Materials and Methods). Scale bars =200 μm in A,B; 50 μm in A′,B′.
We defined “tall-tufted” cells as cells with an apical dendrite extending to layer 1 and forming a tuft with more than two branches. “Nontufted” cells were cells whose apical dendrite remains a single branch ending anywhere between layers 2 and 5 without forming a tuft. These cells’ dendrites did not extend into layer 1 (Fig. 3).
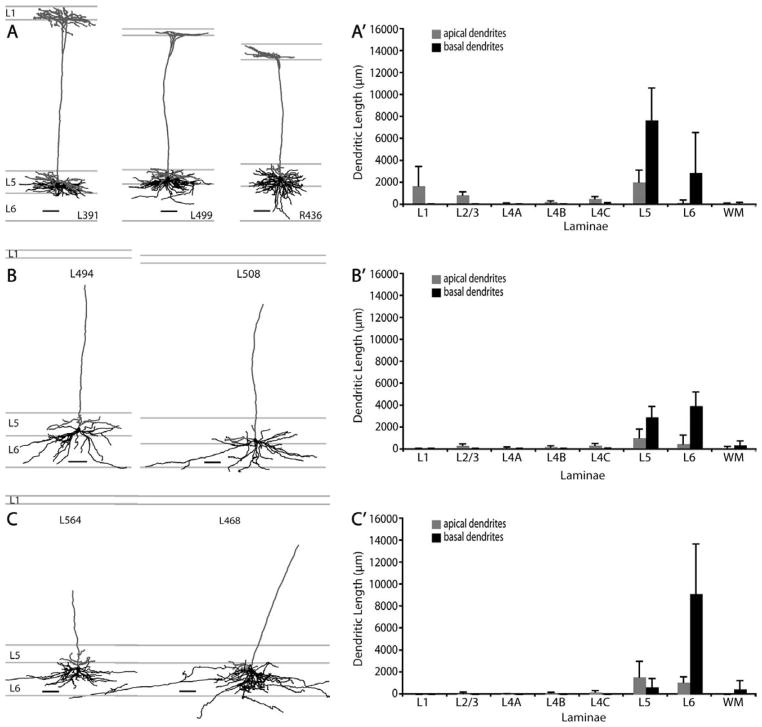
Figure 3.
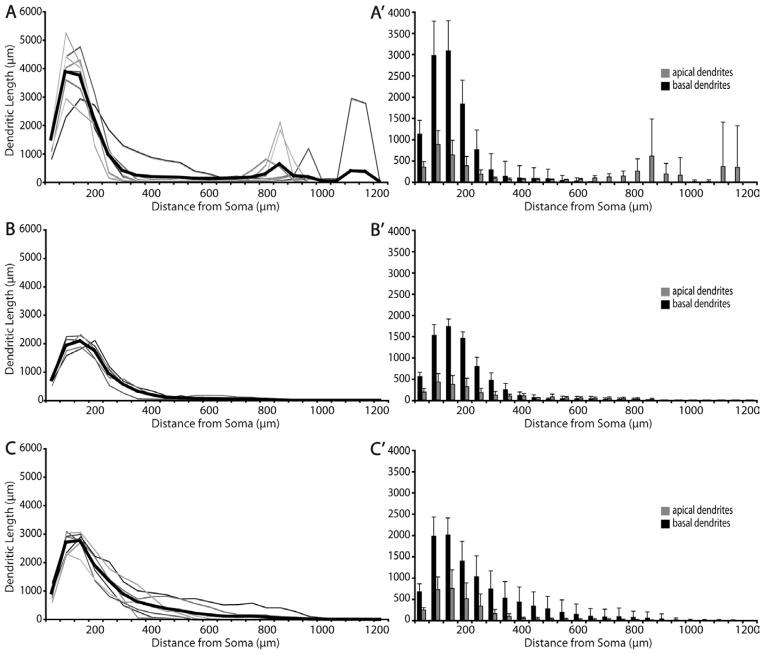
Morphologies of SC-projecting neurons in V1. A: Morphologies of layer 5 tall-tufted neurons. The distinguishing feature of this cell type is the long apical dendrite (gray) that extends to layer 1 and forms a tuft stratifying in layers 1 and 2. Their basal dendrites (black) are densely packed in layer 5 and only extend laterally to about 350 μm. Some basal dendritic branches extend into layer 6. There are more basal dendrites in layer 5 than in layer 6. B: Morphologies of layer 5 nontufted neurons. This is a distinct cell type that lacks an apical tuft. Its apical dendrite (gray) ends in the supergranular layers without branching above layer 5. These neurons have sparse but long laterally spreading basal dendrites (black). Basal dendrites are spread rather evenly in both layers 5 and 6. C: Morphologies of layer 6 nontufted neurons. This cell type resembles the layer 5 nontufted neurons in (B) in terms of apical dendritic morphology, but their basal dendrites are confined mostly to layer 6. A′–C′: Histograms of laminar distribution of apical (gray) and basal (black) dendrites for all reconstructed SC-projecting layer 5 tall-tufted cells (A′, n =8), SC-projecting layer 5 nontufted cells (B′, n =5), and SC-projecting layer 6 non-tufted cells (C′, n =7). Values represent mean ± SD. Scale bars =100 μm.
Laminar depth index (LDI)
Laminar location of a cell, represented by the LDI, was determined by dividing the distance from the axon hillock of the cell to the top of the layer by the total depth of the layer in which the soma is located. The values of LDI range between 0 and 2. For cells whose cell bodies lie completely within layer 5, the LDI value was the ratio between the distance from the cell’s axon hillock to the top of layer 5 and the depth of layer 5 (i.e., 0 < LDI ≤ 1). For cells whose axon hillocks located in layer 6, the LDI value was the sum between the similarly calculated ratio and 1 (i.e., 1 < LDI < 2). Because our technical definition of LDI value was based on the location of a cell’s axon hillock, we further separated the cells whose axon hillocks located in layer 6 into two groups: layer 5/6 border cells and layer 6 cells. Cells with their axon hillock within one average cell body diameter beneath layer 6 typically span both layers and have LDIs between 1.01 and 1.14 (1 < LDI ≤ 1.14), and were considered as a separate group defined as layer 5/6 border cells. Layer 6 cells are defined as cells with LDI values between 1.14 and 2 (1.14 < LDI < 2).
Somal volume
To measure the three-dimensional volume of a soma, we outlined cross-sections of the soma at ≈ 1.5-μm intervals from the top to the bottom of that cell body to yield at least eight contours per cell. Cross-sectional outlines were drawn using Neurolucida software (MicroBright-Field, Williston, VT). Shrinkage correction, based on known section thickness at the time of cutting relative to the measured thickness after staining and mounting, was individually applied to each cell in the measurement of somal volume and dendritic lengths. The average shrinkage percentage of all cells drawn was ≈ 64%.
Somal volume was calculated by summing the volumes of the convex hulls defined by each pair of adjacent cross-sectional outlines. We calculated that using this method with eight evenly spaced contours over a spherical surface produces volume estimates that are within 95% of the actual volume of a sphere. Cell volume calculations were implemented using MatLab (MathWorks, Natick, MA).
Blob distance index (BDI)
BDI was calculated by dividing the lateral distance from the center of the apical dendrite to the center of the closest adjacent blob, by the distance from that same apical dendrite to the center of the other adjacent blob. This will yield an index between 0 and 1. An index of 0 indicates that the apical dendrite is located directly in or underneath the center of a blob; an index of 1 corresponds to an apical dendrite that lies directly in or underneath the center of an interblob region.
Complete morphological reconstruction and dendritic measurements from selected “biased” sampling of isolated cells
In order to extract the detailed morphology of individual labeled neurons, it was often necessary to focus on isolated labeled cells far from the regions of dense labeling (Fig. 2B,B′). The densely labeled zones are likely to correspond to the retinotopic locations matched to the center of injection sites. Those dense regions of labeled dendritic and axonal processes make it impossible to accurately reconstruct individual neurons without confusing the processes between them (Fig. 2A,A′). Therefore, cells similar to the one depicted in Figure 2B,B′ are chosen for complete dendritic morphology reconstruction, using Neurolucida software (MicroBrightField).
Quantifications of somal volume, laminar distribution, and blob/interblob preference of labeled cells were performed as described above for the “unbiased” population data. Moreover, the reconstructed dendritic morphology allowed the computation of dendritic length and lateral dendritic spread—the quantitative measurements that were used to further characterize the different cell types. Total dendritic length is the sum of all dendritic segments, and was performed using MatLab (MathWorks). Sholl (1953) analyses were performed using Neurolucida software (MicroBrightField) to examine the lateral spread of basal dendrites.
Statistical analyses were performed using JMP Statistical Discovery Software (SAS Institute, Cary, NC). TIFF images of the SC and area MT shown in Figure 1 were acquired using the Carl Zeiss Axio Observer Z1 inverted light microscope (Carl Zeiss, Jena, Germany). TIFF images of V1 neurons shown in Figure 2 were taken with the Hamamatsu Orca C4742-95-12NRB camera (Hamamatsu, Hamamatsu City, Japan) and Leica DMRB microscope (Leica Microsystems, Wetzlar, Germany) using Openlab software (Perkin Elmer, Waltham, MA). Figure 2A′,B′ were taken at three different planes and processed to generate a single in-focus image using the ImageJ plug-in “Stack Focuser” (Abramoff et al., 2004).
RESULTS
SC-projecting V1 neurons
Transsynaptically incompetent GFP expressing rabies virus was injected into monkey SCs using stereotaxic coordinates obtained from collicular recordings (see Materials and Methods). Following a survival period of 5–7 days the animals were perfused; their brains were sectioned and stained with an antibody against GFP. The locations of injections were histologically confirmed (Fig. 1).
We observed many labeled cells in V1 and other extrastriate cortices, along with many labeled retinal ganglion cells in the retina. However, this report will only focus on the labeled SC-projecting neurons in V1.
Population data
After injections of the modified rabies virus in SC, labeled cells were found exclusively in deep layers of V1, clustering around the border between layers 5 and 6 (Figs. 2, 4A), as expected from previous studies (Fries, 1984). Cells were found in both calcarine and opercular surfaces.
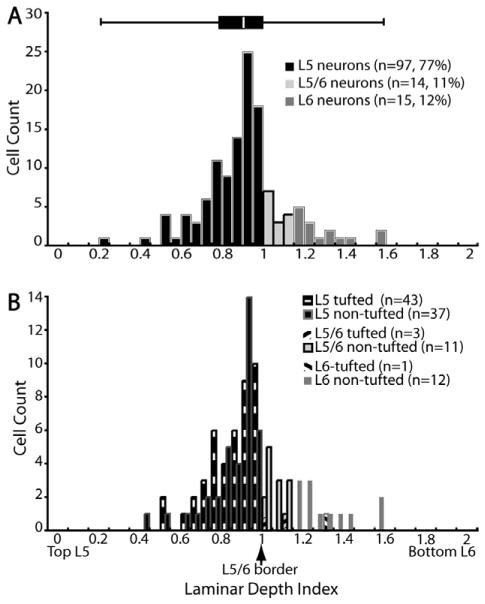
Figure 4.
Laminar distribution of SC-projecting neurons in layers 5 and 6. A: Distribution of neurons in layers 5 and 6 (n =126). Population data is obtained by sampling every cell on every 12th section of the entire striate cortex of monkey HMN2 (see Materials and Methods). Location of soma is expressed as laminar depth index. LDIs of 0, 1, and 2 correspond to somata located at the top of layer 5, at the border between layers 5 and 6, and at the bottom of layer 6, respectively. The overlaying box-whisker plot (top) shows the median, first, and third quartile of the distribution, as well as the maximum and minimum values. Bin size =0.1. B: Laminar distributions of tufted vs. nontufted SC-projecting cells (n =107). Of the 126 cells sampled, 107 cells have identifiable apical dendrites (see Results), and are categorized as tufted vs. nontufted. Tufted refers to the same cell type that is called tall-tufted in the text of the manuscript.
We classified cells into layer 5, layer 5/6 border, and layer 6 neurons based on the method used to define somal location (see Materials and Methods). By counting every cell in every 12th section as a means to obtain representative population data, we found a total of 126 cells in V1 of animal HNM2. Among this population of cells, 77% of SC-projecting neurons in V1 are located in layer 5 (n =97), and 12% in layer 6 (n =15) (Fig. 4A). Eleven percent of cells have cell bodies that cross the layer 5/6 border (n =14).
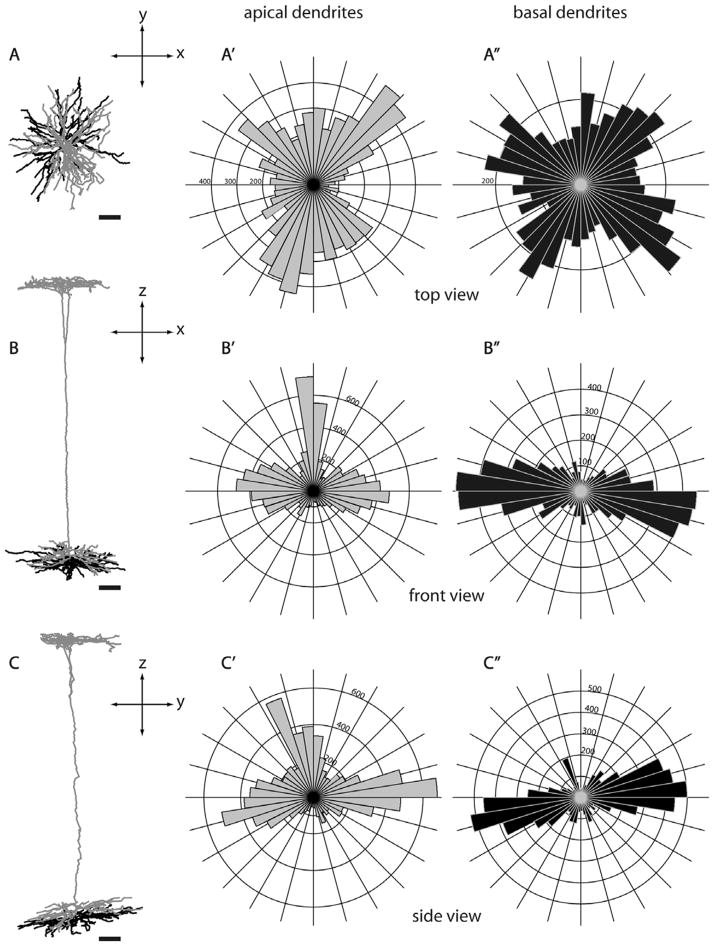
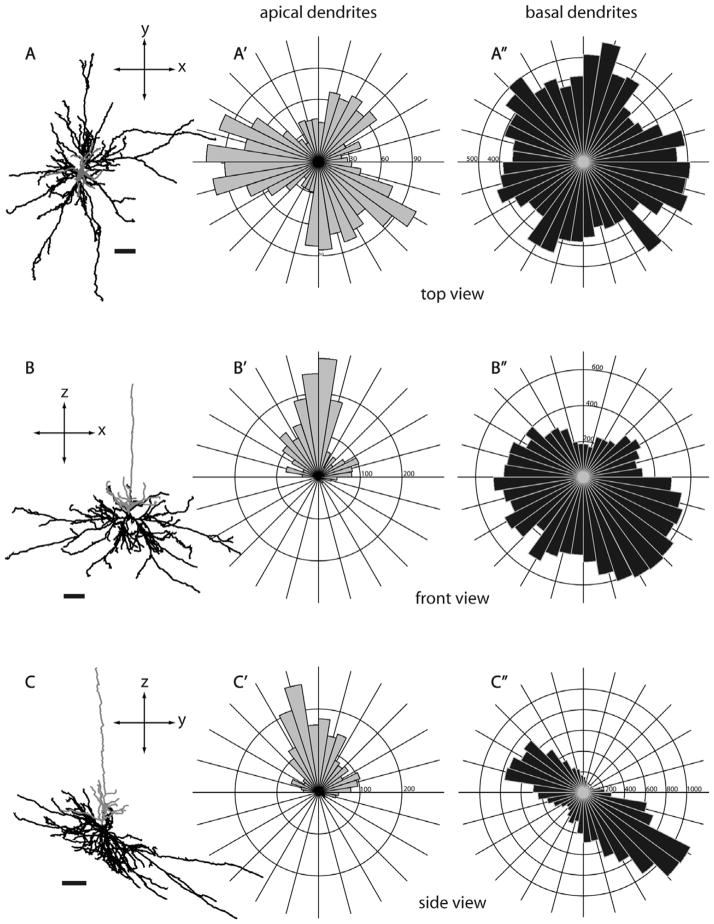
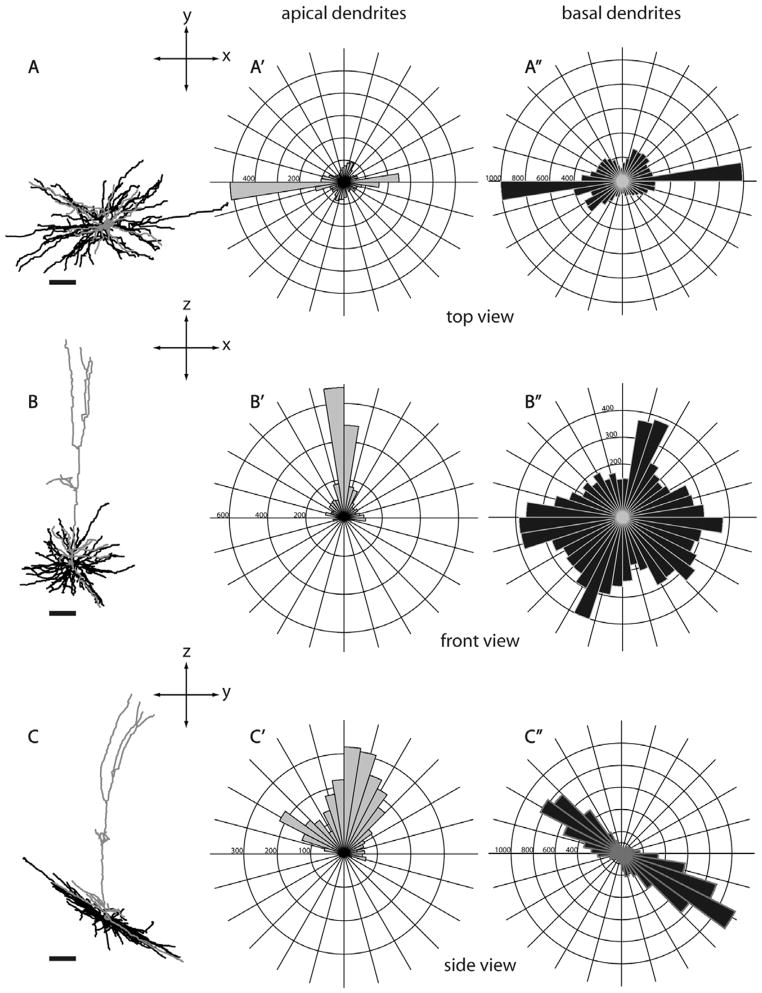
Dendritic reconstruction revealed three major cell types in V1 sending projections to SC: layer 5 tall-tufted, layer 5 nontufted, and layer 6 nontufted (Fig. 3). “Tall-tufted” cells are defined as those with an apical dendrite extending to layer 1 and forming a tuft with more than two branches (Fig. 3A). The apical dendrites of nontufted cells remain as a single branch ending anywhere between layers 2 and 5, without forming a tuft, and do not extend into layer 1 (Fig. 3B,C). Further illustrations of the 3D reconstructions are shown for one selected cell of each type, along with polar histograms showing the lengths of dendritic arbor extending in different directions (Figs. 5–7). We were able to categorize the apical dendritic morphology and termination layer of the apical dendrite for 107 of those 126 cells (Fig. 4B). Nineteen cells were classified as having “unidentifiable” apical dendrites (see Materials and Methods).
Figure 5.
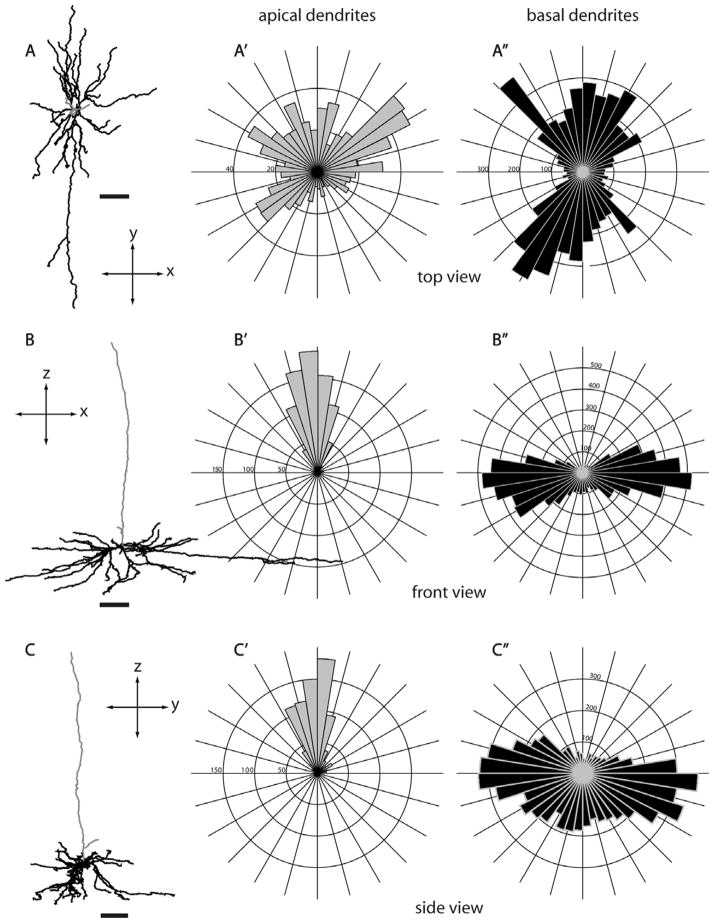
Morphology of a layer 5 tall-tufted SC-projecting neuron from three different views. Three different views of a layer 5 tall-tufted neuron (L391, see also Fig. 3A): top view (A,A′,A″), front view (B,B′,B″), and side view (C,C′,C″). Circular histograms show the radial distributions of dendritic length (in μm) of apical dendrites (gray, A′,B′,C′) and basal dendrites (black, A″,B″,C″). The distribution of apical dendritic branches is very similar to the basal dendritic branches. The top view of the dendritic reconstruciton shows that both apical and basal dendrites emanate radially in all directions extending up to about 300 μm from the cell body. Bin size, 0.15 radian. Scale bars for dendritic reconstructions =100 μm.
Figure 7.
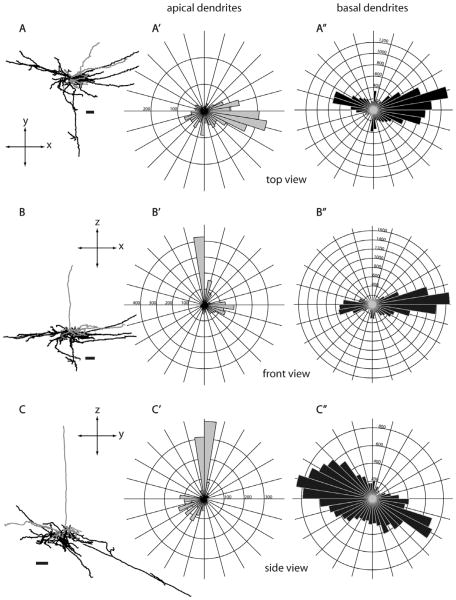
Morphology of a layer 6 nontufted SC-projecting neuron from three different views. Although the side view (C) of this layer 6 nontufted cell (L468, see also Fig. 3C) suggests that there is a single dendritic branch that extends much farther than any others, the top view (A) shows that other basal dendrites also extend to similar distances from the cell body, but were compressed in the side-view projection. Same conventions as in Figure 5.
Among all the SC-projecting neurons in layer 5, 54% (43/80 identifiable) are tall-tufted and 46% (37/80) are nontufted, with the majority of the layer 5 nontufted cells situated close to the layer 5/6 border (Fig. 4B). Almost all layer 6 neurons are distinctively nontufted as illustrated in Figure 3 (n =12/13) with one exception—a pyramidal neuron with an apical dendrite extending to and forming a very small tuft in layer 1 (data not shown). The majority of layer 5/6 border neurons are nontufted (n =11/14) (Fig. 4B). It is likely that the majority of layer 5/6 border neurons, as defined by our criteria, are actually layer 6 neurons (see Materials and Methods).
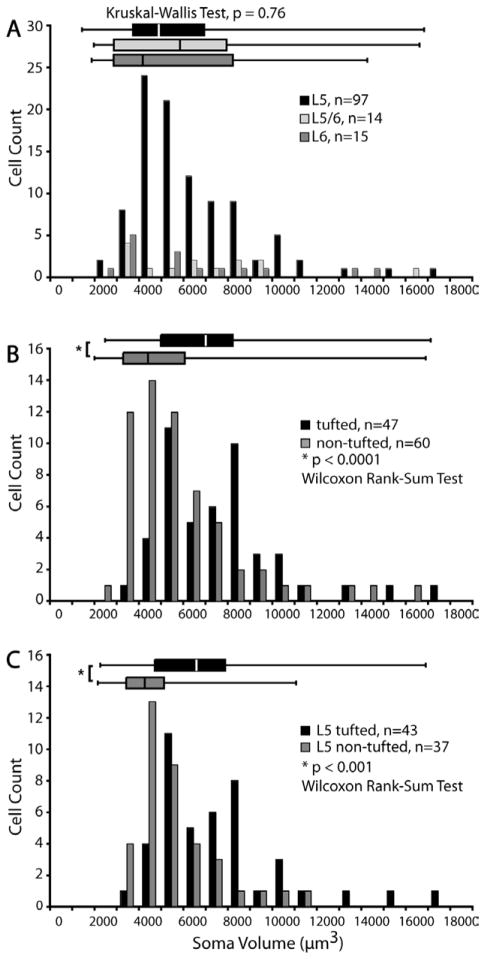
Distributions of somal volume of the three groups overlap completely: mean layer 5 somal volume is 5,391 ± 2,565 μm3, layer 5/6: 5,966 ± 3,661 μm3, and layer 6: 5,845 ± 4,053 μm3 (Fig. 8A, Table 3). Fries and Distel (1983) reported that most layer 6 SC-projecting neurons in their study had larger basal diameters than layer 5 pyramidal cells. We expect that this is also true of our sample since, in contrast to tall-tufted cells, the nontufted cells have much longer basal dendrites extending laterally from the cell body (see below) which give them the broad base characteristic of Meynert cells (le Gros Clark, 1942). However, instead of using basal diameter as a measurement of cell body size, which is subjective and nonreproducible, we devised a more reliable and reproducible method to measure the volume of each cell (see Materials and Methods). Our population data reveal that layer 6 cells have a wide range of somal volumes, ranging from 2,000 to 14,000 μm3, indistinguishable from those of layer 5 cells (Fig. 8A). There was no significant difference in the distributions of cell body sizes between layer 5 and layer 6 neurons (P > 0.87, Kruskal–Wallis test).
Figure 8.
Distributions of somal volumes for SC-projecting neurons in V1. A: Comparisons of the distributions of somal volumes for neurons in layer 5 (black), layer 5/6 border (light gray), and layer 6 (dark gray) (n =126). No significant correspondence between laminar distribution and somal volume is observed. All three cell groups have overlapping distributions of somal volume (P =0.79, Kruskal–Wallis test). The box-whisker plots (top) show the median, first, and third quartile of each distribution, as well as the maximum and minimum values for each group. Bin size =1,000 μm3. B: Comparisons of the distributions of somal volumes between all tufted (black) and all non-tufted (gray) cells (n =107). The tall-tufted cells have significantly larger somal volumes than the nontufted cells (P < 0.001, Wilcoxon rank sum test). Bin size =1,000 μm3. C: Comparisons of the distributions of somal volumes between layer 5 tufted (black) and layer 5 nontufted (gray) cells. Layer 5 cells exhibit a trend similar to the population for all SC-projecting cells, with layer 5 tall-tufted cells having significantly larger somata than layer 5 nontufted cells (P < 0.001, Wilcoxon rank sum test). Bin size =1,000 μm3. Tufted refers to the same cell type that is called tall-tufted in the text of the manuscript.
TABLE 3.
Somal Sizes of Superior Colliculus- and Middle Temporal Area-Projecting Neurons in V1
| Mean somal volume (mean ± std, μm3) of:
|
|||||
|---|---|---|---|---|---|
| All cells by layer | Tall-Tufted cells | Nontufted cells | Cells with unidentifiable apical dendrite | ||
| SC-projecting | All cells | 5509 ± 2887 (n =126) | 6772 ± 2885 (n =47) # | 5003 ± 2806 (n =60) # | 3983 ± 1822 (n =19) |
| Layer 5 | 5391 ± 2565 (n =97) | 6563 ± 2853 (n =43) ^ | 4743 ± 1898 (n =37) ^ | 4025 ± 1877 (n =17) | |
| Layer 5/6 border | 5966 ± 3661 (n =14) | 7823 ± 995 (n =3) | 5459 ± 3988 (n =11) | n/a | |
| Layer 6 | 5845 ± 4053 (n =15) | 8639 ± 0 (n =1) | 5652 ± 3943 (n =12) | 3629 ± 1760 (n =2) | |
| MT-projecting | Layer 6 | 4259 ± 2587 (n =5) | n/a | 4259 ± 2587 (n =5) | n/a |
Pairs of means with the same symbols are significantly different from each other, P < 0.001, Wilcoxon rank-sum test.
However, all the tall-tufted cells as a group have significantly larger somata than the nontufted group (P < 0.001, Wilcoxon rank sum test, see Fig. 8B). This trend holds true when we compared only layer 5 tufted versus layer 5 nontufted cells (P < 0.001, Wilcoxon rank sum test, see Fig. 8C), but not for layer 5/6 or layer 6 neurons due to the small numbers of tufted cells in those two groups (Table 3).
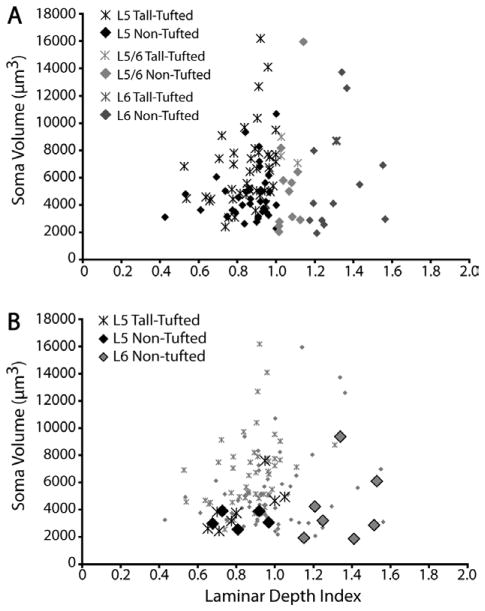
The high cell density near the layer 5/6 border along with the large cell bodies of layer 5 tall-tufted cells give the subjective impression that many layer 5 tall-tufted cells are clustered near the border (Fig. 9A). However, no correlation between somal volume and LDI was found. Somal sizes of layer 5/6 border neurons and layer 6 neurons do not have any correlation with laminar depth (Fig. 9A).
Figure 9.
Relationships between somal volume and laminar depth for SC-projecting V1 neurons. A: Distributions of somal volume across laminar depth for all SC-projecting neurons in layer 5 (black), layer 5/6 border (light gray), and layer 6 (dark gray). Although the few largest neurons appear to be at the bottom of layer 5, there is not a significant correlation between somal volume and laminar depth. B: Relationships between somal volume and laminar depth index for the 21 reconstructed cells (big symbols) compared to the “unbiased” population (small symbols).
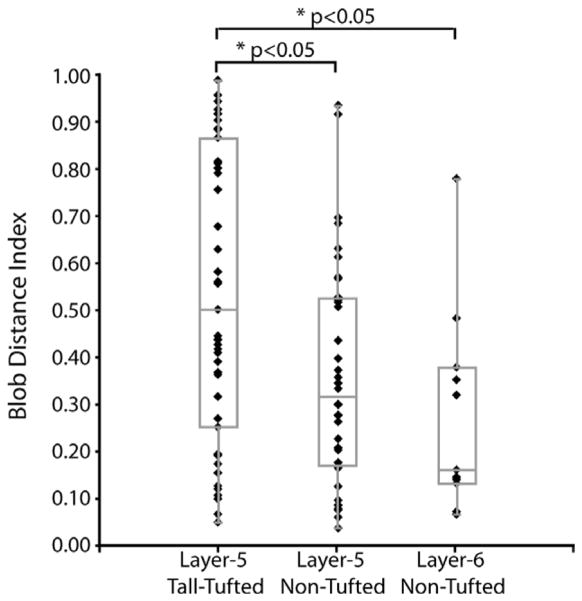
The apical dendrites of layer 5 tall-tufted cells have no clear blob/interblob preference (mean BDI =0.53 ± 0.31), while layer 5 nontufted neurons seem to have a slight blob preference (mean BDI =0.36 ± 0.24). Similarly, layer 6 nontufted cells have a mean BDI of 0.27 ± 0.22 (Fig. 10), suggesting a bias toward blobs. In general, even though the distributions of the three populations overlap, nontufted neurons of both layers 5 and 6 seem to be more blob-biased compared to the tall-tufted cells.
Figure 10.
Locations of different types of SC-projecting cells relative to CO blob centers. Blob distance index (BDI) is determined for three cell types: layer 5 tall-tufted, layer 5 nontufted, and layer 6 nontufted. A: BDI value of 1 indicates that the apical dendrite of the cell lies directly in or underneath the center of an interblob, at an equal distance from the two closest blobs, and a BDI of 0 means directly in or underneath the center of a blob. Every neuron from the unbiased sample (n =107) is plotted as a separate symbol. Layer 5 tall-tufted cells (n =43) have no preference for either blob or inter-blob regions, with BDI values evenly distributed (median =0.50, min =0.05, first quartile =0.25, third quartile =0.86, max =0.98, box-whisker plot). The nontufted cells in layer 5 (n =36) and layer 6 (n =11) tend to be located preferentially under blobs with median BDI values of 0.31 and 0.16, respectively. The distributions of BDIs for both the layer 5 and layer 6 nontufted cells are significantly smaller than for layer 5 tall-tufted cells (P < 0.05, Wilcoxon rank sum test).
Reconstruction of selected cells
To reveal the detailed morphology of the SC-projecting neurons in V1, we used Neurolucida reconstruction software to reconstruct only the isolated neurons in locations where little or no dendritic or axonal processes of other labeled neurons could interfere with the reconstruction (for example, see Fig. 2B,B′). We are aware that the selection process might create sampling biases and affect the representation of cell types in each population. However, because quantitative measures of these cells are similar to those in the “unbiased sample,” effects of this selection method do not appear to critically alter our conclusions.
Twenty-one SC-projecting neurons in V1 were selected for reconstruction: 13 were classified as layer 5 and eight as layer 6 neurons (Table 4). One of the layer 5 neurons was at the layer 5/6 border (LDI of 1.05), with a cell body that spanned the border. Because of the morphological similarity of this cell to all other layer 5 neurons (see below), but not to any layer 6 neurons, it was classified as a layer 5 pyramid. None of the selected layer 6 neurons were located in the layer 5/6 border region. The LDI values and somal sizes of the eight reconstructed layer 6 neurons are representative of the layer 6 population (Fig. 9B). While the LDIs of the reconstructed layer 5 neurons are representative of their population, their mean somal size is smaller than the mean somal size of the population (P < 0.01, Wilcoxon rank sum test). It was more difficult to reconstruct layer 5 cells with bigger somata because they are generally located at the border between layers 5 and 6, in the middle of some of the densest labeled regions; hence, the numbers of cells of this type that could be reconstructed underrepresents the population. None of the few layer 5 cells with the very largest somata (e.g., Fig. 9) were reconstructed and these are therefore not represented in the “biased sample.”
TABLE 4.
All Reconstructed SC- and MT-Projecting Neurons in V1
| Total number of cells | Tall-tufted | Nontufted | ||
|---|---|---|---|---|
| All cells | 27 | 10 | 17 | |
| SC-projecting | Layer 5 | 13 | 8 | 5 |
| Layer 6 | 8 | 1 | 7 | |
| MT-projecting | Layer 5 | 1 | 1 | 0 |
| Layer 6 | 5 | 0 | 5 |
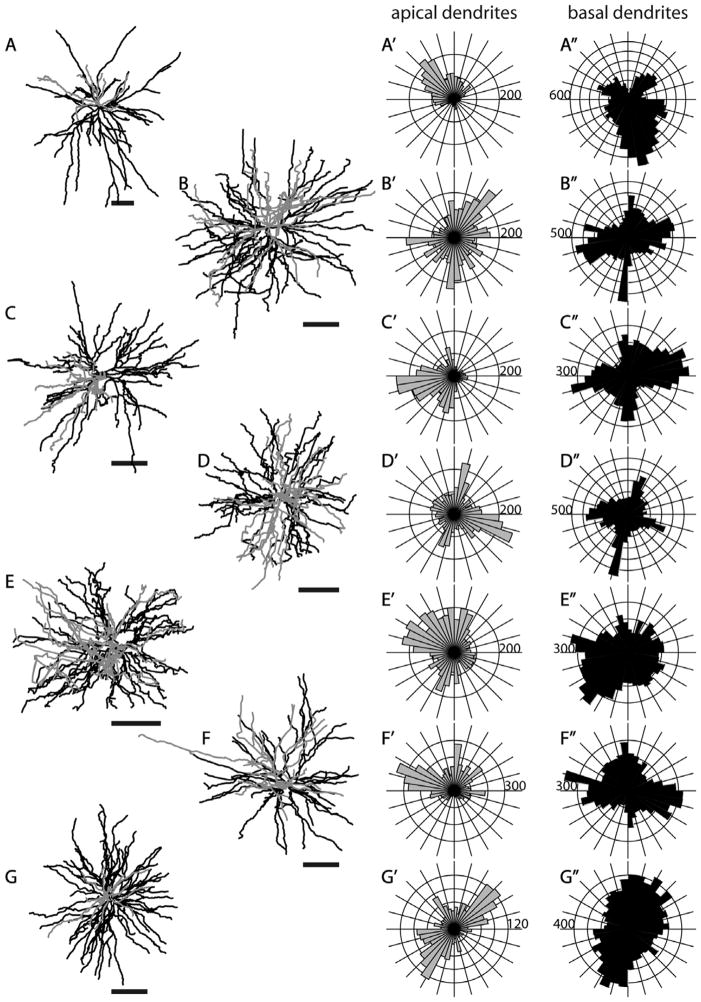
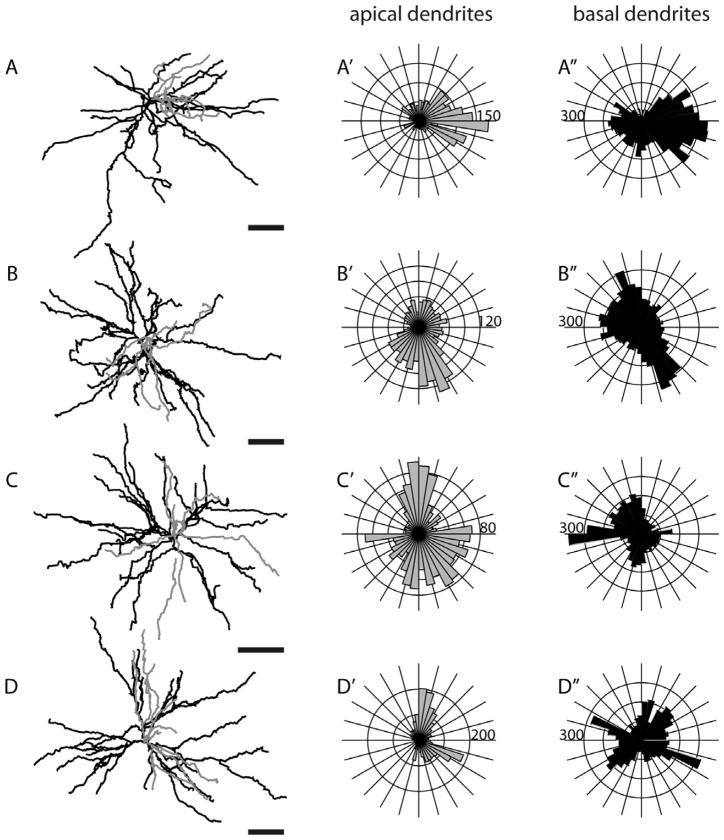
Eight of the 13 reconstructed layer 5 neurons are “tall-tufted” neurons (Figs. 3A, 5). These neurons have an apical dendrite that forms a tuft in layers 1 and 2, and does not have side-branches in lower layers 3 or 4. Thus, the laminar distribution of apical dendritic length is focused on layers 1 and 5, with a smaller contribution to layer 2 (Fig. 3A,A′). The basal dendrites of layer 5 tall-tufted pyramids are densely packed in layers 5 and 6 (Fig. 3A′), and only extend laterally to about 300 μm on average (Figs. 11A′, 12B). Top views, as well as circular histograms showing the radial distributions of dendritic length, are shown for these tall-tufted neurons with apical and basal dendrites analyzed separately (Fig. 13). Both apical and basal dendrites extend radially and evenly from the axis going through the cell body, parallel with the apical dendrite. There is a small degree of individual variability among cells within this population in terms of dendritic length distribution (Fig. 11A) but the overall morphology is very consistent (Figs. 3A and 13).
Figure 11.
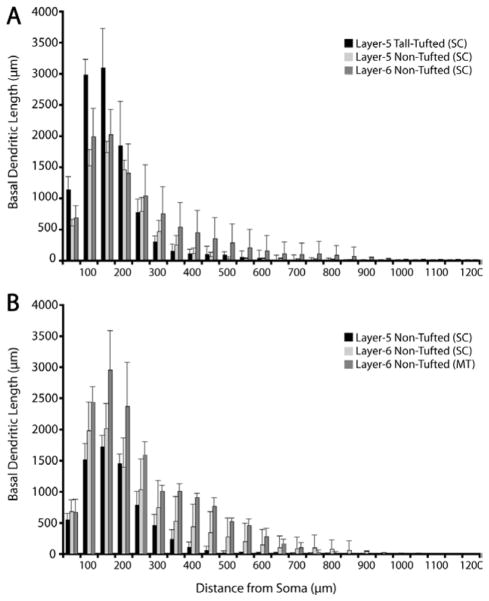
Dendritic distribution of different types of SC-projecting V1 neurons expressed by Sholl analyses. Sholl analyses of dendritic distribution in relation to distance from soma for layer 5 tall-tufted (A,A′, n =8), layer 5 nontufted (B,B′, n =5), and layer 6 nontufted cells (C,C′, n =7). A–C depict individual variability of total dendritic length within each population. Traces in various shades of gray represent individual neurons. Thick black trace represents the average total dendritic length at various distances from soma. Bin size =50 μm. A′,B′,C′emphasize the extent of lateral spread between apical (gray) and basal (black) dendrites (mean ± SD), showing that layer 6 nontufted cells have the longest basal dendritic spread. Note the secondary peaks in the distributions for layer 5 tall-tufted cells (A) correspond to the apical tufts (see also A′).
Figure 12.
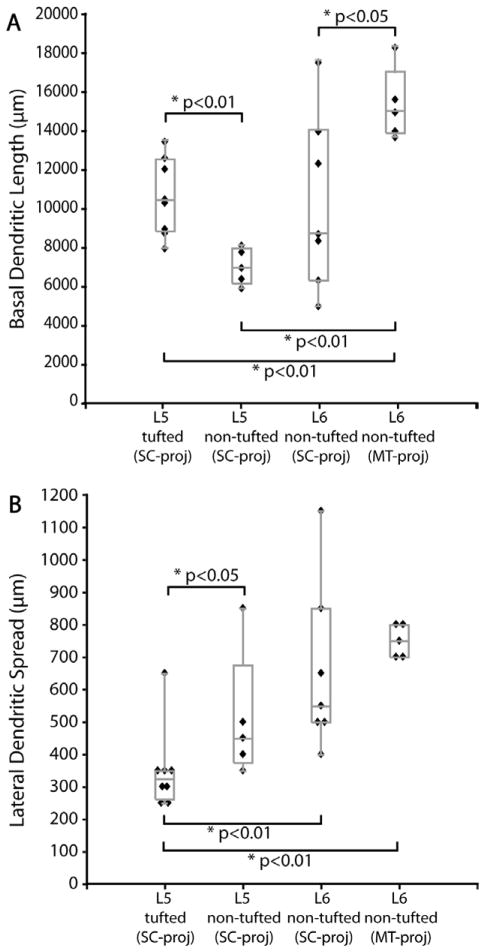
Comparisons between four types of SC- or MT-projecting V1 neurons for total basal dendritic length (A) and lateral spread of basal dendrites (B). Box-whisker plots (gray) show the median, first, and third quartile, as well as minimum and maximum values. Values are from all the reconstructed neurons, each of which is also plotted separately. Significant differences (Wilcoxon rank sum test) are indicated by brackets and corresponding P values. Tufted refers to the same cell type that is called tall-tufted in the text of the manuscript.
Figure 13.
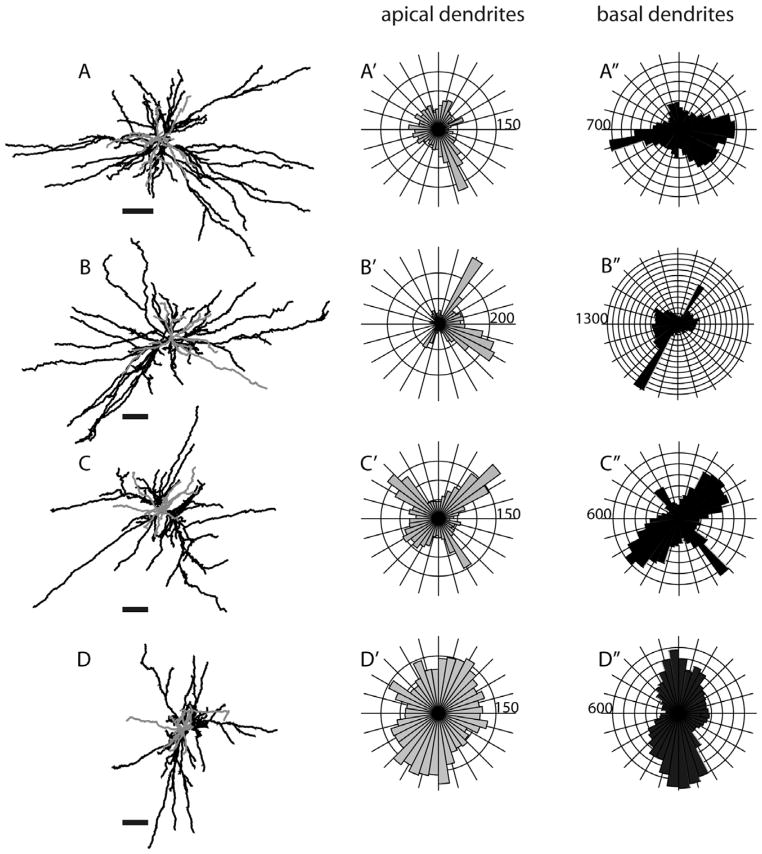
Morphologies of layer 5 tall-tufted SC-projecting neurons. Top views, as well as circular histograms showing the radial distributions of dendritic length (μm), for all Neurolucida reconstructed neurons with apical and basal dendrites analyzed separately. Same conventions as in Figure 5. The numbers on the polar histograms indicate the dendritic length value at the outermost ring of each histogram. Scale bars for dendritic reconstructions =100 μm.
Five of the 13 reconstructed layer 5 neurons are defined as “nontufted” neurons (Figs. 3B, 6, 14) because they have a single tuftless apical dendrite that extends toward but does not project beyond layer 2/3. These neurons have many branches in layer 5. Individual variability within this population regarding distribution of dendritic length is very low (Fig. 11B). This cell type has a very distinct dendritic distribution profile compared to their layer 5 tall-tufted counterparts. The percentages of basal dendrites of layer 5 nontufted neurons are distributed evenly between layer 5 and 6 (Fig. 3B′), while twice as many basal dendrites of layer 5 tall-tufted cells are distributed in layer 5 than in layer 6 (Fig. 3A′). Relative to layer 5 tall-tufted neurons, the basal dendrites of layer 5 nontufted neurons are also much sparser and somewhat longer. This is evidenced by the highly significant difference in total basal dendritic length (Fig. 12A) as well as the small but still significant difference in lateral dendritic spread (Fig. 12B). These differences are also apparent from the Sholl analyses of the basal dendrites of these two cell types (Fig. 11A,B).
Figure 6.
Morphology of a layer 5 nontufted SC-projecting neuron from three different views. This cell (L508, see also Fig. 3B) has sparser dendritic trees than most layer 5 tall-tufted neurons, and does not extend its dendrites as uniformly in all directions as the layer 5 tall-tufted cell described in Figure 4. Even though total dendritic length is distributed symmetrically (top view, A′,A″), there is one long basal dendritic branch (can be seen in the reconstruction, A′) that extends to about 400 μm farther from the cell body than any other dendritic branches. Same conventions as in Figure 5.
Figure 14.
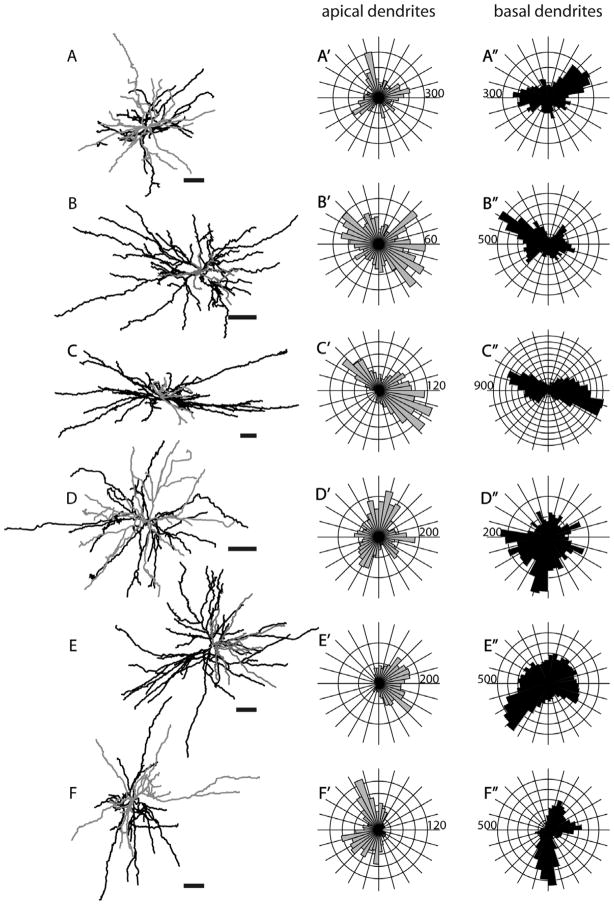
Morphologies of layer 5 nontufted SC-projecting neurons. Same conventions as in Figure 5. Scale bars for dendritic reconstructions =100 μm.
The overwhelming majority of layer 6 SC-projecting neurons in V1 have nontufted morphology. Of the 15 layer 6 cells found in our unbiased sample, 12 were nontufted layer 6 cells, two had apical dendrites that were unidentifiable due to noise, and one was a layer 6 cell with a very small apical tuft in layer 1 (data not shown). Seven layer 6 neurons were selected for reconstruction (Figs. 3C, 15). The distributions of LDIs and somal sizes of these reconstructed neurons are similar to those observed for the overall population (Fig. 9B).
Figure 15.
Morphologies of layer 6 nontufted SC-projecting neurons. Same conventions as in Figure 5. Scale bars for dendritic reconstructions =100 μm.
All layer 6 SC-projecting neurons are located in the upper half of layer 6. Nearly all have a nontufted apical dendrite extending upward as far as layer 2/3 with a slight preference for blob regions and have branching of apical dendrites in layers 5 and 6 (Fig. 3C). In general, these layer 6 cells have a similar morphology to layer 5 non-tufted cells, with long and laterally spreading basal dendrites being their most prominent characteristic (Figs. 3C,C′, 7, 11C,C′). Similar to layer 5 nontufted pyramids, the basal dendrites of nontufted layer 6 cells are relatively long and can extend laterally as far as 1.2 mm from the soma (Fig. 12B). There is no significant difference in the lateral dendritic spread between layer 5 and layer 6 non-tufted pyramids (Fig. 12B), nor in their total basal dendritic length (Fig. 12A), but both cell types have greater lateral spread than layer 5 tall-tufted pyramids (Fig. 12B) (P < 0.01, Wilcoxon rank sum test). Although there is a striking similarity between layer 5 and layer 6 nontufted pyramids, the layer 6 pyramids distribute nearly all of their basal dendrites within layer 6 rather than spreading them evenly between layers 5 and 6 (Fig. 3B′,C′) and this gives the appearance of greater basal dendritic density for the layer 6 nontufted cells (Fig. 3B,C).
MT-projecting V1 neurons
After injections of rabies virus in the MT in both hemispheres of monkey HNM3, labeled neurons were found in layers 4B and 6 of V1, as reported in previous studies (Spatz et al., 1970; Lund and Boothe, 1975; Maunsell and van Essen, 1983; Fries et al., 1985; Shipp and Zeki, 1989; Krubitzer and Kaas, 1990; vogt Weisenhorn et al., 1995; Sincich and Horton, 2003; Nassi and Callaway, 2006). Figure 1B confirms that the location of injection was indeed in area MT. This is further supported by the expectation that an injection involving the adjacent cortical area V4 would have retrogradely labeled neurons in layer 2/3 (Yukie and Iwai, 1985), which was not observed.
By counting every GFP-labeled cell in the entire primary visual cortex of monkey HNM3, we found that the neurons projecting to area MT were located predominantly in layer 4B (97.8%) with only a few located in layer 6 (2.2%). Twenty-six layer 4B neurons were found in the left primary visual cortex, while 312 layer 4B cells were found in the right primary visual cortex, with 82% being spiny stellates and 18% pyramids. The strong bias toward spiny stellate neurons in layer 4B was expected based on a previous study using the same methods (see Nassi and Call-away, 2007). Only six labeled neurons were discovered in layer 6 and, interestingly, one in layer 5 (Table 4).
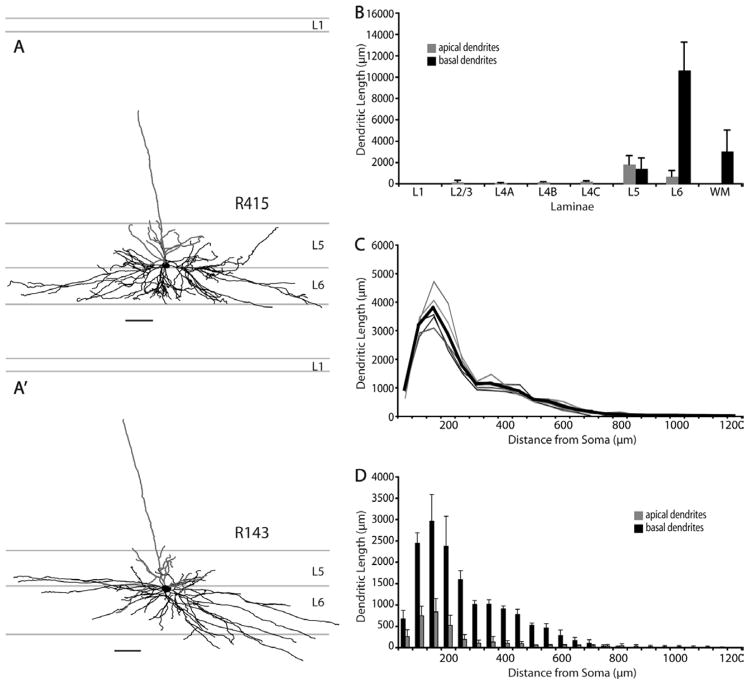
Of the six layer 6 MT-projecting neurons in V1, only five were reconstructed; one was lost to tissue damage. These layer 6 neurons reside in the upper half of layer 6, with LDI ranging from 1.06 to 1.42. All of these neurons have nontufted morphology and long lateral basal dendrites, similar to the SC-projecting nontufted neurons in both layers 5 and 6: apical dendrites restricting the majority of their branches to layer 5 with a single tuftless branch extending toward the cortical surface but only reaching as far as layer 2/3, and their basal dendrites are long and confined to layer 6 (Fig. 16). A 3D view of a layer 6 MT-projecting cell and polar histograms of dendritic length are shown in Figure 17, and the top views of all other layer 6 MT cells are shown in Figure 18. One very unique feature of MT-projecting layer 6 cells that distinguishes them from all types of SC-projecting cells is the total length of their dendritic tree: their total basal dendritic lengths are significantly greater than all SC-projecting cell types (all comparisons have P < 0.05, Wilcoxon rank sum test, Fig. 12A). Despite the difference in total basal dendritic length, there is no significant difference in the lateral dendritic spread of MT-projecting nontufted neurons compared to SC-projecting nontufted neurons (Fig. 12B); however, all three types of nontufted cells have significantly greater lateral dendritic spread than layer 5 tufted pyramids (Fig. 12B).
Figure 16.
Morphologies and dendritic distributions of MT-projecting neurons in V1. A,A′: Morphologies of layer 6 nontufted MT-projecting neurons. This cell type has similar morphological appearance to the nontufted SC-projecting neurons. Their apical dendrites restrict the majority of their branches to layer 5 with a single branch extending toward the cortical surface but only reaching as far as layer 2/3, while their basal dendrites are confined to layer 6 and extend long distances laterally. B: Histogram of laminar distribution of apical (gray) and basal (black) dendrites for all reconstructed MT projecting layer 6 nontufted cells (n =5). Values represent mean ± SD. C: Sholl analyses depict individual variability of total dendritic length within the population. Traces in various shades of gray represent individual neurons. Thick black trace represents the average total dendritic length at various distances from soma. Bin size =50 μm. Same conventions as used in Figure 11. D: Sholl analysis of apical (gray) and basal (black) dendritic distribution showing the density of basal dendrites and the extent of spread between apical and basal dendrites. Values represent mean ± SD. Scale bars =100 μm.
Figure 17.
Morphology of a layer 6 nontufted MT-projecting neuron (R415, see also Fig. 16A) from three different views. Same conventions as in Figure 5. Scale bars for dendritic reconstructions =100 μm.
Figure 18.
Morphologies of layer 6 nontufted MT-projecting neurons. Same conventions as in Figure 5. Scale bars for dendritic reconstructions =100 μm.
Comparison of Sholl analyses of basal dendrites across nontufted pyramidal cell types shows that the MT-projecting cells have greater dendritic length at all distances from the soma and this difference is proportionately greater as the distance from the soma grows larger (up to 700 μm from the soma) (Fig. 19B). This difference reflects the greater average density of basal dendrites from MT-projecting nontufted versus SC-projecting nontufted neurons. Note, however, that the basal dendritic length of a subset of layer 6 SC-projecting, nontufted neurons overlaps with the length for MT-projecting neurons (Fig. 12A), consistent with the possibility that a subset of SC-projecting neurons also have collaterals to area MT (see Discussion). No significant difference was found in somal sizes between MT-projecting versus SC-projecting neurons (Table 3).
Figure 19.
Comparisons of basal dendritic spread for 3 types of SC-projecting neurons (A) and for SC- versus MT-projecting non-tufted neurons (B). A: Sholl analyses of basal dendritic lengths for the three SC-projecting populations illustrate the longer dendrites of the tall-tufted neurons at locations close to the soma versus the relatively longer dendrites of the layer 6 nontufted neurons farther from the soma. B: Sholl analyses comparing the nontufted cells projecting to SC or MT illustrate the longer dendrites of MT-projecting neurons at nearly all distances from the cell body when compared to SC-projecting, nontufted neurons. Values represent mean ± SD.
In the experiment with HNM3, we attempted to identify the SC-projecting cell group that also sends collaterals to MT, as previously reported (Fries et al., 1985). We injected tetramethylrhodamine dextran in the SC and the modified rabies virus in area MT. However, no double-labeled neuron was found. This is likely due to a mismatch of topographic locations between the SC rhodamine injection sites and the MT virus injections. The data presented here show that the layer 6 MT-projecting cells in V1 have a similar morphology to at least a subset layer 6 SC-projecting neurons in V1 (Figs. 3C, 16A). They have similar dendritic distributions (Figs. 3C′, 16B), somal sizes (Table 3, P =0.52, Wilcoxon rank sum test), and lateral dendritic spread (P =0.22, Wilcoxon rank sum test, and see Figs. 11C,C′, 16C,D, 19B). Thus, some or perhaps even all of the layer 6 MT-projecting neurons could have collaterals that also terminate in SC (Fries et al., 1985).
One unique MT-projecting neuron was found in this experiment that has not been described previously (Fig. 20). While all previous studies reported that MT-projecting neurons are located in only in layers 4B and 6, we found one MT-projecting neuron in layer 5 (LDI =0.66, somal volume 3,550 μm3). This layer 5 tall-tufted neuron has an apical dendrite that extends to layer 1 and forms a tuft that narrowly arborizes in layer 1. However, the apical tuft of this cell begins to bifurcate from the main apical shaft at the bottom of layer 2/3 and forms a side branch in layer 4B—a distinct morphology different from all other layer 5 tall-tufted SC-projecting neurons, whose apical tufts branch out in layer 2.
Figure 20.
A layer 5 MT-projecting neuron in V1. The apical dendrite of this cell extends to layer 1 and forms a tuft. However, different from layer 5 tall-tufted SC-projecting neurons, the apical tuft of this cell begins to bifurcate from the main apical shaft at the bottom of layer 2/3, and has a small side branch in layer 4B. This is the only MT-projecting neuron encountered in layer 5 and its morphology differs from the morphologies of all other layer 6 MT-projecting neurons, which are nontufted. Same conventions as in Figure 5. Scale bars for dendritic reconstructions =100 μm.
Lateral distributions of dendritic arbors
It has previously been suggested that layer 6 MT-projecting Meynert cells might become direction selective by sampling inhibition and excitation asymmetrically as a result of asymmetries in their basal dendrites (Livingstone, 1998) and some publications describing Meynert cells have described at least a subset as having one basal dendrite that is much longer than the others (le Gros Clark, 1942; Winfield et al., 1983; Valverde, 1985). These anatomical observations are, however, all from observations of incomplete dendritic arbors reconstructed from thin Golgi-stained sections. In the most complete descriptions of the lateral distribution of dendrites, 200-μm sections were cut parallel to the cortical layers of Golgi-impregnated tissue (Winfield et al., 1983). Neurons with long dendrites would be particularly prone to elimination of dendrites by cutting in thin sections, potentially giving the appearance of asymmetry, and perhaps also underestimating dendritic length.
Because the SC- and MT-projecting neurons we describe here were labeled in vivo and were completely reconstructed in three dimensions, we are able to evaluate possible asymmetries of their long dendritic arbors. In order to evaluate possible asymmetries relative to the topographic map of visual receptive fields in V1, it is most informative to view projections looking “down” onto the cortical surface along the length of the apical dendrite. Such “top-down” views, as well as “front” and “side” views are illustrated for several representative neurons in Figures 5–7 and 17. Top views, as well as circular histograms showing the radial distributions of dendritic length, are shown for all Neurolucida reconstructed neurons with apical and basal dendrites analyzed separately (Figs. 13–15, 18). It is clear from these figures that, based on complete reconstructions, none of the 25 pyramidal neurons in our sample display the extreme asymmetry expected if there is just a single long basal dendrite (e.g., Valverde, 1985). Instead, the reconstructions of nontufted cells more closely resemble the reconstructions in tangential Golgi sections (Winfield et al., 1983), but with the longest dendrites extending even further. As noted by Winfield et al. (1983), a cell might have a single basal dendrite that extends further than all the others (e.g., Figs. 6, 14A, 15E, 18C); but our complete reconstructions show that this is relatively rare and that each cell typically has multiple long dendrites. Apical dendrites of a few neurons are highly asymmetric (e.g., Figs. 7, 14A, 15A), but these tend to be short and this is not the case for most neurons.
Although the dendrites of neurons in our sample largely lack a directional bias, basal dendrites of some of the cells have a clear “orientation bias,” with dendrites extending primarily in just two opposite directions away from the cell body. Such biases are not apparent for any of the layer 5 tufted neurons (Fig. 13) but are apparent for some nontufted cells (Figs. 14, 15, 18). This bias is most striking for a subset of the SC-projecting layer 6 neurons (Fig. 15) and is present for all of the MT-projecting layer 6 neurons (Fig. 18). This is therefore another feature for which a subset of layer 6 SC-projecting neurons has a striking similarity to layer 6 MT-projecting neurons.
DISCUSSION
By using modified GFP-expressing rabies virus as a retrograde tracer we were able to confidently and directly identify the complete dendritic morphology of macaque V1 neurons that project corticocortically to area MT or subcortically to SC. We conclude that SC- and MT-projecting neurons are morphologically distinct, including some that have not been previously described in macaques (Lund et al., 1975; Lund and Boothe, 1975; Callaway and Wiser, 1996; Wiser and Callaway, 1996). SC-projecting neurons include two distinct types: the more classically described tall-tufted layer 5 neurons as observed in other mammalian species (Hallman et al., 1988; Kasper et al., 1994; Larsen et al., 2007), and also a more unusual group of nontufted neurons in layers 5 and 6 that may be unique to primates. The MT-projecting neurons include layer 4B cells as described previously (Nassi and Callaway, 2007), as well as a population of nontufted layer 6 pyramidal neurons that are very similar to layer 6 nontufted SC-projecting neurons. This similarity is consistent with the likely possibility that these MT-projecting neurons also have collaterals projecting to SC (Fries et al., 1985).
SC-projecting V1 neurons
Similar to previous HRP or fluorochrome tracing studies, our SC injections yielded three-quarters of labeled cells in layer 5 and one-quarter in layer 6 (Lund et al., 1975; Fries and Distel, 1983; Fries, 1984). We observed three main types of SC-projecting neurons: layer 5 tall-tufted, layer 5 nontufted, and layer 6 nontufted (Fig. 4). Neurons with similar morphologies to some of those described here have been described in Golgi studies of macaque monkey V1 (le Gros Clark, 1942; Lund and Boothe, 1975; Valverde, 1985). The layer 5 tall-tufted cells were suspected to project to the SC based on similar somal sizes and locations of the layer 5 cells found in HRP tracing studies (Lund et al., 1975). This possibility was further supported by the observation that tall-tufted layer 5 cells project to SC in several other species (Hallman et al., 1988; Kasper et al., 1994; Larsen et al., 2007), but nontufted cells projecting to SC are not found in those species. Our study provides direct evidence indicating that SC-projecting neurons in the macaque monkey include layer 5 tall-tufted and layer 5 nontufted, as well as layer 6 nontufted neurons.
One remarkable characteristic of pyramidal neurons in layers 5 and 6 of monkey V1 is their morphological diversity. Biocytin labeling studies of layer 6 neurons in living macaque brain slices revealed two classes, consisting of eight different types of pyramidal neurons (Wiser and Callaway, 1996; Briggs and Callaway, 2001). However, none of those layer 6 neurons matches the morphology of the layer 6 SC- and MT-projecting cells observed in this study. This is not surprising, given that ≈ 70% of excitatory pyramidal neurons in layers 5 and 6 have exclusively local axonal arbors, leaving only ≈ 30% of cells projecting to other cortical and subcortical structures (Lund and Boothe, 1975; Callaway and Wiser, 1996; Usrey and Fitzpatrick, 1996; Wiser and Callaway, 1996). The known extrinsic projection targets of layer 5 pyramids in V1 are primarily SC and pulvinar (Lund et al., 1975; Ungerleider et al., 1983) along with some corticortical projections (Sincich et al., 2007). About half of the projection neurons in layer 6 of macaque V1 target the LGN, which is about 15% of all layer 6 pyramids (Fitzpatrick et al., 1994; Wiser and Callaway, 1996), while the rest target the SC, area MT, and possibly the claustrum (LeVay and Sherk, 1981; Fries and Distel, 1983; Fitzpatrick et al., 1994; Wiser and Callaway, 1996; Callaway and Wiser, 1996). Therefore, the SC-projecting neurons described in this study constitute only a very small proportion of all layer 5 and 6 cells.
Even with such a small percentage, the greater morphological diversity of SC-projecting neurons in primate V1 suggests that they may perform more diverse functions than the SC-projecting neurons in other species. While other species such as mice, rats, hamsters, and cats only recruit the tall-tufted layer 5 neurons to modulate SC activities (Gilbert and Kelly, 1975; Kawamura and Konno, 1979; Klein et al., 1986; Hallman et al., 1988; Tsiola et al., 2003), we find that primates use both tall-tufted and nontufted cells (in both layers 5 and 6). The distinct basal dendritic morphology of the nontufted cells, reflected in every measurement (Figs. 3, 11, 12, 19), suggests that they are a unique cell type and their lack of apical dendritic tuft is not due to technical artifacts. They have not been detected in nonprimate species (Gilbert and Kelly, 1975; Katz, 1987; Kawamura and Konno, 1979; Klein et al., 1986; Ferrer et al., 1986a,b; Hallman et al., 1988; Zhang and Deschenes, 1998; Tsiola et al., 2003; Zarrinpar and Callaway, 2005). Their morphology has been described in one species of New World monkey, the marmoset (vogt Weisenhorn et al., 1995) but not in macaques (Lund et al., 1977; Wiser and Callaway, 1996; Briggs and Callaway, 2001). The very long lateral dendrites (extending more than 1.2 mm from the soma) of these cells suggest that although they are small in number they are likely to have large receptive fields and could still “tile” the visual space (Stevens, 1998), despite their scarcity. The presence of additional SC-projecting cell types in primates suggests the possibility that V1 and SC interact in some as yet unknown functional capacity that is not present in other species. Future studies identifying the in vivo functional properties of these neurons may shed light on this question, but as we describe further below, we speculate that these neurons provide a crucial source of information about visual motion direction.
MT-projecting V1 neurons
In agreement with previous studies, we observe that MT-projecting neurons in V1 reside in layers 4B and 6 (Shipp and Zeki, 1989; vogt Weisenhorn et al., 1995; Nassi and Callaway, 2007). We find that the MT-projecting layer 6 neurons are nontufted pyramids, have very long basal dendrites, and their basal dendritic arbors are significantly denser than the dendritic arbors of SC-projecting cells in layers 5 and 6 (P < 0.05, Wilcoxon rank sum test, Fig. 12A). This cell type is likely to be the same layer 6 MT-projecting cell type described physiologically by Movshon and Newsome (1996)—the 1% of their recorded V1 cells that were antidromically driven by MT stimulation. Those cells had large receptive fields, adding further support to the likelihood that cells with long lateral dendrites collect inputs over a large topographic extent. Previous studies also suggested the existence of a type of SC-projecting cell in layer 6 that also projects to area MT (Fries et al., 1985; vogt Weisenhorn et al., 1995). We attempted to verify this finding by injecting a fluorescent dextran in SC and the modified rabies virus in area MT. However, we were unable to find any double-labeled cells, likely due to mismatched topographic localization of our injections in the two structures and the low number of layer 6 MT-projecting neurons labeled. However, based on similar locations, morphological details, dendritic distributions, and lateral dendritic spreads between the two populations, it is reasonable to hypothesize that layer 6 MT-projecting neurons might be the same as, or belong to a subgroup of, SC-projecting layer 6 cells we described here.
Functional significance
We find that each type of SC-projecting V1 neuron has basal dendrites restricted to the home layer to potentially integrate inputs from other projecting or nonprojecting cells in the same layer. In addition, layer 5 cells can also receive inputs from neurons in the superficial layers that send branches down to specifically target layer 5 (Call-away and Wiser, 1996; Briggs and Callaway, 2005). However, the laminar and columnar differences between dendritic arbors of each cell type suggest that each is likely to receive additional inputs from different sources. The apical tuft in layer 1 provides layer 5 tall-tufted cells with the potential to receive input from some LGN K cells (Fitzpatrick et al., 1983; Hendry and Yoshioka, 1994), intrinsic inhibitory inputs from Martinotti cells targeting apical dendrites in layer 1 (Silberberg and Markram, 2007), and/or corticocortical feedback neurons that target this layer (Rockland and Pandya, 1979). Similarly, the blob-preferred nontufted cells have the potential to collect inputs from LGN K cells, from M-recipient layers 4B and 4Ca (Fitzpatrick et al., 1983; Callaway and Wiser, 1996; Yabuta and Callaway, 1998; Briggs and Callaway, 2005; Nassi and Callaway, 2007), as well as from blob-targeting layer 2/3 neurons (Callaway and Wiser, 1996; Yabuta and Callaway, 1998).
The relatively small proportion of layer 6 SC- or MT-projecting cells found in this and other studies suggests that each cell is likely to be sensitive to visual stimuli over a relatively large area of visual space. It should be noted, however, that compared to nonprimate species, the size of V1 relative to SC is quite large. Thus, despite the small proportion of SC-projecting neurons in primate, their number relative to the size of SC is likely to be comparable to, or perhaps even larger than, other species. Thus, the tall-tufted layer 5 neurons in macaque could serve a function similar to the tall-tufted cells projecting to SC in other species, while the nontufted cells, likely integrating inputs from distinctly different sources, may play a unique functional role. Furthermore, since a subset of the SC-projecting layer 6 neurons also project to MT (Fries et al., 1985), and these cells are direction-selective (Movshon and Newsome, 1996), it is likely that the SC-projection from layer 6 might carry direction information. Since these cells receive information directly from the LGN (Nassi et al., 2006), this could be a relatively direct route to the SC and could substitute for direction selective retinal ganglion cells, which have so far not been identified in primates, but are observed in many other species (Barlow and Hill, 1963; Kim et al., 2008; Huberman et al., 2009). If this is the case, then SC in primates may rely quite heavily on V1, and the nontufted cells in particular, as a source of direction selective input.
Meynert cells
Originally, Meynert designated the terms “outer” and “inner Meynert cells” to describe large and “solitary” neurons in layers 4B and 6 of primate V1 (Meynert, 1867). These same cells were later described in Golgi preparations, and in the earliest of these descriptions by Cajal (1899) and Le Gros Clark (1942) they described those in layer 6 as “being characterized by having a base which is very broad in proportion to its height, and in possessing stout basal dendrites which extend for considerable distances parallel to the surface” (Cajal, 1899; le Gros Clark, 1942). Over time, descriptions of “Meynert cells” have gradually evolved to include additional details based on inferences made from indirect observations linking cell body sizes to dendritic morphologies with Golgi reconstructions and/or linking cell body size to projection targets with retrograde labeling. Our results directly linking detailed dendritic morphology to projection targets indicate that some inferences were wrong, while others were correct. The most indirect inferences linked together detailed dendritic morphology and projections, with cell body size used as a common intermediate; these prove to lead to some errors because multiple cell types can have the same soma size (e.g., Figs. 8, 9). For example, our data show that not all large SC-projecting neurons in layer 5 are tall-tufted pyramids, as had been inferred. Conversely, not all neurons that match the original definition of Meynert cells have large cell bodies. Links between projections and cell body shape are more direct and prove to be more accurate; notably, both SC- and MT-projecting layer 6 cells have broad-based somata (Fries and Distel, 1983; Fries et al., 1985).
The data now available suggest a more nuanced definition of Meynert cells that closely resembles the original descriptions of Cajal and le Gros Clark (le Gros Clark, 1942; Winfield et al., 1983), but also allows for layer 5 Meynert cells. Based on such a description, our layer 5 and layer 6 nontufted cells, by virtue of their long lateral dendrites and large broad-based cell body, are Meynert cells. Thus, all MT-and SC-projecting layer 6 neurons are Meynert cells, but only a subset of layer 5 SC-projecting neurons are Meynert cells. Contrary to some previous definitions (Chan-Palay et al., 1974), this definition specifically excludes the layer 5, tall-tufted SC-projecting neurons, as they lack the broad-based cell body and long, lateral dendrites. Meynert cells with the same basal dendritic morphology, as our nontufted cells, might also sometimes have an apical dendrite that reaches layer 1 and forms a very small tuft (data not shown) (le Gros Clark, 1942; Valverde, 1985), but it is likely that Golgi preparations from prenatal animals overestimate the proportion of cells with apical dendrites in layer 1, since these are often subject to retraction later in development (Callaway, 1998b).
In comparing our results to previous descriptions of Meynert cells, it is important to note that the definition by le Gros Clark (1942), which we favor, is almost certainly different than the definition that has been used in some previously published studies (e.g., Fries, 1986; Payne and Peters, 1989). Such studies treat all large neurons in deep layers, and only large neurons, as Meynert cells. We find that all of the nontufted neurons projecting to either SC or MT are Meynert cells, even though many of them do not have large cell bodies and despite the fact that many of the tall-tufted layer 5 pyramids do have large cell bodies. It is therefore not surprising that the relationships between SC- or MT-projecting neurons and the overlying blobs (Fig. 10) differs from the relationship for large neurons with unknown projections (Fries, 1986; Payne and Peters, 1989). Large neurons in deep layers are clearly situated preferentially beneath interblobs, while the nontufted pyramids either have no bias or a modest trend toward blobs. Future studies should be cautious in their conclusions about cell types that are defined solely on cell body size.
Acknowledgments
Grant sponsor: National Institutes of Health; Grant number: EY010742 (to E.M.C.); Grant sponsor: National Science Foundation Graduate Fellowship (to H.L.N.); Grant sponsor: H.A. and Mary K. Chapman Charitable Trust (to H.L.N.).
We thank Mr. Mauricio De La Parra for assistance with animal care and surgical procedures; Drs. Jonathan Nassi and David Lyon for invaluable advice, teachings, discussions, and comments on the article; Dr. Casey Peto for assistance with photography; and Mr. Jeff Moore for technical assistance with analyses.
LITERATURE CITED
- Abramoff MD, Magelhaes PJ, Ram SJ. Image procesing with ImageJ. Biophotonics Int. 2004;11:36–42. [Google Scholar]
- Anderson JC, Martin KA, Whitteridge D. Form, function, and intracortical projections of neurons in the striate cortex of the monkey Macacus nemestrinus. Cereb Cortex. 1993;3:412–420. doi: 10.1093/cercor/3.5.412. [DOI] [PubMed] [Google Scholar]
- Barlow HB, Hill RM. Selective sensitivity to direction of movement in ganglion cells of the rabbit retina. Science. 1963;139:412–414. doi: 10.1126/science.139.3553.412. [DOI] [PubMed] [Google Scholar]
- Briggs F, Callaway EM. Layer-specific input to distinct cell types in layer 6 of monkey primary visual cortex. J Neurosci. 2001;21:3600–3608. doi: 10.1523/JNEUROSCI.21-10-03600.2001. [DOI] [PMC free article] [PubMed] [Google Scholar]
- Briggs F, Callaway EM. Laminar patterns of local excitatory input to layer 5 neurons in macaque primary visual cortex. Cereb Cortex. 2005;15:479–488. doi: 10.1093/cercor/bhh154. [DOI] [PMC free article] [PubMed] [Google Scholar]
- Cajal Ry. Estudios sobre la corteza cerebral humana. Corteza visual. Revta trimest microgr. 1899;4:1–63. [Google Scholar]
- Callaway EM. Local circuits in primary visual cortex of the macaque monkey. Annu Rev Neurosci. 1998a;21:47–74. doi: 10.1146/annurev.neuro.21.1.47. [DOI] [PubMed] [Google Scholar]
- Callaway EM. Prenatal development of layer-specific local circuits in primary visual cortex of the macaque monkey. J Neurosci. 1998b;18:1505–1527. doi: 10.1523/JNEUROSCI.18-04-01505.1998. [DOI] [PMC free article] [PubMed] [Google Scholar]
- Callaway EM. Cell type specificity of local cortical connections. J Neurocytol. 2002;31:231–237. doi: 10.1023/a:1024165824469. [DOI] [PubMed] [Google Scholar]
- Callaway EM, Wiser AK. Contributions of individual layer 2–5 spiny neurons to local circuits in macaque primary visual cortex. Vis Neurosci. 1996;13:907–922. doi: 10.1017/s0952523800009159. [DOI] [PubMed] [Google Scholar]
- Chan-Palay V, Palay SL, Billings-Gagliardi SM. Meynert cells in the primate visual cortex. J Neurocytol. 1974;3:631–658. doi: 10.1007/BF01097628. [DOI] [PubMed] [Google Scholar]
- Etessami R, Conzelmann KK, Fadai-Ghotbi B, Natelson B, Tsiang H, Ceccaldi PE. Spread and pathogenic characteristics of a G-deficient rabies virus recombinant: an in vitro and in vivo study. J Gen Virol. 2000;81:2147–2153. doi: 10.1099/0022-1317-81-9-2147. [DOI] [PubMed] [Google Scholar]
- Ferrer I, Fabregues I, Condom E. A Golgi study of the sixth layer of the cerebral cortex. I. The lissencephalic brain of Rodentia, Lagomorpha, Insectivora and Chiroptera. J Anat. 1986a;145:217–234. [PMC free article] [PubMed] [Google Scholar]
- Ferrer I, Fabregues I, Condom E. A Golgi study of the sixth layer of the cerebral cortex. II. The gyrencephalic brain of Carnivora, Artiodactyla and Primates. J Anat. 1986b;146:87–104. [PMC free article] [PubMed] [Google Scholar]
- Fitzpatrick D, Itoh K, Diamond IT. The laminar organization of the lateral geniculate body and the striate cortex in the squirrel monkey (Saimiri sciureus) J Neurosci. 1983;3:673–702. doi: 10.1523/JNEUROSCI.03-04-00673.1983. [DOI] [PMC free article] [PubMed] [Google Scholar]
- Fitzpatrick D, Usrey WM, Schofield BR, Einstein G. The sublaminar organization of corticogeniculate neurons in layer 6 of macaque striate cortex. Vis Neurosci. 1994;11:307–315. doi: 10.1017/s0952523800001656. [DOI] [PubMed] [Google Scholar]
- Fries W. Cortical projections to the superior colliculus in the macaque monkey: a retrograde study using horseradish peroxidase. J Comp Neurol. 1984;230:55–76. doi: 10.1002/cne.902300106. [DOI] [PubMed] [Google Scholar]
- Fries W. Distribution of Meynert cells in primate striate cortex. Spatial relationships with cytochrome oxidase blobs. Naturwissenschaften. 1986;73:557–558. doi: 10.1007/BF00368167. [DOI] [PubMed] [Google Scholar]
- Fries W, Distel H. Large layer VI neurons of monkey striate cortex (Meynert cells) project to the superior colliculus. Proc R Soc Lond B. 1983;219:53–59. doi: 10.1098/rspb.1983.0058. [DOI] [PubMed] [Google Scholar]
- Fries W, Keizer K, Kuypers HG. Large layer VI cells in macaque striate cortex (Meynert cells) project to both superior colliculus and prestriate visual area V5. Exp Brain Res. 1985;58:613–616. doi: 10.1007/BF00235878. [DOI] [PubMed] [Google Scholar]
- Gallyas F. A principle for silver staining of tissue elements by physical development. Acta Morphol Acad Sci Hung. 1971;19:57–71. [PubMed] [Google Scholar]
- Gallyas F. Silver staining of myelin by means of physical development. Neurol Res. 1979;1:203–209. doi: 10.1080/01616412.1979.11739553. [DOI] [PubMed] [Google Scholar]
- Gilbert CD, Kelly JP. The projections of cells in different layers of the cat’s visual cortex. J Comp Neurol. 1975;163:81–105. doi: 10.1002/cne.901630106. [DOI] [PubMed] [Google Scholar]
- Graham J. Some topographical connections of the striate cortex with subcortical structures in Macaca fascicularis. Exp Brain Res. 1982;47:1–14. doi: 10.1007/BF00235880. [DOI] [PubMed] [Google Scholar]
- Graham J, Lin CS, Kaas JH. Subcortical projections of six visual cortical areas in the owl monkey, Aotus trivirgatus. J Comp Neurol. 1979;187:557–580. doi: 10.1002/cne.901870307. [DOI] [PubMed] [Google Scholar]
- Hallman LE, Schofield BR, Lin CS. Dendritic morphology and axon collaterals of corticotectal, corticopontine, and callosal neurons in layer V of primary visual cortex of the hooded rat. J Comp Neurol. 1988;272:149–160. doi: 10.1002/cne.902720111. [DOI] [PubMed] [Google Scholar]
- Hendry SH, Yoshioka T. A neurochemically distinct third channel in the macaque dorsal lateral geniculate nucleus. Science. 1994;264:575–577. doi: 10.1126/science.8160015. [DOI] [PubMed] [Google Scholar]
- Huberman AD, Wei W, Elstrott J, Stafford BK, Feller MB, Barres BA. Genetic identification of an On-Off direction-selective retinal ganglion cell subtype reveals a layer-specific subcortical map of posterior motion. Neuron. 2009;62:327–334. doi: 10.1016/j.neuron.2009.04.014. [DOI] [PMC free article] [PubMed] [Google Scholar]
- Kaas JH, Huerta MF. Comparative primate biology: neurosciences. New York: Alan R. Liss; 1988. The subcortical visual system of primates; pp. 327–391. [Google Scholar]
- Kasper EM, Larkman AU, Luebke J, Blakemore C. Pyramidal neurons in layer 5 of the rat visual cortex. I. Correlation among cell morphology, intrinsic electrophysiological properties, and axon targets. J Comp Neurol. 1994;339:459–474. doi: 10.1002/cne.903390402. [DOI] [PubMed] [Google Scholar]
- Katz LC. Local circuitry of identified projection neurons in cat visual cortex brain slices. J Neurosci. 1987;7:1223–1249. doi: 10.1523/JNEUROSCI.07-04-01223.1987. [DOI] [PMC free article] [PubMed] [Google Scholar]
- Katz LC, Gilbert CD, Wiesel TN. Local circuits and ocular dominance columns in monkey striate cortex. J Neurosci. 1989;9:1389–1399. doi: 10.1523/JNEUROSCI.09-04-01389.1989. [DOI] [PMC free article] [PubMed] [Google Scholar]
- Kawamura K, Konno T. Various types of corticotectal neurons of cats as demonstrated by means of retrograde axonal transport of horseradish peroxidase. Exp Brain Res. 1979;35:161–175. doi: 10.1007/BF00236792. [DOI] [PubMed] [Google Scholar]
- Kelly RM, Strick PL. Rabies as a transneuronal tracer of circuits in the central nervous system. J Neurosci Methods. 2000;103:63–71. doi: 10.1016/s0165-0270(00)00296-x. [DOI] [PubMed] [Google Scholar]
- Kim IJ, Zhang Y, Yamagata M, Meister M, Sanes JR. Molecular identification of a retinal cell type that responds to upward motion. Nature. 2008;452:478–482. doi: 10.1038/nature06739. [DOI] [PubMed] [Google Scholar]
- Klein BG, Mooney RD, Fish SE, Rhoades RW. The structural and functional characteristics of striate cortical neurons that innervate the superior colliculus and lateral posterior nucleus in hamster. Neuroscience. 1986;17:57–78. doi: 10.1016/0306-4522(86)90225-3. [DOI] [PubMed] [Google Scholar]
- Krubitzer LA, Kaas JH. Cortical connections of MT in four species of primates: areal, modular, and retinotopic patterns. Vis Neurosci. 1990;5:165–204. doi: 10.1017/s0952523800000213. [DOI] [PubMed] [Google Scholar]
- Larsen DD, Wickersham IR, Callaway EM. Retrograde tracing with recombinant rabies virus reveals correlations between projection targets and dendritic architecture in layer 5 of mouse barrel cortex. Front Neural Circuits. 2007;1:1–7. doi: 10.3389/neuro.04.005.2007. [DOI] [PMC free article] [PubMed] [Google Scholar]
- le Gros Clark WE. The cells of Meynert in the visual cortex of the monkey. J Anat. 1942;76:369–376. [PMC free article] [PubMed] [Google Scholar]
- LeVay S, Sherk H. The visual claustrum of the cat. I. Structure and connections. J Neurosci. 1981;1:956–980. doi: 10.1523/JNEUROSCI.01-09-00956.1981. [DOI] [PMC free article] [PubMed] [Google Scholar]
- Livingstone MS. Mechanisms of direction selectivity in macaque V1. Neuron. 1998;20:509–526. doi: 10.1016/s0896-6273(00)80991-5. [DOI] [PubMed] [Google Scholar]
- Lock TM, Baizer JS, Bender DB. Distribution of corticotectal cells in macaque. Exp Brain Res. 2003;151:455–470. doi: 10.1007/s00221-003-1500-y. [DOI] [PubMed] [Google Scholar]
- Lund JS. Organization of neurons in the visual cortex, area 17, of monkey (Macacca mulatta) J Comp Neurol. 1973;147:455–496. doi: 10.1002/cne.901470404. [DOI] [PubMed] [Google Scholar]
- Lund JS. Local circuit neurons of macaque monkey striate cortex: I. Neurons of laminae 4C and 5A. J Comp Neurol. 1987;257:60–92. doi: 10.1002/cne.902570106. [DOI] [PubMed] [Google Scholar]
- Lund JS. Anatomical organization of macaque monkey striate visual cortex. Annu Rev Neurosci. 1988;11:253–288. doi: 10.1146/annurev.ne.11.030188.001345. [DOI] [PubMed] [Google Scholar]
- Lund JS, Boothe RG. Interlaminar connections and pyramidal neuron organisation in the visual cortex, area 17, of the macaque monkey. J Comp Neurol. 1975;159:305–334. [Google Scholar]
- Lund JS, Lund RD, Hendrickson AE, Bunt AH, Fuchs AF. The origin of efferent pathways from the primary visual cortex, area 17, of the macaque monkey as shown by retrograde transport of horseradish peroxidase. J Comp Neurol. 1975;164:287–303. doi: 10.1002/cne.901640303. [DOI] [PubMed] [Google Scholar]
- Lund JS, Boothe RG, Lund RD. Development of neurons in the visual cortex (area 17) of the monkey (Macaca nemestrina): a Golgi study from fetal day 127 to postnatal maturity. J Comp Neurol. 1977;176:149–188. doi: 10.1002/cne.901760203. [DOI] [PubMed] [Google Scholar]
- Lund JS, Hawken MJ, Parker AJ. Local circuit neurons of macaque monkey striate cortex: II. Neurons of laminae 5B and 6. J Comp Neurol. 1988;276:1–29. doi: 10.1002/cne.902760102. [DOI] [PubMed] [Google Scholar]
- Lyon DC, Nassi JJ, Callaway EM. A disynaptic relay from superior colliculus to dorsal stream visual cortex in macaque monkey. Neuron. 2010;65:270–279. doi: 10.1016/j.neuron.2010.01.003. [DOI] [PMC free article] [PubMed] [Google Scholar]
- Maunsell JH, van Essen DC. The connections of the middle temporal visual area (MT) and their relationship to a cortical hierarchy in the macaque monkey. J Neurosci. 1983;3:2563–2586. doi: 10.1523/JNEUROSCI.03-12-02563.1983. [DOI] [PMC free article] [PubMed] [Google Scholar]
- Meynert T. Der Bau der Grosshirnrinde und seine ortlichen Verschiedenheiten nebsteinem pathologisch-anatomischen Corollarium. Vjschr Psychiat. 1867;1:198–217. [Google Scholar]
- Movshon JA, Newsome WT. Visual response properties of striate cortical neurons projecting to area MT in macaque monkeys. J Neurosci. 1996;16:7733–7741. doi: 10.1523/JNEUROSCI.16-23-07733.1996. [DOI] [PMC free article] [PubMed] [Google Scholar]
- Nassi JJ, Callaway EM. Multiple circuits relaying primate parallel visual pathways to the middle temporal area. J Neurosci. 2006;26:12789–12798. doi: 10.1523/JNEUROSCI.4044-06.2006. [DOI] [PMC free article] [PubMed] [Google Scholar]
- Nassi JJ, Callaway EM. Specialized circuits from primary visual cortex to V2 and area MT. Neuron. 2007;55:799–808. doi: 10.1016/j.neuron.2007.07.037. [DOI] [PMC free article] [PubMed] [Google Scholar]
- Nassi JJ, Lyon DC, Callaway EM. The parvocellular LGN provides a robust disynaptic input to the visual motion area MT. Neuron. 2006;50:319–327. doi: 10.1016/j.neuron.2006.03.019. [DOI] [PMC free article] [PubMed] [Google Scholar]
- Payne BR, Peters A. Cytochrome oxidase patches and Meynert cells in monkey visual cortex. Neuroscience. 1989;28:353–363. doi: 10.1016/0306-4522(89)90182-6. [DOI] [PubMed] [Google Scholar]
- Rockland KS, Knutson T. Axon collaterals of Meynert cells diverge over large portions of area V1 in the macaque monkey. J Comp Neurol. 2001;441:134–147. doi: 10.1002/cne.1402. [DOI] [PubMed] [Google Scholar]
- Rockland KS, Pandya DN. Distinctive compartmental organization of human primary visual cortex. Brain Res. 1979;179:3–20. [Google Scholar]
- Sawatari A, Callaway EM. Diversity and cell type specificity of local excitatory connections to neurons in layer 3B of monkey primary visual cortex. Neuron. 2000;25:459–471. doi: 10.1016/s0896-6273(00)80908-3. [DOI] [PubMed] [Google Scholar]
- Schiller PH, Stryker M. Single-unit recording and stimulation in superior colliculus of the alert rhesus monkey. J Neurophysiol. 1972;35:915–924. doi: 10.1152/jn.1972.35.6.915. [DOI] [PubMed] [Google Scholar]
- Shipp S, Zeki S. The organization of connections between areas v5 and v1 in macaque monkey visual cortex. Eur J Neurosci. 1989;1:309–332. doi: 10.1111/j.1460-9568.1989.tb00798.x. [DOI] [PubMed] [Google Scholar]
- Sholl DA. Dendritic organization in the neurons of the visual and motor cortices of the cat. J Anat. 1953;87:387–406. [PMC free article] [PubMed] [Google Scholar]
- Silberberg G, Markram H. Disynaptic inhibition between neocortical pyramidal cells mediated by Martinotti cells. Neuron. 2007;53:735–746. doi: 10.1016/j.neuron.2007.02.012. [DOI] [PubMed] [Google Scholar]
- Sincich LC, Horton JC. Independent projection streams from macaque striate cortex to the second visual area and middle temporal area. J Neurosci. 2003;23:5684–5692. doi: 10.1523/JNEUROSCI.23-13-05684.2003. [DOI] [PMC free article] [PubMed] [Google Scholar]
- Sincich LC, Jocson CM, Horton JC. Neurons in V1 patch columns project to V2 thin stripes. Cereb Cortex. 2007;17:935–941. doi: 10.1093/cercor/bhl004. [DOI] [PubMed] [Google Scholar]
- Spatz WB, Tigges J, Tigges M. Subcortical projections, cortical associations, and some intrinsic interlaminar connections of the striate cortex in the squirrel monkey (Saimiri) J Comp Neurol. 1970;140:155–174. doi: 10.1002/cne.901400203. [DOI] [PubMed] [Google Scholar]
- Stevens CF. Neuronal diversity: too many cell types for comfort? Curr Biol. 1998;8:R708–710. doi: 10.1016/s0960-9822(98)70454-3. [DOI] [PubMed] [Google Scholar]
- Tigges J, Tigges M. Distribution of retinofugal and corticofugal axon terminals in the superior colliculus of squirrel monkey. Invest Ophthalmol Vis Sci. 1981;20:149–158. [PubMed] [Google Scholar]
- Tsiola A, Hamzei-Sichani F, Peterlin Z, Yuste R. Quantitative morphologic classification of layer 5 neurons from mouse primary visual cortex. J Comp Neurol. 2003;461:415–428. doi: 10.1002/cne.10628. [DOI] [PubMed] [Google Scholar]
- Ugolini G. Specificity of rabies virus as a transneuronal tracer of motor networks: transfer from hypoglossal motoneurons to connected second-order and higher order central nervous system cell groups. J Comp Neurol. 1995;356:457–480. doi: 10.1002/cne.903560312. [DOI] [PubMed] [Google Scholar]
- Ungerleider LG, Galkin TW, Mishkin M. Visuotopic organization of projections from striate cortex to inferior and lateral pulvinar in rhesus monkey. J Comp Neurol. 1983;217:137–157. doi: 10.1002/cne.902170203. [DOI] [PubMed] [Google Scholar]
- Usrey WM, Fitzpatrick D. Specificity in the axonal connections of layer VI neurons in tree shrew striate cortex: evidence for distinct granular and supragranular systems. J Neurosci. 1996;16:1203–1218. doi: 10.1523/JNEUROSCI.16-03-01203.1996. [DOI] [PMC free article] [PubMed] [Google Scholar]
- Valverde F. The organizing principles of the primary visual cortex in the monkey. In: Peters A, Jones EG, editors. The cerebral cortex. New York: Springer; 1985. pp. 207–257. [Google Scholar]
- vogt Weisenhorn DM, Illing RB, Spatz WB. Morphology and connections of neurons in area 17 projecting to the extrastriate areas MT and 19DM and to the superior colliculus in the monkey Callithrix jacchus. J Comp Neurol. 1995;362:233–255. doi: 10.1002/cne.903620207. [DOI] [PubMed] [Google Scholar]
- Wickersham IR, Finke S, Conzelmann KK, Callaway EM. Retrograde neuronal tracing with a deletion-mutant rabies virus. Nat Methods. 2007;4:47–49. doi: 10.1038/NMETH999. [DOI] [PMC free article] [PubMed] [Google Scholar]
- Winfield DA, Rivera-Dominguez M, Powell TP. The number and distribution of Meynert cells in area 17 of the macaque monkey. Proc R Soc Lond B Biol Sci. 1981;213:27–40. doi: 10.1098/rspb.1981.0051. [DOI] [PubMed] [Google Scholar]
- Winfield DA, Neal JW, Powell TP. The basal dendrites of Meynert cells in the striate cortex of the monkey. Proc R Soc Lond B Biol Sci. 1983;217:129–139. doi: 10.1098/rspb.1983.0002. [DOI] [PubMed] [Google Scholar]
- Wiser AK, Callaway EM. Contributions of individual layer 6 pyramidal neurons to local circuitry in macaque primary visual cortex. J Neurosci. 1996;16:2724–2739. doi: 10.1523/JNEUROSCI.16-08-02724.1996. [DOI] [PMC free article] [PubMed] [Google Scholar]
- Wong-Riley M. Changes in the visual system of monocularly sutured or enucleated cats demonstrable with cytochrome oxidase histochemistry. Brain Res. 1979;171:11–28. doi: 10.1016/0006-8993(79)90728-5. [DOI] [PubMed] [Google Scholar]
- Wurtz RH, Albano JE. Visual-motor function of the primate superior colliculus. Annu Rev Neurosci. 1980;3:189–226. doi: 10.1146/annurev.ne.03.030180.001201. [DOI] [PubMed] [Google Scholar]
- Yabuta NH, Callaway EM. Functional streams and local connections of layer 4C neurons in primary visual cortex of the macaque monkey. J Neurosci. 1998;18:9489–9499. doi: 10.1523/JNEUROSCI.18-22-09489.1998. [DOI] [PMC free article] [PubMed] [Google Scholar]
- Yabuta NH, Sawatari A, Callaway EM. Two functional channels from primary visual cortex to dorsal visual cortical areas. Science. 2001;292:297–300. doi: 10.1126/science.1057916. [DOI] [PubMed] [Google Scholar]
- Yukie M, Iwai E. Laminar origin of direct projection from cortex area V1 to V4 in the rhesus monkey. Brain Res. 1985;346:383–386. doi: 10.1016/0006-8993(85)90875-3. [DOI] [PubMed] [Google Scholar]
- Zarrinpar A, Callaway EM. Local connections to specific types of layer 6 neurons in the rat visual cortex. J Neurophysiol. 2005;95:1751–1761. doi: 10.1152/jn.00974.2005. [DOI] [PubMed] [Google Scholar]
- Zhang ZW, Deschenes M. Projections to layer VI of the posteromedial barrel field in the rat: a reappraisal of the role of corticothalamic pathways. Cereb Cortex. 1998;8:428–436. doi: 10.1093/cercor/8.5.428. [DOI] [PubMed] [Google Scholar]


