Abstract
The renaturation/denaturation of DNA oligonucleotides is characterized in the context of expanded ensemble (EXE) and Transition Path Sampling (TPS) simulations. Free energy profiles have been determined from EXE for DNA sequences of varying composition, chain length, and ionic strength. TPS simulations within a Langevin Dynamics formalism have been carried out to obtain further information of the transition state for renaturation. Simulation results reveal that free energy profiles are strikingly similar for the various DNA sequences considered in this work. Taking intact dsDNA to have an extent of reaction ξ = 1.0, the maximum of the free energy profile appears at ξ ≈ 0.15, corresponding to ~2 base pairs. In terms of chain length, the free energy barrier of longer oligonucleotides (30 versus 15 base pairs) is higher and slightly narrower, due to increased sharpness associated with the transition. Low ionic strength tends to decrease free energy barriers, whereby increasing strand rigidity facilitates reassociation. Two mechanisms for DNA reassociation emerge from our analysis of the transition state ensemble. Homogeneous sequences tend to reassociate through a diffusive pathway involving molecular slithering. In contrast, random sequences associate through a more restrictive pathway involving the formation of specific contacts, which then leads to overall molecular zippering. Molecular reassociation in homogeneous sequences appears to be more strongly driven by the relative stability of helix-helix arrangements. In both random and homogeneous sequences, the distribution of contacts suggests that nucleation is favored for sites located within the middle region of the chain. The prevalent extent of reaction for the transition state is ξ ≈ 0.25, and the critical size of the nucleus as obtained from our analysis involves ~4 base pairs.
1. Introduction
The primary step in the self-assembly of deoxyribonucleic acid (DNA) structures is the association and stabilization of complementary strands. When two complementary nucleic bases (i.e., adenine to thymine and cytosine to guanine) encounter one another with proper orientation, hydrogen bonding leads to base pair association. The double-helix arrangement of DNA arises from base-pairing and base-stacking interactions occurring in tandem along the length of the two complementary strands. The system can be driven away from the associated state by applying heat or by altering solvent conditions, thereby destabilizing the network of nucleic base interactions. In the case of dissociation induced by thermal effects, the system can be brought back to an associated state (renatured or rehybridized) by annealing.
A thermodynamic description of DNA association is of considerable interest. Theory has provided useful frameworks to interpret macroscopic observations of the denaturation cycle in DNA. In constructing analytically tractable formalisms, theoretical models have resorted to presumed mechanisms (particularly the two-state formalism) [1], leaving to question the validity of several underlying assumptions. As some of these formalisms are based on statistical mechanical models of DNA (such as the quasi one-dimensional Ising model) [2, 3], their ability to provide a molecular understanding of renaturation events is not generally within the scope of such treatments. While reasonable agreement with experimental data can be attained with such models, molecular simulations of more detailed models can offer valuable insights pertaining to details that are not included in available analytical treatments.
The renaturation of DNA involves a complex interplay between long- and short-range interactions. A competition between electrostatic repulsion (from negatively charged phosphate sites along the backbone of single-stranded DNA) and medium-induced interactions (such as reorganization of ionic species and solvent molecules) is involved in molecular reassociation. Experimental data on DNA reassociation has been interpreted mostly as a second-order reaction, in which a nucleation step is followed by zippering of the helix [4, 5, 6, 7], but the rate-limiting step in this process has been contested [8]. Other aspects of the reassociation, such as the optimal temperature for annealing [9, 10], effect of ionic strength [11], solvent viscosity [12, 13], and pH [14] have also been investigated.
Several theories have been proposed to interpret DNA kinetic experiments [15, 16, 17, 18, 19]. Some of these treatments, however, bring to question the assumptions used to characterize the bimolecular reaction. A full understanding of the initiation and size of nucleation in DNA reassociation in several systems is still lacking. For instance, experiments have elucidated essential features of nucleation in the renaturation of large DNA molecules [20, 21]; analogous studies for short oligonucleotides have not been presented. Such information would be relevant for amplification of DNA sequences [22], design of microarray platforms [23], and single-molecule experiments requiring strand control [24]. Molecular simulations could not only help elucidate the overall reassociation reaction, but could also address a number of issues that are fundamental to molecular self-assembly, including those pertaining to oligonucleotides and their nucleation events.
The study of renaturation with atomistic simulations is hindered by two related issues: (a) the disparity in local (atomic) timescales and global (molecular) dynamics, both of which play a role in the process of association, and by (b) the number of degrees of freedom needed to account for electrostatics and solvent effects at such level of detail. Coarse grain models could be used to overcome such issues. Their implementation, however, has been limited because in many cases available constructs cannot describe interactions at the level of individual nucleotides. A description at the level of base pairs, nevertheless, is of interest since important intermediate configurations can be identified in the context of nucleation events needed to describe the mechanism behind molecular association. As a viable alternative to conventional simulation approaches, we developed early on an implicit-solvent, coarse grain model of DNA parameterized with respect to experimental data for mechanical properties and denaturation of short oligonucleotides [25]. The model reduces the number of degrees of freedom in the system, and is able to capture realistically a number of essential physicochemical features of DNA. Most importantly, it resolves interactions at the level of individual nucleotides.
Using an improved version of this model of DNA, in this work we use molecular simulations to study nucleotide sequence effects pertinent to denaturation and renaturation. In particular, we have focused on the characterization of free energy profiles and relevant configurational features leading to the single-to-double stranded transition. We begin with a brief overview of the DNA model employed here. Next, we describe our implementation of expanded ensembles to study sequence effects in the dis-and reassociation of short oligonucleotides. That study is complemented with Transition Path Sampling simulations aimed at a detailed characterization of the transition state for renaturation.
2. A Coarse Grain Model for DNA
The original DNA construct considered in this work was developed by Knotts et al. [25]. An improved version of the model was presented by Sambriski et al. [26]. Such a construct maps each of the three chemical moieties (sugar, phosphate, and nucleic base) of a nucleotide onto three interaction sites. Each of these sites interacts with other sites through a type-specific potential energy function. Standard coordinates obtained from crystallographic data for the B-form, double-stranded DNA (dsDNA) have been used to define a reference molecular structure that governs positional and orientational constraints in the force field. Such an arrangement allows one to capture the biologically relevant feature of major and minor grooves in dsDNA. By adopting an implicit solvent approach, the model permits study of long DNA chains over long time scales.
The force field for the coarse grain representation of DNA includes intra- and interstrand interactions. The stability of the backbone is partly sustained by intrastrand interactions that control bonds, bends, and torsions. Base stacking interactions, which are also of an intrastrand nature, are modeled through a Gō-like approach [27]. In this latter contribution, sites interact through a Lennard-Jones potential that depends on pair-specific separations dictated by the reference structure of DNA. All intrastrand sites found within a pre-defined interaction radius (9 Å) are classified as Gō-like contacts. The effect of hydrogen bonding is incorporated through a short-ranged, Lennard-Jones interaction that acts between complementary nucleic base sites. Base pair mismatches, as well as all other excluded volume contributions, are treated through a Weeks-Chandler-Anderson potential. Electrostatic contributions are taken into account through phosphate sites, which interact at the level of Debye-Hückel theory. Explicit mathematical expressions for the model, as well as a listing of the corresponding parameters, are provided in the Appendix and in the literature [25, 26].
Several limitations in our original formulation of the coarse grain model for DNA [25] have been addressed in the revised model [26]. The original parameter set captured the nominal stiffness of dsDNA (which has an empirical value of 50 nm) to within approximately 50%. The new parameter set for intramolecular interactions (reported in the Appendix) remedies this shortcoming by reproducing the nominal value to within an error of approximately 20%. Both former and current forms of the force field capture the dependence of molecular persistence length with ionic strength. The other limitation concerns the denaturation of DNA. Given proper system conditions, complementary strands of single-stranded DNA (ssDNA) can renature to yield dsDNA. While the former representation can describe DNA melting in the context of bubble formation dynamics, there is no mechanism in the force field to capture renaturation within an implicit solvent construct. The only interstrand attractive contribution in the former force field is hydrogen bonding, which is sharp and short-ranged.
To address the issue of renaturation, the force field now includes a weak, intermediate range interaction of 𝒪(10−1) kBT meant to embody solvent-mediated effects. This contribution takes the form of an interstrand interaction that acts between all sugar site pairs. This follows closely the phenomenology investigated in the context of hydration forces in nucleic acids as shown in experiments by Rau and Persegian [28, 29], the ion-mediated interactions measured by X-ray scattering methods of Qiu and coworkers [30], as well as many-body correlation effects of ionic species discussed in theoretical work by Hu and Liu [31, 32]. The solvent-mediated interaction has been tempered against the attractive contribution of hydrogen bonds to bring about a sufficiently weak effect that can allow for both renaturation and denaturation. We have performed the parameterization of the improved coarse grain representation for DNA using a set of short strands with n ∈ {10, 15, 30}, where n denotes the number of base pairs of the oligonucleotide. Such a study was performed using a series of oligonucleotides with increasing cytosine-guanine content (fCG) and ionic strength, the results of which are given in a different publication [26].
A Langevin Dynamics (LD) formalism is used to generate DNA trajectories. The friction coefficient used for these calculations is derived from diffusivity data for short DNA oligonucleotides. The LD integrator provides for a three-fold speedup over the original Nosé-Hoover implementation. Details on these aspects of the model can be found elsewhere [26].
3. Free Energy via Expanded Ensembles
The method of expanded ensembles (EXE) facilitates the study of thermodynamic properties of a system as a function of a suitably defined order parameter [33, 34, 35, 36]. Provided the order parameter can distinguish between relevant phases of the system, expanded ensembles are particularly effective for studies of phase transitions. In this work, the number of bound base pairs is selected as the order parameter to characterize the denaturation transition in DNA. At constant N, V, and T, an expanded ensemble is defined through the relation
| (3.1) |
where Q(N, V, T, ξi) denotes the canonical ensemble partition function corresponding to a particular state ξi of the total (n + 1) states of the system. As described below, one can design an algorithm that samples successive states ξi of the system sequentially. In that case, ξi can be used to define the “extent of reaction” of a particular process. For each ξi, there exists an exponentiated positive weighting factor ϒi such that each Q(N, V, T, ξi) contributes equally to Ω [37]. The probability of finding the system in state ξi is given by
| (3.2) |
From Eq.(3.2), it follows that
| (3.3) |
with p̃(ξi) ≡ p(ξi)e−ϒi. The optimal weighting factors ϒi are such that all ξi states are sampled with equal probability; these optimal weights acquire an important physical significance, namely, their differences are associated with changes in the Helmholtz free energy A of the system. Expanded ensemble formalisms therefore allow for a systematic calculation of the free energy as a function of the extent of reaction A(ξ). Using Eq. (3.2), the corresponding difference in free energy can be conveniently defined as a ratio of partition functions with respect to some reference state ξn as
| (3.4) |
Values for p(ξ i) can be obtained by evolving the expanded ensemble with any method of choice, provided it is adept at permitting the system to traverse configurational space efficiently. At the end of a simulation cycle, each p(ξi) is extracted from a histogram of visits to each state ξi.
Trial perturbations or moves are performed on the molecule to sample each of the (n + 1) states. When a trial move is proposed, it is accepted or rejected with probability
| (3.5) |
where T(ξi → ξj) is the probability of proposing a transition from state ξi to ξj, and p (ξi) is the probability of observing the system in state ξi. Transition probabilities in Eq. (3.5) must account for any asymmetry in the system. In traversing a one-dimensional order parameter space, end states are asymmetrically disposed to transition between neighboring states when compared to intermediate ones, and the ratio of transition probabilities is in general not unity [35]. Whenever a proposed move violates an imposed boundary (relative or absolute) for a chosen interval of states, the move is rejected by updating the histogram of visited states of the originating state [35, 36, 38].
With the aid of Eq. (3.3), the canonical ensemble p(ξi) can be evaluated, so that for any two configurations ξi and ξj of the system,
| (3.6) |
where β = (kBT)−1. Using Eq. (3.6), Eq. (3.5) simplifies to
| (3.7) |
In effect, Eq. (3.7) not only accounts for the change in energy as the system evolves from ξi to ξj, but also for any change in the order parameter of the expanded ensemble, thereby facilitating uniform sampling of all states. In this sense, the evolution of the system corresponds to a one-dimensional Markovian trajectory of the ξi states.
In the context of DNA denaturation, our EXE simulation is envisioned as a series of (n + 1) states pooled from ξi ∈ {ξ0 … ξn}, with n representing the maximum number of native interstrand base pairs that can form for a given sample of dsDNA. The intact state of dsDNA, ξn, is taken to be the reference state, while ξ0 represents the fully molten state involving ssDNA. All ξi such that ξ0 < ξi < ξn correspond to states with an intermediate extent of reaction. Our EXE calculation aims to bridge smoothly between the ξ0 and ξn states. To investigate the renaturation/denaturation cycle, we define our EXE thermodynamic path as that in which base pairs form (or break) sequentially from one end of the molecule to the other (i.e., only native contacts are allowed). This arrangement builds the zippering mechanism commonly alluded to in the literature into our simulation algorithm [25]. To prepare a system for an EXE simulation, we allow for an equal number of configurations to be partially denatured from the 3′- and the 5′-end.
To expedite convergence, we partition the range of (n + 1) states into a set of sub-representations (or “windows”) consisting of several consecutive values of ξ. Each window encompasses a small range of ξ, or a small number of states. Each window is populated with a configuration of two complementary DNA strands acquired from an equilibrated canonical MD simulation. All windows are evolved simultaneously. Each window is allowed to overlap with several states from adjacent windows; attempts to swap configurations from adjacent windows are performed at a preset frequency. An exchange occurs if states from two windows overlap when a swap move is proposed. The system is evolved using a hybrid Monte Carlo-Molecular Dynamics (MCMD) method [39]. This approach samples configurational space with randomly alternating intervals of Monte Carlo and Molecular Dynamics simulations. The Monte Carlo scheme employed here includes translation, rotation, and pivot trial moves [40]. The MCMD method facilitates sampling of configurational space in both a local and global manner.
The weighting factors ϒi are acquired in two stages from a series of simulation runs that progressively increase in length. During the first stage of sampling (“priming”), a short simulation run is performed with all weighting factors set to a common value. The number of steps in this simulation is sufficiently large to allow the system to sample several states in each window [for our case, 𝒪(105) steps]. When complete, a probability is computed from the histogram of visits to each state. These probabilities serve to determine the ϒi through the relation
| (3.8) |
Initially, all weighting factors are set to zero in Eq (3.8). States with no hits [p(ξi) = 0] are assigned an interpolated weight involving neighboring states. In the second stage of sampling (“refinement”), the serve as input to longer runs [for our studies, these refinement runs are of 𝒪(106) steps]. This process is repeated until probabilities satisfy a desired statistical accuracy (for our case, when all p(ξi) deviate less than 15% from their nominal value). The difference in excess free energy is determined from Eq. (3.4). Before Eq. (3.4) can be used, information from all the windows that sample the entire range of ξ space must be combined. The optimal additive constant of each window for ϒi can be determined through the Weighted Histogram Analysis Method (WHAM) [41, 42],
| (3.9) |
| (3.10) |
where Nw is the number of windows used in the EXE simulation and ϱ(ξi) is a discretized probability distribution. For the αth simulation, hα(ξi) denotes the number of counts accrued by state ξi, Hα is the total number of data points collected, and Fα is an optimized additive constant. The Fα are found by iterating Eqs. (3.9) and (3.10) until self-consistency is achieved. The convergence of an EXE calculation can be assessed by the extent to which weights from overlapping regions agree once the Fα are applied.
Information from one thermodynamic state point can be extrapolated to a nearby state point by extending Eq. (3.2). This is particularly useful when seeking the precise conditions under which a phase transition occurs. More specifically, if information is available at a reference state point β0, and additional information at point β is required, the extrapolation takes the form [43, 44]:
| (3.11) |
where p̃(ξi) is defined by Eq. (3.3), while Nb is the number of bins used to discretize the potential energy U(ξi). In the case of two-state systems, the change in free energy is expected to vanish at a phase transition since the probability for either state is identical,
| (3.12) |
By combining the extrapolation of Eq. (3.11) with the condition of Eq. (3.12), one can locate phase transitions with considerable precision.
4. Transition Path Sampling and the Transition State Ensemble
In the study of phase transitions, much information can be gleaned about a process based on the characterization of intermediate states or extents of reaction. The principal step in the reassociation of ssDNA involves a nucleation event. While information on the nucleation during the renaturation of large DNA systems has been provided experimentally [20, 21], the manner in which it occurs and the critical size of the nucleus for smaller oligonucleotides has not been considered. Such information would lead to a better understanding of the process of DNA association, and would enable the design of protocols aimed at presenting molecules in specific, optimal arrangements for renaturation or rehybridization.
Such questions can be addressed through methods aimed at harvesting information about a reaction on the basis of transitions, which is the viewpoint adopted in Transition Path Sampling (TPS). TPS requires that a “primitive path” be identified. That path is a trajectory (in the case of MD simulations, coordinates and momenta) in which the system goes from one state to another. From this trajectory, one adds perturbations at distinct time slices to generate a collection of reactive trajectories (i.e., those which successfully traverse a path going from one established state to another). Such trajectories constitute the Transition Path Ensemble (TPE), which can then be analyzed to obtain thermodynamic properties of the system involving transitions between states of interest.
As this work focuses on the problem of the single-to-double stranded transition in DNA, it is convenient to establish a convention to denote the intact or fully denatured states. As with our EXE calculations, our order parameter is given by the extent of reaction ξ. To characterize the system in terms of a chemical reaction, we define the reference system as being intact dsDNA (ξ = 1.0). The forward reaction refers to DNA renaturing, and a range of states is defined to be in region B when ξ → 1.0. The reverse reaction involves the breaking of hydrogen bonds between complementary base pairs to yield ssDNA, and a range of states is defined to be in region A when ξ → 0.0.
To sample the space of transition paths and collect the TPE, we use shooting moves in which one selects a time slice at random from the “primitive path” trajectory (in our case, for a trajectory of S steps, our initial time slice t0 with configuration X0 is selected from the trajectory fragment 0.3S ≤ t0 ≤ 0.7S). To this time slice, a perturbation is added, which for our case amounts to assigning new momenta. A “forward trajectory” (X0 → B) is then grown from t0 ≤ t ≤ S. If the system fails to situate itself in region B during the time interval (S – t0), the proposed time slice is rejected. On the other hand, if the system arrives at region B, a backward leg is constructed by inverting the momenta at t0 and a “backward trajectory” (X0 → A) is generated from 0 ≤ t < t0 in an attempt to reach region A. If this backward trajectory successfully reaches region A, the entire trajectory is accepted, otherwise the time slice is rejected and another time slice is chosen at random.
Once the TPE has been collected, we proceed to generate the Transition State Ensemble (TSE). This ensemble is comprised by the set of configurations belonging to a surface in configurational space where trajectories are equally likely to end in either region A or B [45]. In keeping with our original definition of a chemical reaction, our collection of trajectories is selected by determining the extent of reaction ξ (i.e., fraction of base pair contacts) that a given configuration acquires. To identify these configurations from the TPE, one selects points along a given trajectory and performs short, fleeting trajectories. These trajectories are then used to determine committor probabilities [45], defined by the expression,
| (4.1) |
Here, Nf denotes the total number of fleeting trajectories, while represents a counting function for region B of the ith trajectory. If a fleeting trajectory successfully connects a state in region A (molten DNA) with one in region B (fully renatured DNA), then , otherwise . To categorize whether a reaction has gone to completion, we have defined a threshold of ξ = 0.8 for the extent of reaction. All configurations that start from some intermediate state of bound DNA and are consistently characterized by ξ = 0.8 for at least one-quarter of a fleeting trajectory have . For our studies, a fleeting trajectory spans a time scale of 2 ns out of the 20 ns trajectories from the TPE.
By using Eq. (4.1), the TSE is defined by the set of configurations for which πB = 0.5. We define a tolerance with respect to πB through the relation [46]
| (4.2) |
where Nf represents the minimum number of fleeting trajectories needed for statistical significance. For our work, we have used Nf = 100 and with the condition that πB = 0.5, the minimum tolerance yields σ = 0.05. A configuration is designated as being part of the TSE if [πB − νσ, πB + νσ], where ν is chosen to satisfy a desired confidence interval. We have used a confidence interval of 95% (ν = 2), such that a configuration is part of the TSE whenever 0.4 < πB < 0.6.
5. Results
5.1. Systems of Study
The oligonucleotides considered in this study include chain lengths of n ∈ {14, 15, 30} base pairs, with several chain compositions fCG, as summarized in table 1. The conditions investigated here are given in table 2. The EXE melting temperature simulations have been performed for two chain lengths n ∈ {15, 30} at all compositions, while for TPS, only the n ∈ {14, 15} cases have been investigated, each with an associated fCG. Taken together, these systems enable us to address a number of effects relevant to chain length, ionic strength, and nucleotide sequence. All MD simulations were performed with a Langevin Dynamics integrator in the canonical ensemble.
Table 1.
Sequences of Short Oligonucleotide Series.
| Nbp | fCG | Sequence (5′ to 3′) | |||||||||
|---|---|---|---|---|---|---|---|---|---|---|---|
| 14 | 0.0 | ATA | TAT | ATA | TAT | AT | |||||
| 15 | 0.0 | ATA | TAT | ATA | TAT | ATA | |||||
| 15 | 0.2 | TAC | TAA | CAT | TAA | CTA | |||||
| 15 | 0.4 | AGT | AGT | AAT | CAC | ACC | |||||
| 30 | 0.0 | ATA | TAT | ATA | TAT | ATA | TAT | ATA | TAT | ATA | TAT |
| 30 | 0.2 | TTA | TGT | ATT | AAG | TTA | TAT | AGT | AGT | AGT | AGT |
Table 2.
Tm for Short Oligonucleotide Series.
5.2. Expanded Ensemble
The melting of DNA is perceived to be a first-order phase transition [49, 50, 51]. The melting temperature, Tm, is often identified as the point at which ξ = 0.5, as determined with a melting curve obtained from UV absorbance measurements [1]. A thermodynamic definition, however, would assign Tm to the state point in which the difference in free energy between the initial (ξ = 0.0) and final (ξ = 1.0) state vanishes. From this perspective, it is of interest to compare these definitions for Tm. Our studies are also prompted by experimental melting profiles of short oligonucleotides [52, 47, 53], where the melting transition is relatively broad, and an ambiguity arises in the definition of Tm.
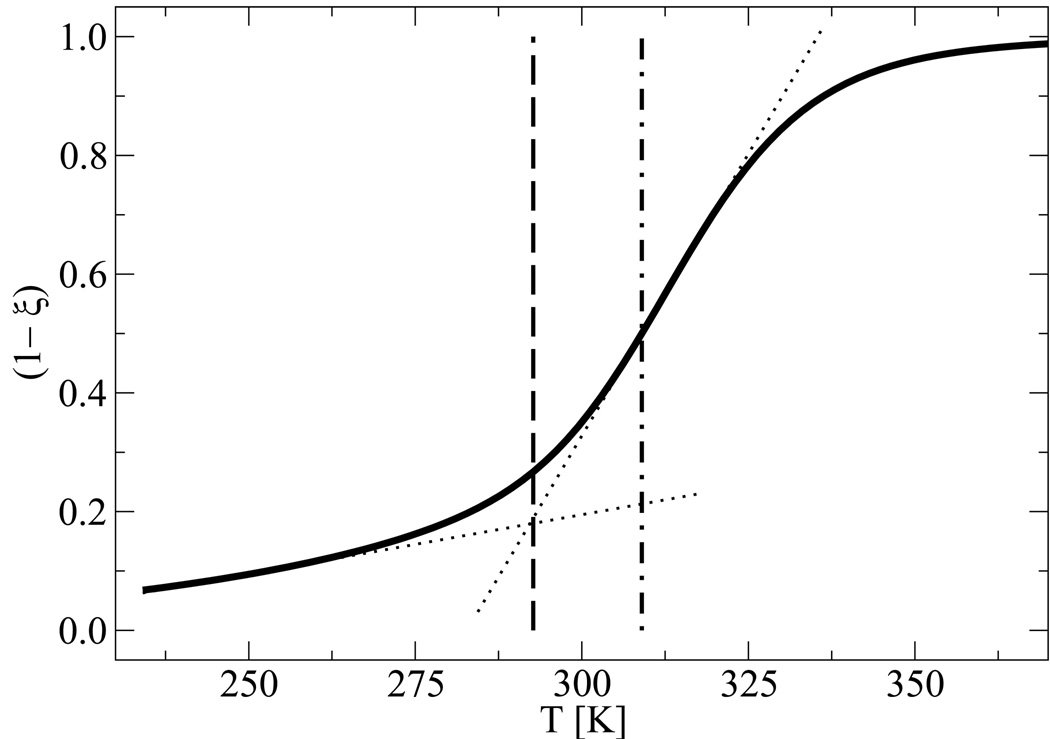
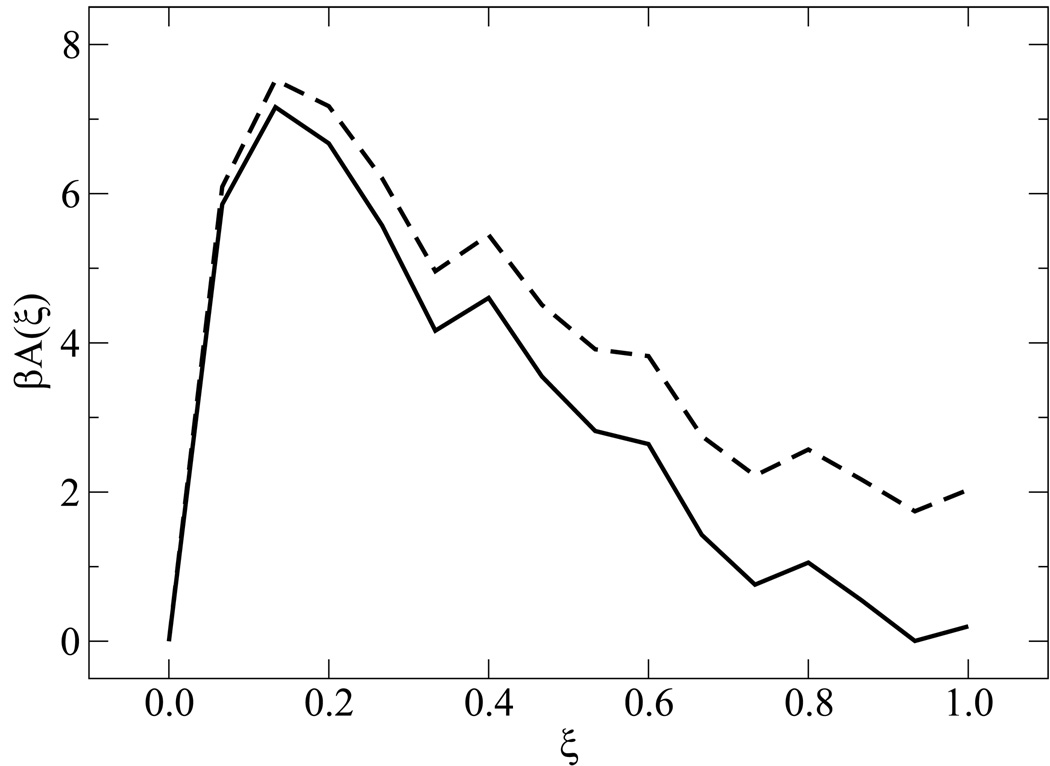
In order to establish a correspondence between different techniques for studying melting, we compared the melting transition temperature as determined from previous studies using a Replica Exchange Molecular Dynamics (REMD) algorithm [26] with that obtained from EXE simulations. While we only present results for n = 15 (fCG = 0.2), similar findings hold for other systems. Using ξ = 0.5 to define Tm, the melting temperature can be determined by inspection of the denaturation curve obtained from REMD. Such a temperature can be used as an input for EXE calculations. The EXE simulations are then carried out until two “minima” display equal heights, at which point the system is characterized by ΔA = 0. Figure 1 shows a comparison between the melting temperature obtained from EXE and REMD simulations. A discrepancy of about 10 K is evident: the EXE calculation exhibits a melting temperature of 296 K, while the temperature from REMD at the half-point is 309 K. The former was found by using Eq. (3.11) and solving by iteration for the state point at which the minima of the free energy profile are of equal weight, the results of which are shown in figure 2. This state point was confirmed with an EXE simulation performed at the same conditions (not shown). The origin of this difference can be attributed to the broadness of the transition associated for a relatively small system. Indeed, the ambiguity of defining the melting temperature vanishes for larger systems, where the transition as given by REMD displays a sharper response [26]. EXE simulations indicate that for short oligonucleotides, a thermodynamically consistent way of defining Tm from melting curves is to identify it with the onset of melting, as indicated by the intersection of the slopes (dotted lines) shown in Figure 1.
Figure 1.
Comparison of denaturation temperatures from a melting curve (solid line) where the fraction of melting base pairs (1 − ξ) is plotted as a function of temperature T. Shown are data for n = 15 (fCG = 0.2), which has an empirical melting temperature of Tm = 308.4 K. The corresponding results from EXE (dashed line) yields Tm = 296 K while REMD (dot-dashed line) yields at the half-point Tm = 309 K. The alternate definition for Tm is given by the slopes depicted (dotted lines), whose intersection defines the melting temperature at the onset of denaturation.
Figure 2.
Determination of the thermodynamic melting temperature. Shown is the free energy profile as a function of ξ, for the system in figure 1, using the half-point melting temperature from REMD (dashed curve) and that determined by setting ΔA = 0 (solid curve), consistent with the alternate definition for Tm depicted in figure 1.
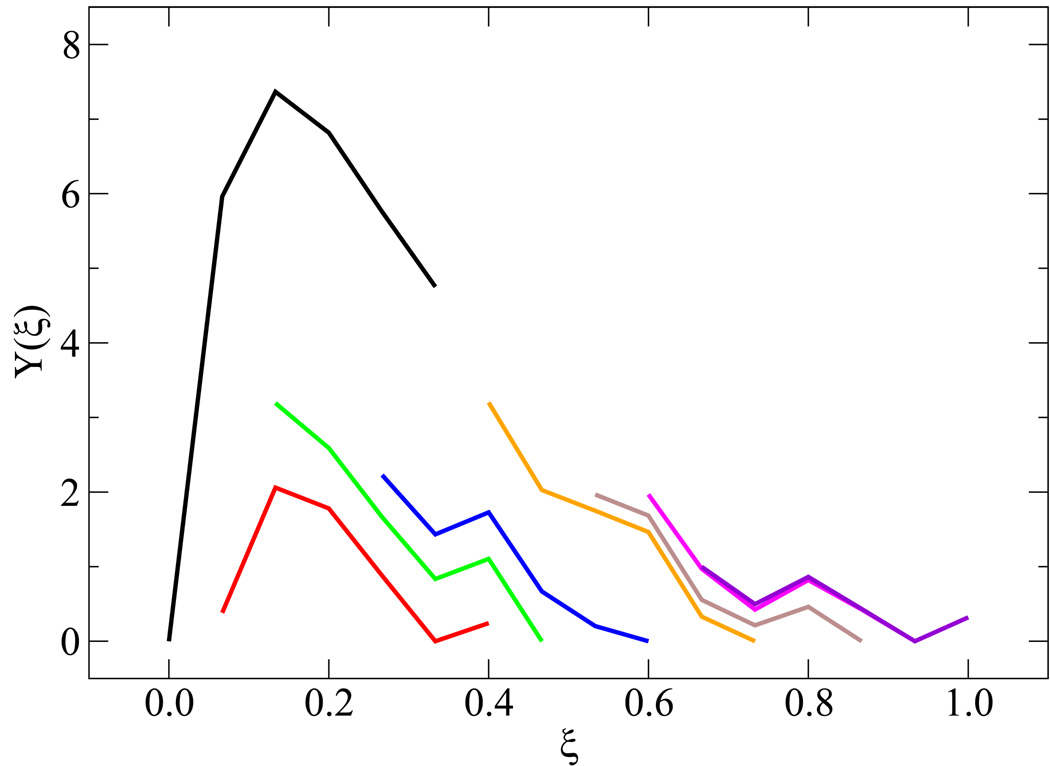
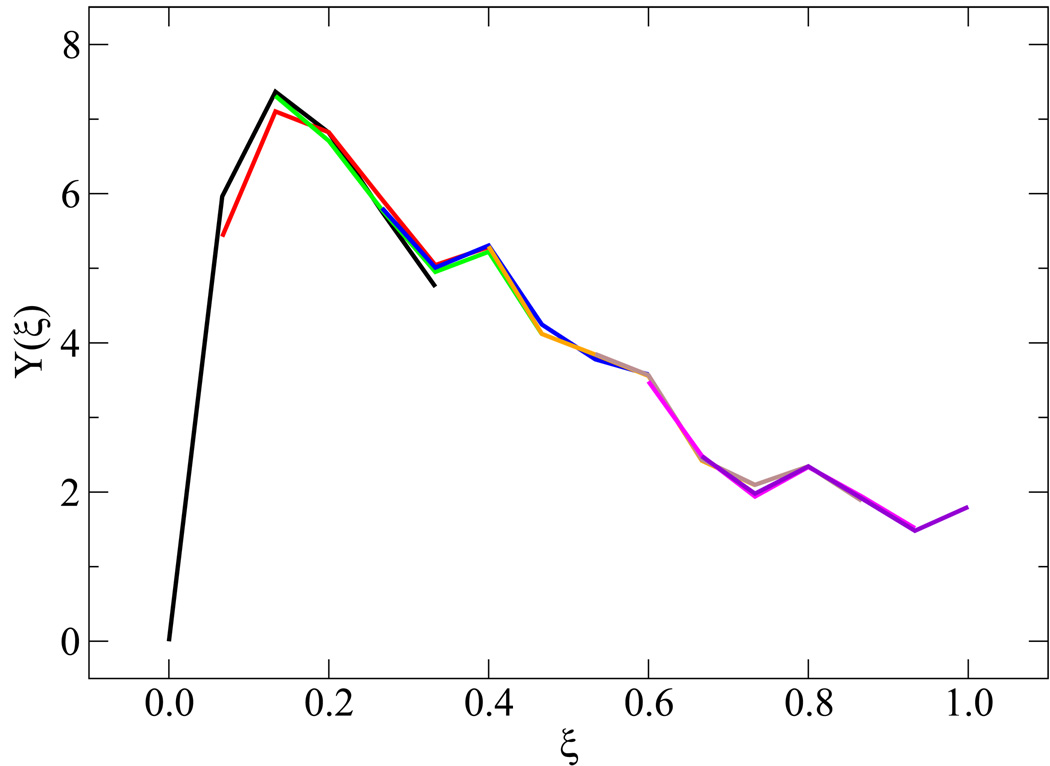
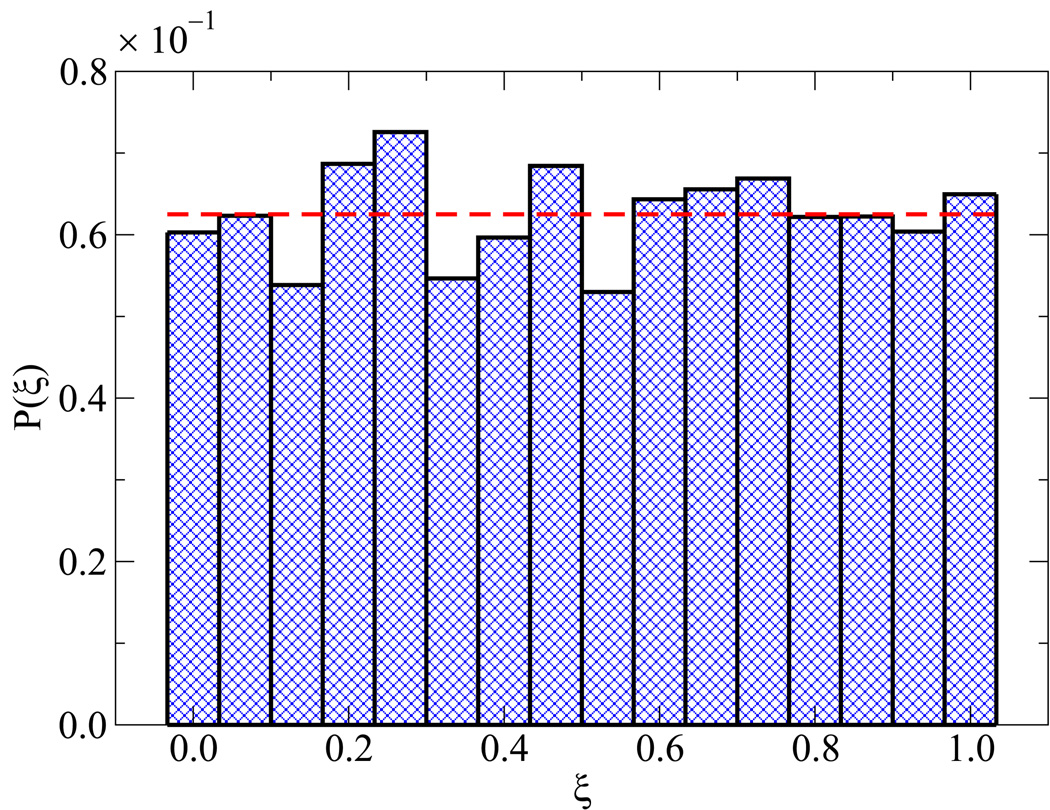
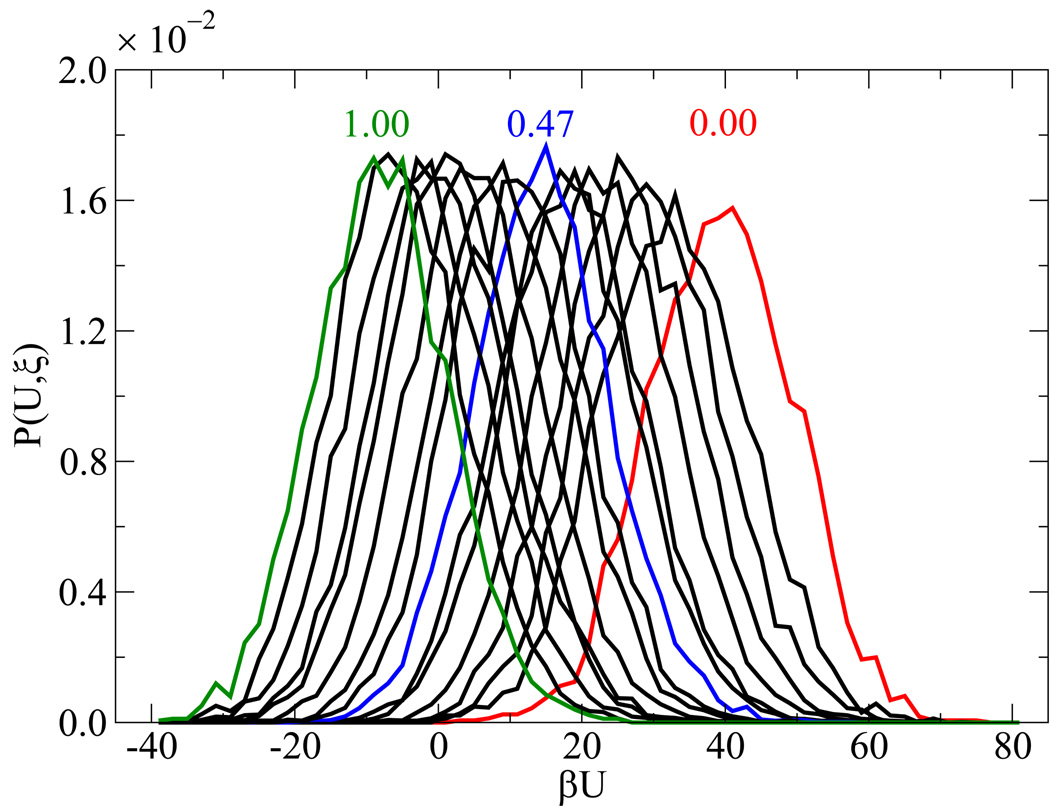
Simulating the melting transition and renaturation of DNA poses a number of sampling challenges. A few details concerning the validity of EXE simulations are therefore in order. Figure 3(a) addresses the extent of overlap among weights from neighboring windows. After applying Eqs. (3.9)–(3.10) and shifting the weights by their respective additive constants, the profile of weights yields the results shown in figure 3(b). These findings help establish that the sampling between windows is statistically sound, and that the error associated for a given ϒ(ξi) is of 𝒪[10−1]. Uniform sampling can also be gauged from the corresponding energy profiles and histograms of visits to each state ξi. These results are shown in figure 4, where each state is visited with equal probability within our predefined tolerance [panel 4(a)] and characterized by an energy distribution comparable to that of neighboring states [panel 4(b)].
Figure 3.
Implementation of WHAM to combine results for the weighting factors ϒ(ξ) from multiple simulation windows in the determination of free energy profiles. Shown are the raw data [panel (a)] and the data after applying the additive constants [panel (b)].
Figure 4.
Verification of uniform sampling. Data are shown for the histogram of visits [panel (a)] and potential energy distributions [panel (b)] for each state. For panel (b), ξ decreases from left to right, some values of ξ for P(U, ξ) are highlighted in color.
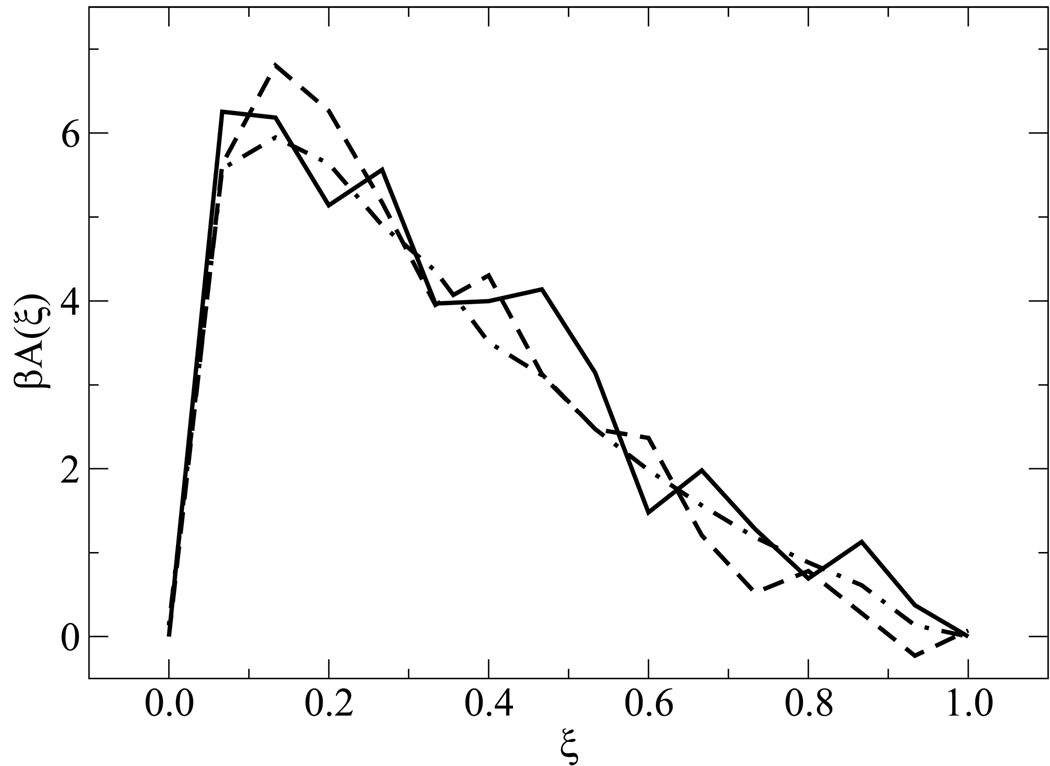
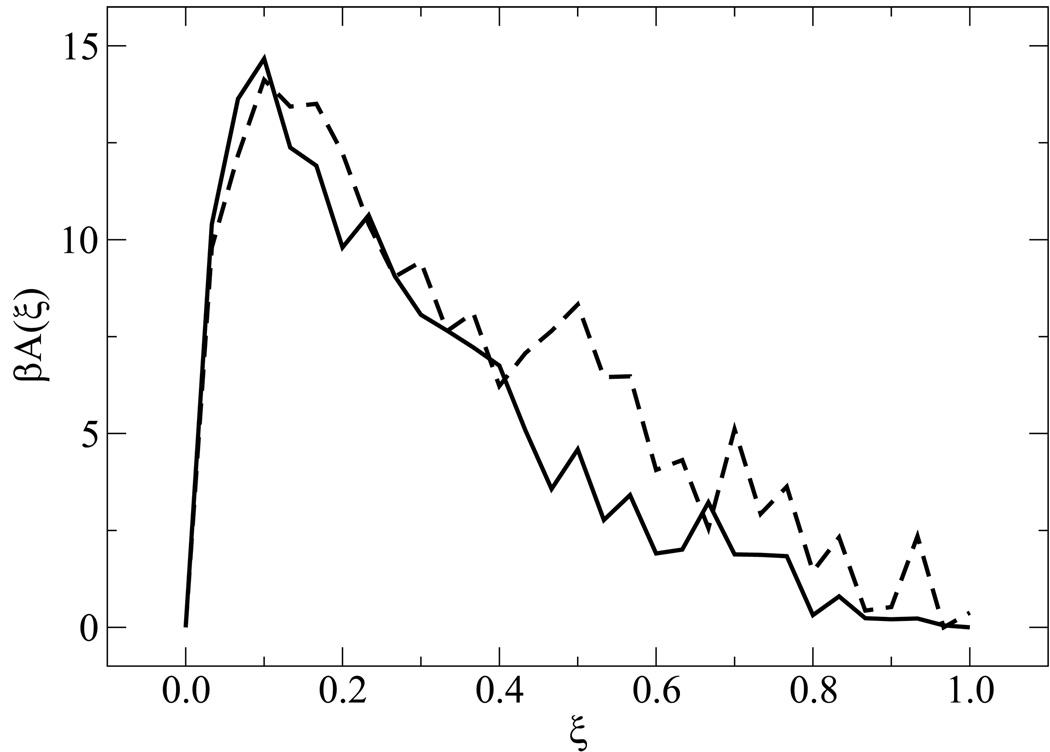
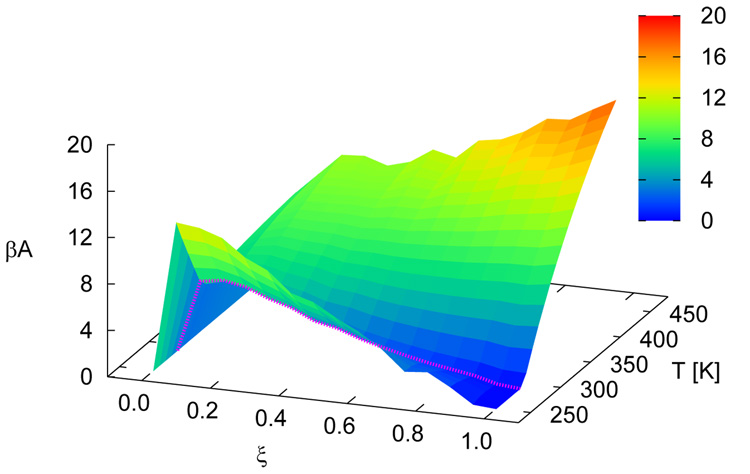
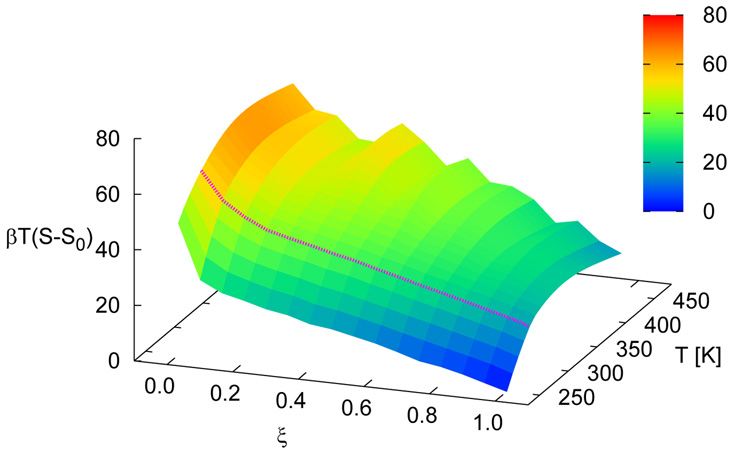
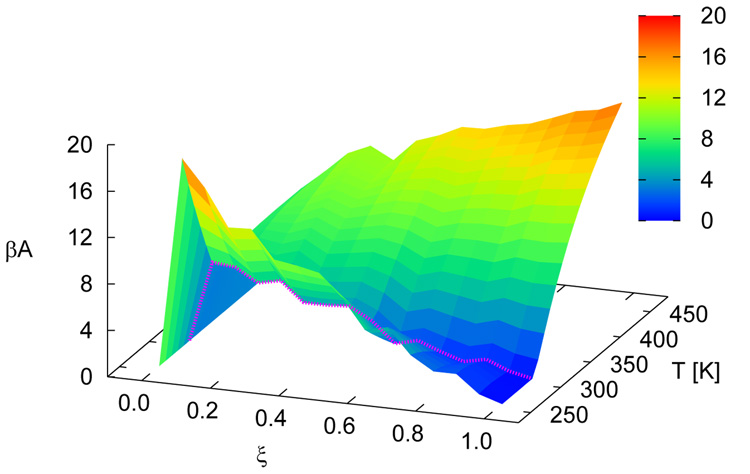
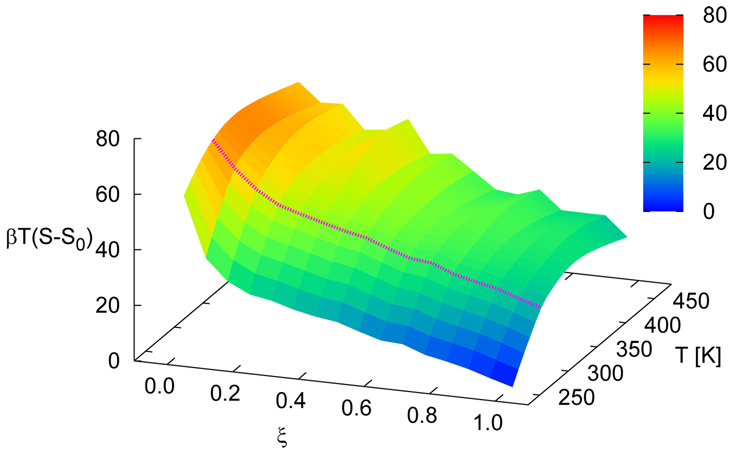
Figure 5 shows free energy profiles of all sequences for n = 15. While each system displays a unique signature (albeit weak) in its free energy function, a striking finding from the simulations is the qualitative similarity of the distinct profiles at the melting transition. Results for the n = 30 case are shown in figure 6. For these systems, the overall shape of the free energy function is qualitatively similar, but the values of the free energy are higher and the profile is slightly narrower than that observed for the shorter molecules, attesting to the increased sharpness of the associated transition. Figure 7 depicts the free energy and entropy landscapes for a spectrum of temperatures as a function of DNA base pair contacts for fCG = 0.0 [panels 7(a)–(b)] and fCG = 0.4 [panels 7(c)–(d)]. As can be gleaned from these figures, the process of renaturation/denaturation exhibits a significant dependence on entropic contributions. In particular, at higher temperatures entropic contributions become substantial. States corresponding to low ξ exhibit invariably higher entropic contributions, since in this limit the constraints of hydrogen bonding are inhibited and molecules can explore a large space of disassociated configurations.
Figure 5.
Free energy profiles for different systems. Data are shown for n = 15 with fCG = 0.0 (dot-dashed line), fCG = 0.2 (dashed line), and fCG = 0.4 (solid line).
Figure 6.
Same as in figure 5, but for n = 30 with fCG = 0.0 (dashed line) and fCG = 0.2 (solid line).
Figure 7.
Free energy (βA) landscapes [panels (a) and (c)] and entropy [βT(S − S0)] landscapes [panels (b) and (d)] as a function of ξ and T. Data are shown for n = 15 with fCG = 0.0 [panels (a) and (b)] and fCG = 0.4 [panels (c) and (d)]. The profile at the melting temperature for each system is denoted with a magenta line. S0 corresponds to the entropy of the system for intact dsDNA (ξ = 1.0) for the lowest temperature shown.
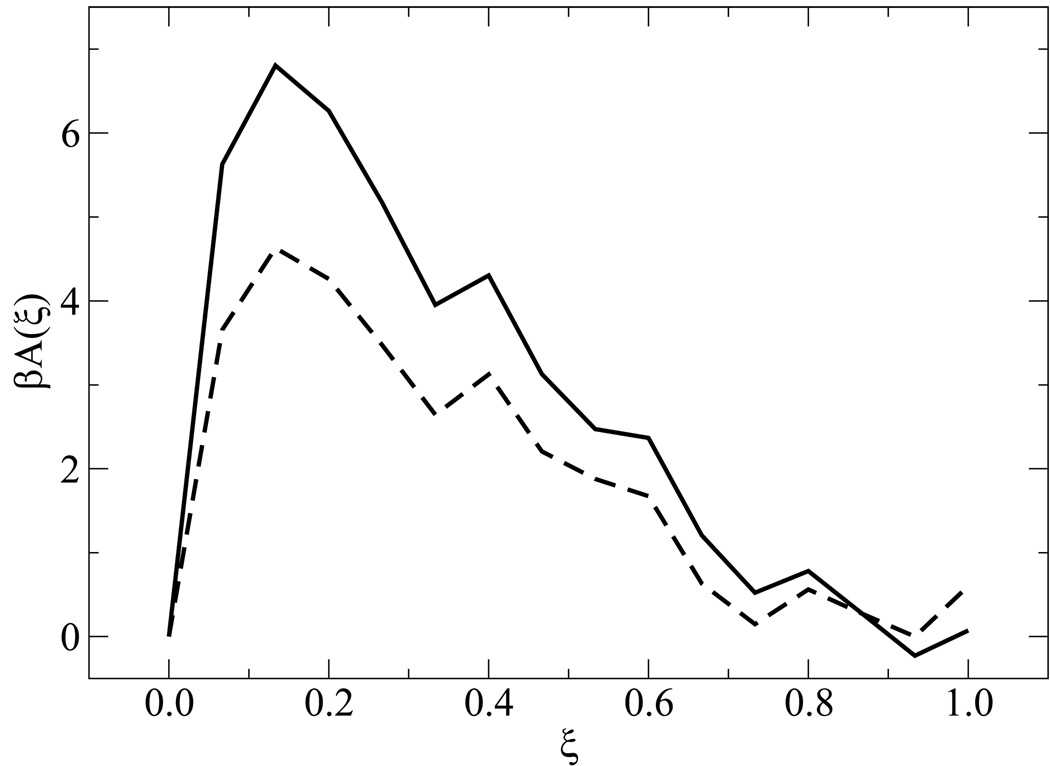
The model considered in this work has been shown to be capable of describing ionic effects on melting temperature and on persistence length. It is therefore of interest to consider the effect of salt on the transition of the system for n = 15 (fCG = 0.2). Note that so far, all EXE calculations were performed at [Na+] = 0.069 M, as shown by the solid line in figure 8. The corresponding free energy profile for [Na+] = 0.005 M is shown by the dashed line, which exhibits Tm = 275 K. At this salt concentration, energy barriers for molecular reassociation are lowered by increasing molecular stiffness. Figure 8 suggests that more “extended” or open configurations allow two complementary strands to present themselves in a manner that facilitates renaturation. Molecular strengthening has been suggested as the mechanism behind the Phenol Emulsion Reassociation Technique (PERT), in which phenol stabilizes ssDNA in an extended, rod-like conformation [54]. While the context in which renaturation occurs in PERT is different from the present study, the parallel to draw is that molecular stretching of ssDNA favors reassociation.
Figure 8.
Salt effects on the free energy profile. Results are shown for n = 15 (fCG = 0.2) with [Na+] = 0.005 M (dashed line) and 0.069 M (solid line).
We end this section with a few remarks concerning the actual process of renaturation, as inferred from the free energy profiles obtained from EXE simulations. To gain some preliminary insights into the nature of the critical nucleus size and its role in system dynamics, we focus on the n = 15 (fCG = 0.2) system and examine the appearance of the free energy in figure 8. From that figure, the critical nucleus size is found to be nξ = 2. Note, however, that our EXE simulations were conceived to follow a specific (and in some sense arbitrary) pathway. That pathway does not necessarily correspond to the actual pathway followed by complementary strands when they renature. We therefore investigated the preference that states located near this region of the free energy profile have in sampling either basin (which we assign to states nξ = 0 and 14, respectively). We performed fleeting LD trajectories (for a timescale of 200 ps) on configurations from prior EXE simulations characterized by nξ ∈ {1, 2, 3}. For each value of ξi, ten initial configurations were considered (half denatured from the 5′-end, the other half from the 3′-end), each of which was subjected to 100 fleeting trajectories. From these trajectories, runs which display a traversal tending to ξ → 1.0 were counted, the results of which are displayed in table 3. We find that roughly half of the configurations with nξ = 2 display a route leading to the fully renatured state. These results suggest that nξ = 2 could correspond to a critical nucleus size for renaturation. Within the assumptions or constraints that went into the EXE thermodynamic cycle, the size of the nucleus already establishes a preference for the system to follow an association pathway. The association mechanism inferred from those LD trajectories tending to ξ = 1.0 exhibits sequential reassociation, consistent with the thermodynamic pathway followed by our EXE simulations.
Table 3.
Characterization of the Critical Nucleus.
| Extent of Reaction, ξ | Fraction Configurations with ξ → 1 |
|---|---|
| 0.06 | 0.42 |
| 0.13 | 0.59 |
| 0.20 | 0.69 |
5.3. Transition Path Sampling
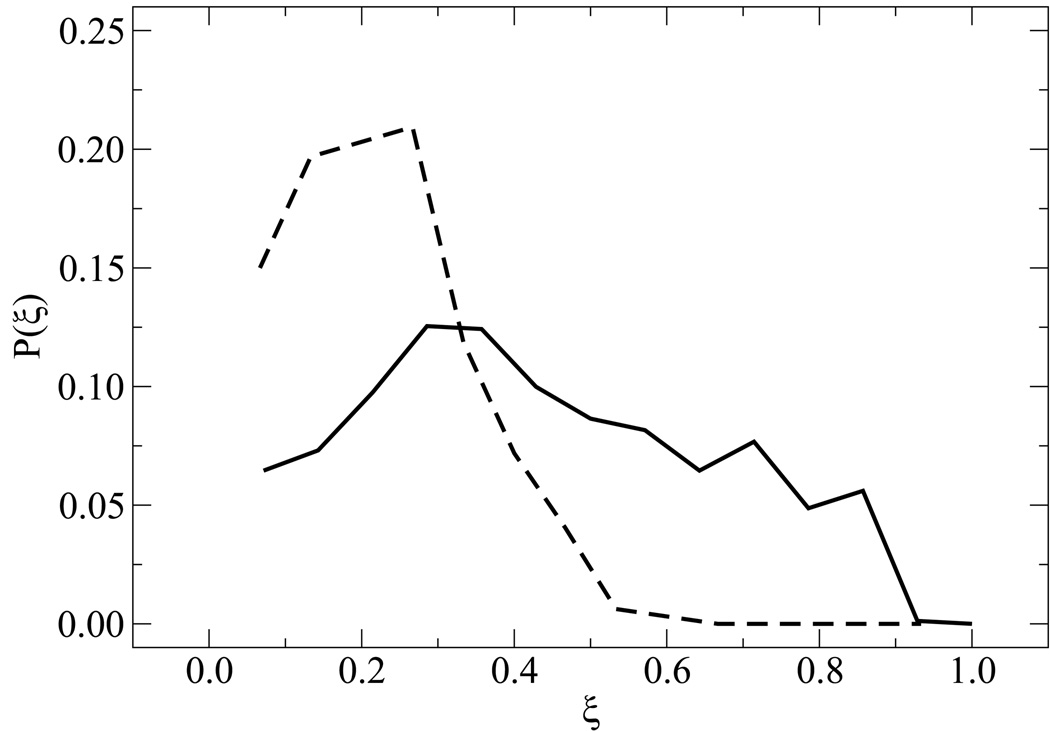
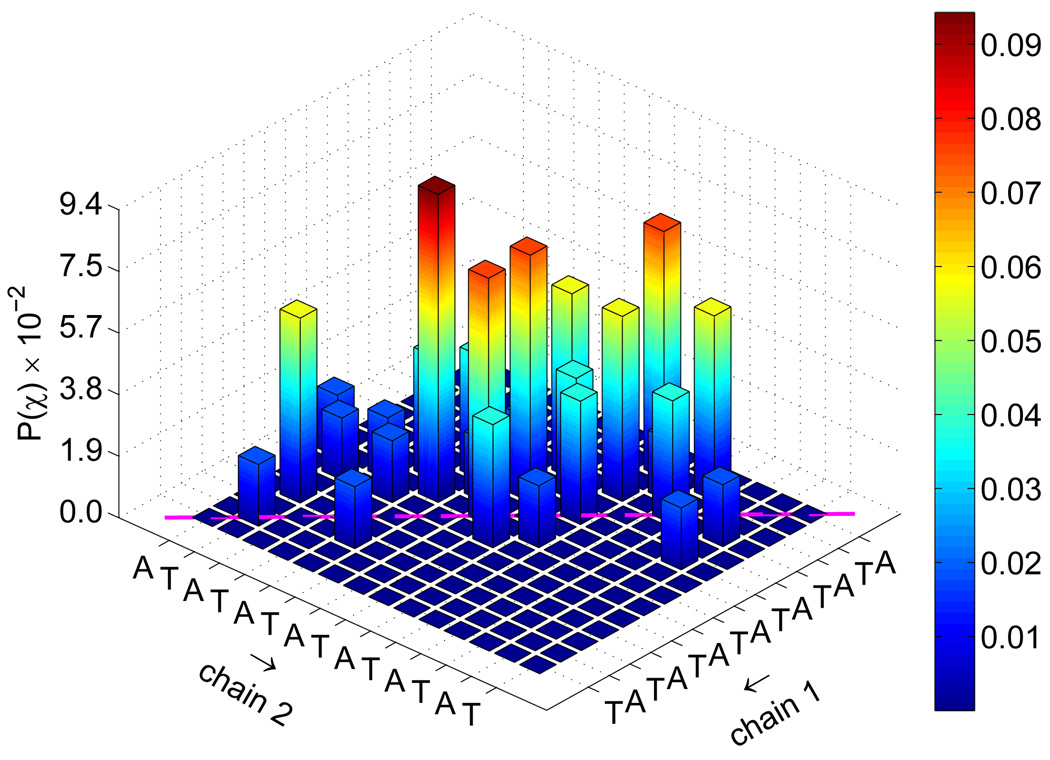
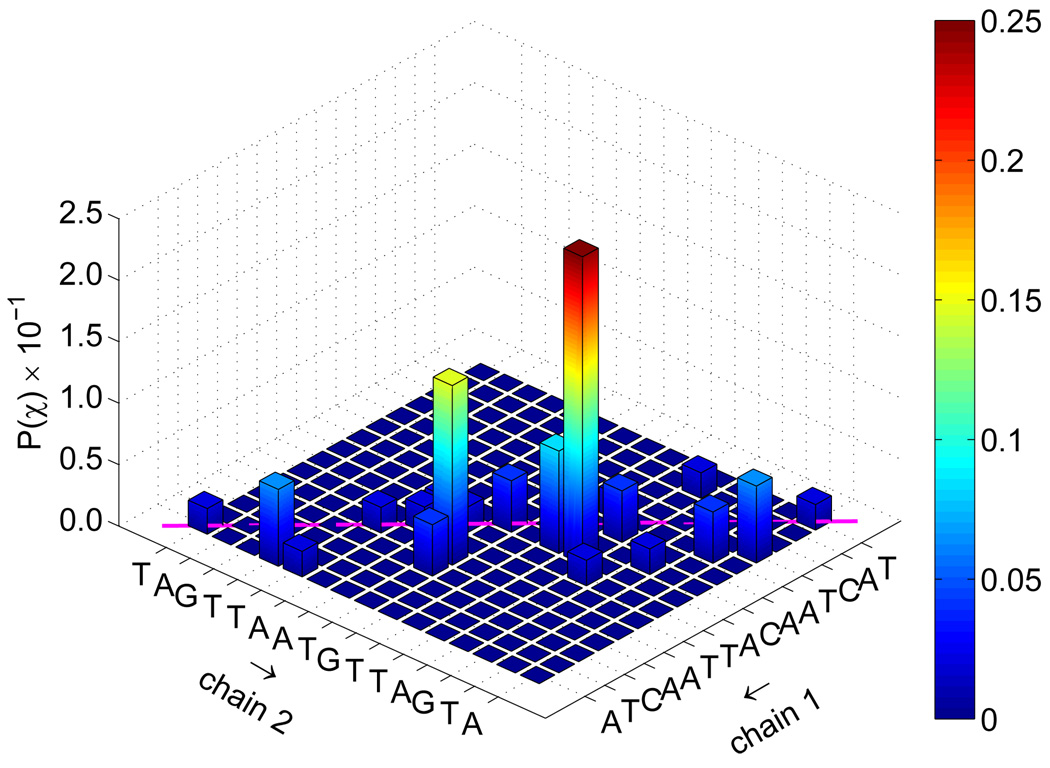
As mentioned above, the predefined thermodynamic pathway assumed for our EXE calculations suggests the existence of a critical nucleus for renaturation of two base pairs. That thermodynamic pathway, however, was imposed on the calculations to extract a free energy. It is therefore of interest to investigate and compare those results with those extracted from TPS simulations, in which no renaturation mechanism is assumed a priori. TPS calculations were performed at ~5 K below Tm,obs (see table 2) for n = 15 (fCG = 0.2), and n = 14 (fCG = 0.0) (the equivalent n = 15 system is less interesting from symmetry considerations). We refer to these systems as “random” and “homogeneous” sequences, respectively. We analyzed in detail configurations belonging to the TSE (see Section 4 for further details on the TSE definition). We determined the probability to find a specific extent of reaction P(ξ), the results of which are shown in figure 9. The distribution for the fCG = 0.0 case is rather broad, exhibiting a “diffusive” pathway, while that of the fCG = 0.2 case clearly displays distinct signatures for association.
Figure 9.
Probability of extents of reaction in the TSE. Results are shown for fCG = 0.0 (solid line) and fCG = 0.2 (dashed line).
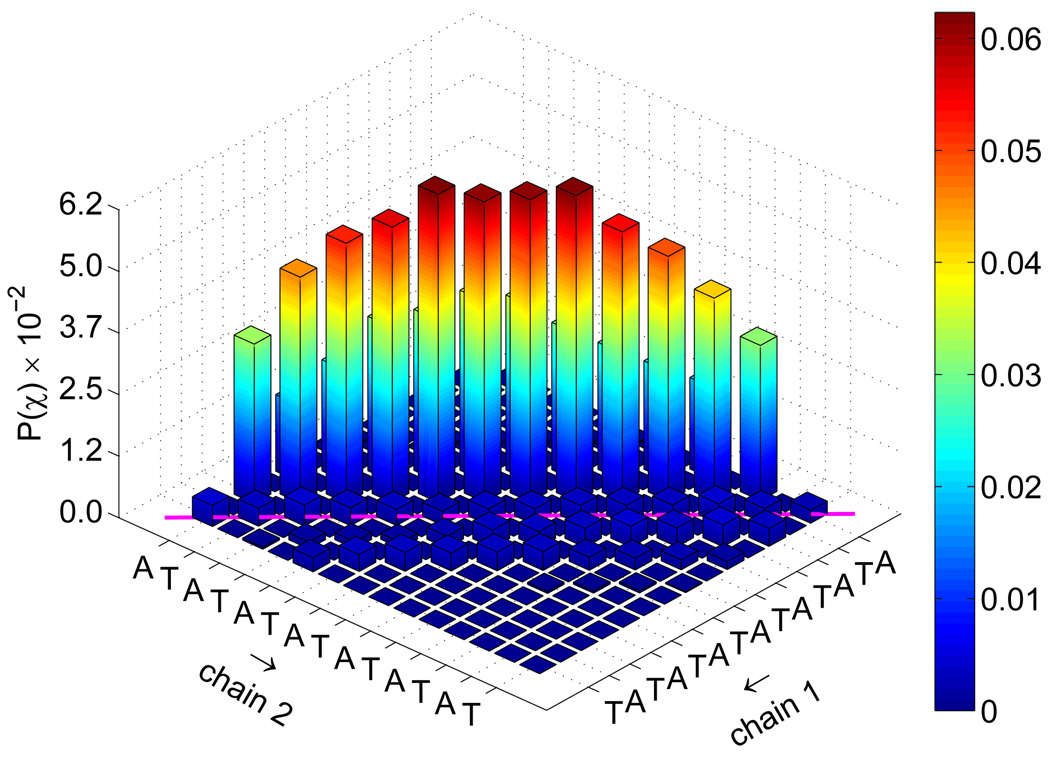
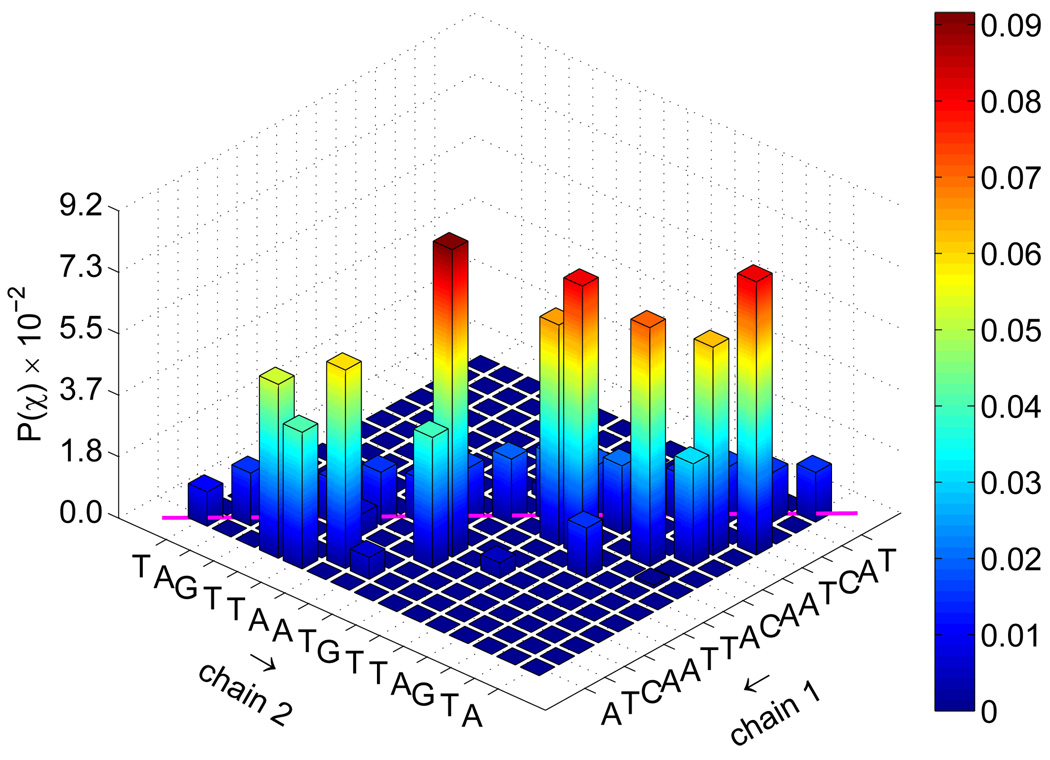
To investigate further the nature of the transition state for the reassociation of DNA, we determined from the TSE the joint probability that complementary base pairs will associate, P(χ). Those distributions are shown in figure 10. Native contacts in that figure correspond to diagonal entries. For the fCG = 0.2 case, one observes that a large portion of TSE configurations display the formation of a few key contacts. On the other hand, the same distribution for fCG = 0.0 is less specific. Further decomposition of this distribution into the formation of one base pair is given in figure 11. It is evident that for early extents of reaction, key base pair contacts happen primarily in the middle portion of the chain. As the system nears ξ ~ 0.5, an increasingly large fraction of contacts form near-native base pairs in both the random and the homogeneous sequences.
Figure 10.
Joint probability of base pair contacts P(χ) for all extents of reaction ξ shown in figure 9. Data are shown for fCG = 0.0 [panel (a)] and fCG = 0.2 [panel (b)]. The sequence for each strand is denoted along the axes, with “chain 1” being the sense strand. Arrows along the axes denote the 5′-to-3′ direction for each chain. Native base pair contacts are denoted along the diagonal (magenta line).
Figure 11.
Same as in figure 10, but for nξ = 1.
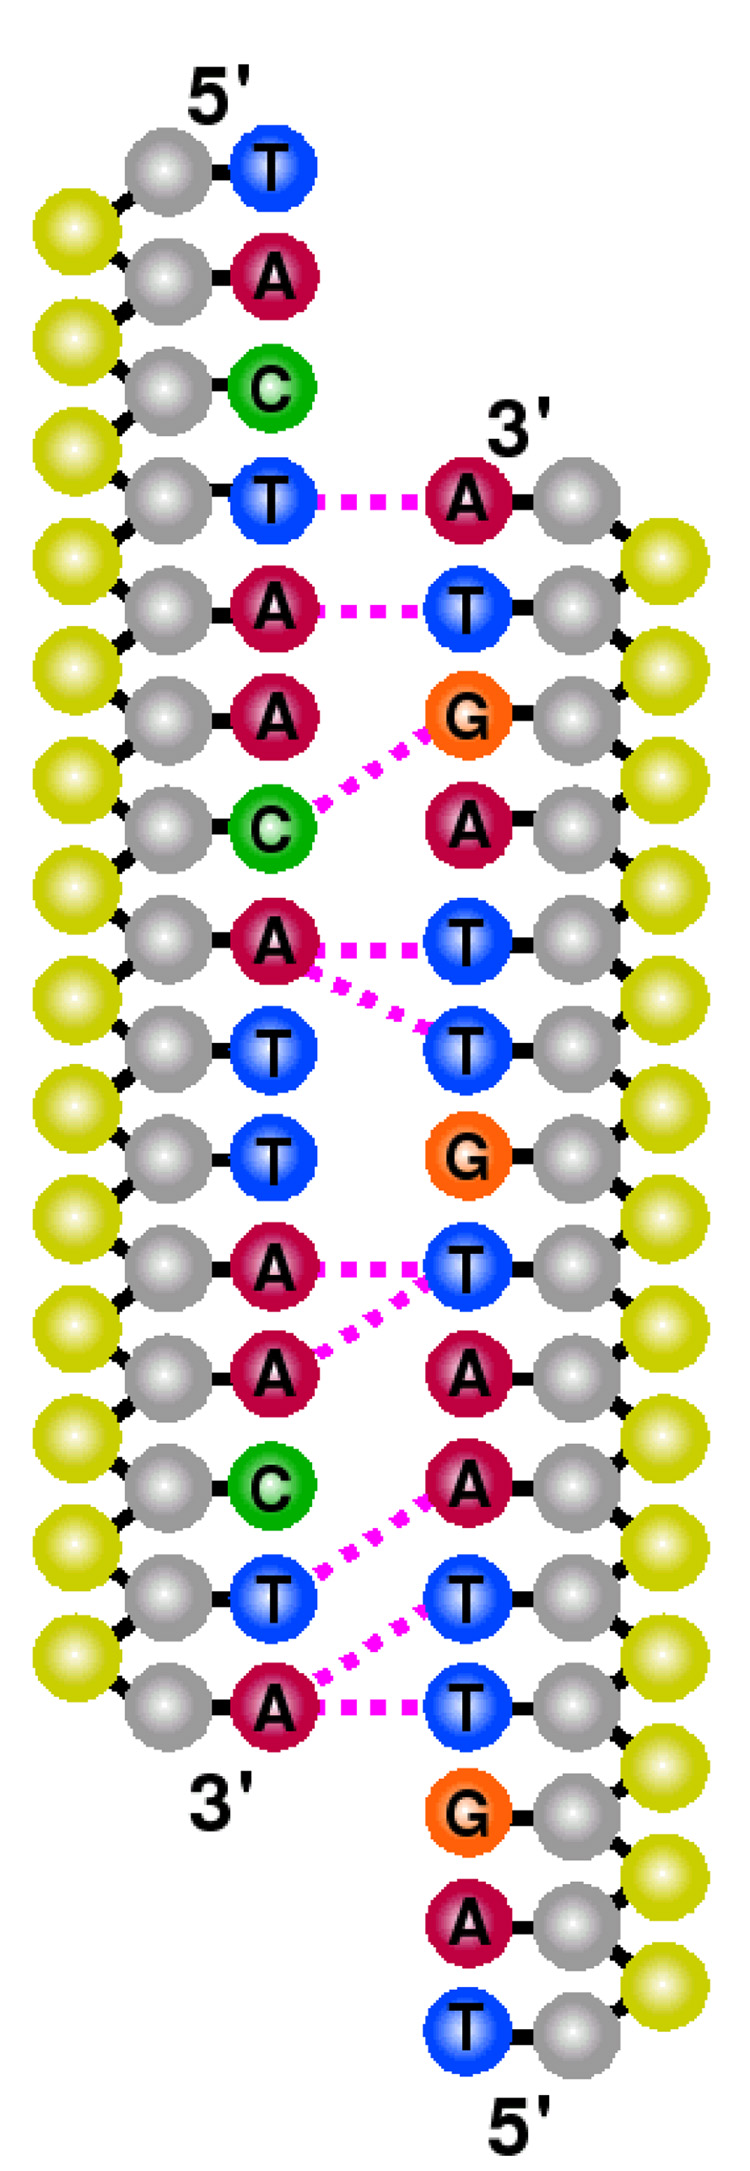
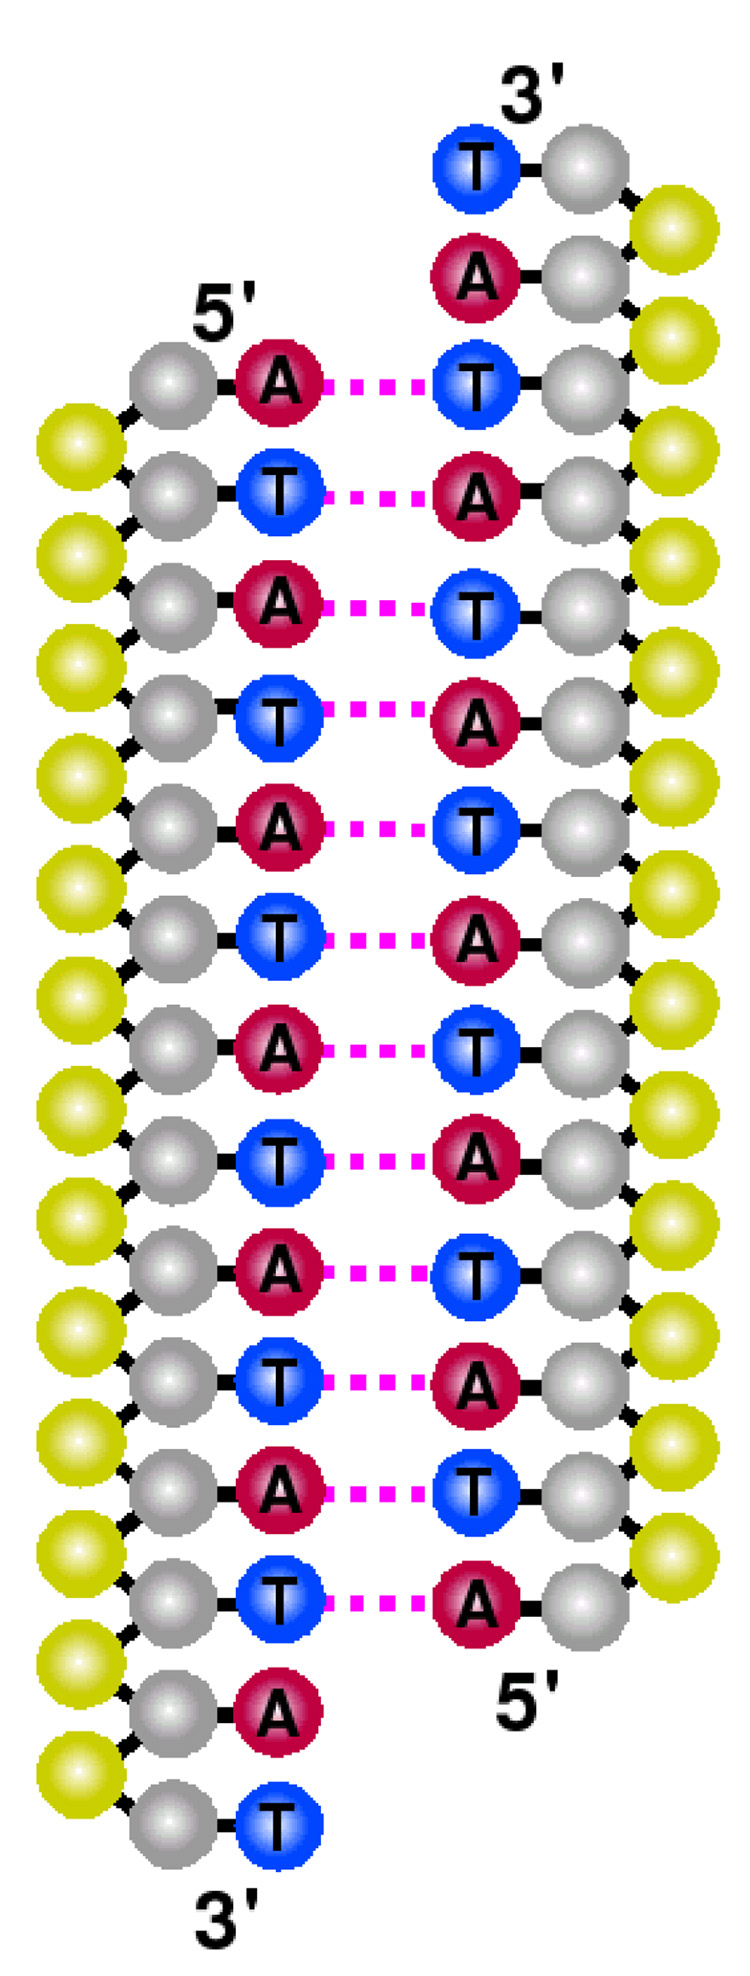
Figure 12 provides a schematic representation of configurations that arise with a high contact probability in the TSE. These figures do not necessarily account for the sequence in which base pairs form, but rather help elucidate preferred regions for molecular association. In the case of the random sequence, only specific contacts are highly prevalent. This suggests that for heterogeneous DNA, molecular reassociation occurs via a selective, sequence-dependent pathway. For the homogeneous sequence, on the other hand, the reassociation pathway is less selective: many contacts exhibit similar probabilities. Figure 11 indicates that the homogeneous system still exhibits a preference for initial nucleation involving central base pairs. The progression of figure 11 from one to four bonds (not shown) and the connectivity of base pairs (not shown) reveals that molecular slithering plays a stronger role in homogeneous DNA than in the random sequence.
Figure 12.
Schematic of DNA systems identifying base pairs (dotted, magenta lines) with highest probability in the TSE. Shown are characteristic reassociation sites for fCG = 0.2 [panel (a)] and fCG = 0.0 [panel (b)]. The sense strand for each case is placed on the left. Moieties are denoted by color as sugar (gray), phosphate (yellow), adenine (red), cytosine (green), guanine (orange), and thymine (blue) sites.
Another point to extract from figure 12 is the relative positioning of the complementary strands of DNA. While sequence effects are largely at play in the random case, for the homogeneous sequence, the TSE is mostly populated with configurations in which the sense (left) strand is shifted downward with respect to its partner. Conjugate gradient energy minimizations on reference configurations with the same molecular arrangement reveal a lower potential energy than that of the alternate configuration (where the sense strand is upward). This difference is due to an interplay between intramolecular contributions with intermolecular ones, in which the former discriminate 5′-to-3′ directionality. Note that our coarse grain minimization results have also been confirmed with atomistic simulations (not reported). These observations provide a basis for the role played by helical arrangements in guiding reassociation events. Further investigations at elucidating the mechanism of reassociation, and extensions to larger molecular systems will be addressed in a future publication.
6. Summary
A study on the denaturation/renaturation cycle of DNA has been performed in the context of expanded ensembles (EXE) and Transition Path Sampling (TPS). Free energy profiles acquired from EXE for systems prepared with identical conditions but varying composition exhibit qualitatively similar profiles. For short oligonucleotides, it is found that the thermodynamic melting transition corresponds to the onset of denaturation curves, as opposed to the mid range of such curves. The maximum in the free energy occurs for small extents of reaction, ξ ≈ 0.15, corresponding to ~2 base pairs. The profile for larger chains displays a higher and slightly narrower response, indicative of the sharper nature of the transition. As salt concentration is decreased, a lowering of the free energy profile is observed. This effect presumably arises because molecular reassociation is facilitated by an increase in molecular rigidity.
At the melting temperature, an analysis of the transition state, as acquired by TPS, reveals two mechanisms for molecular reassociation. Initial contacts tend to involve base pairs near the middle region of the sequence, yielding a transition state in which complementary strands are offset from one another by two to three bases. In the case of homogeneous sequences, reassociation occurs through a diffusive pathway in which a nucleation event is followed by molecular slithering. For random sequences, the pathway is more sequence specific and involves the formation of key contacts, which subsequently facilitate molecular zippering. In homogeneous sequences, helix-helix interactions appear to have a greater role in molecular reassociation, where a specific arrangement between complementary DNA strands is observed in the transition state ensemble. At the melting temperature, the critical nucleus size garnered from analysis of TPS data is ξ ≈ 0.25, corresponding to ~4 base pairs. Future work will seek to characterize the critical nucleus for chains of different lengths, a broader range of compositions, and for different degrees of supercooling.
Acknowledgments
E. J. S. was supported by an NHGRI training grant to the Genomic Sciences Training Program (5T32HG002760). V. O. was supported by an NLM training grant to the Computational and Informatics in Biology and Medicine Training Program (NLM T15LM007359). This work was also supported by the National Science Foundation through the University of Wisconsin-Madison NSEC.
Appendix A. Coarse Grain Force Field for DNA
The force field for the coarse grain model of DNA consists of both bonded and non-bonded interactions. These contributions are described below with relevant numerical parameters listed in table A1. The total contribution of the potential energy of the system is given by the sum of eight distinct contributions,
| (A.1) |
Contributions from “bonded” interactions are given by two-, three-, and four-body terms, which represent bonding, bending, and torsion constraints, respectively, through the expressions
| (A.2) |
| (A.3) |
| (A.4) |
Here, Ubond accounts for covalent bonding, with k1 and k2 representing bond constants, while di and d0i are instantaneous and equilibrium site-site separations for the ith bond in the set of nbond bonds. Molecular bending is accounted for through Ubend, with a bend constant kθ, as well as an instantaneous and equilibrium bond angle θi and θ0i for the ith bend in the set of nbend bends. Torsional interactions are represented through Utors, with a torsional constant kø, along with instantaneous and equilibrium dihedral angles øi and ø0i in the set of ntors torsions. To preserve the right-handed chirality in B-form DNA, the scheme of Hoang and Cieplak [27] is used.
Non-bonded, pairwise interactions are described through five contributions as
| (A.5) |
| (A.6) |
| (A.7) |
| (A.8) |
| (A.9) |
The first two contributions are specific to DNA systems. Base-stacking (an intrastrand effect) is taken into account through Ustck, which acts uniformly (i.e., with a single energy scale ε) on all native contacts nstck (i.e., intrastrand sites found within a cutoff radius rccut = 9 Å in the reference structure of DNA). An interaction specific length scale σij between sites i and j contributes to the stiffness of the DNA backbone by controlling the instantaneous site-site separation rij.
Hydrogen bonding is accounted for by Ubase, and acts between all nbase complementary (Watson-Crick) base pairs that do not participate in Ustck (i.e., this term takes into account both intra- and interstrand possibilities). Each ith base pair, characterized by the separation rij between intra- or interstrand sites i and j, will be governed by energies εi ∈ {εAT, εCG} and lengths σi ∈ {σAT, σCG}, where εαβ = εβα and σαβ = σβα. A complementary base pair is considered to be hydrogen bonded when the separation between bases is rij < (σi + 2.0 Å).
Interactions occurring between the nnnat non-native contacts (including mismatched base pairs) are assigned to Unnat. This is a purely repulsive, excluded-volume contribution (a Weeks-Chandler-Anderson interaction) characterized by a single energy scale ε. An energy cost is imparted to the system as interparticle separations rij fall below a cutoff length scale rcoff, but otherwise does not contribute to the stability of the system. In the case of mismatched base pairs, rcoff = 1.00 Å, while in all other cases, rcoff = 6.86 Å, the latter of which corresponds to a mean pair separation value. The length scale at which the potential vanishes is given by σ0 = 2−1/6rcoff.
The remaining two non-bonded interactions supply the additional physics needed to model “polyelectrolyte” features of DNA. Electrostatic contributions are treated through Uelec at the level of Debye-Hückel theory. This term accounts for interactions involving all possible nelec pairings between phosphate sites i and j that do not enter into Ubend. The Debye length, λD, which defines the spatial extent of charge screening at an interparticle separation rij due to solvent conditions, is given by
| (A.10) |
where ϵ0 is the permittivity of free space, ϵ(T, I) is an effective dielectric constant, β = (kBT)−1, NA is Avogadro’s number, ec is the elementary charge, and I is the ionic strength of the solution (identical to the molarity of the solution for the 1:1 electrolyte NaCl considered in this study). The dielectric constant ϵ(T, I), specialized here to treat aqueous salt solutions, includes a dependence on temperature and salt concentration, both of which have a direct bearing on the polarizability of water. Decomposition of the effective dielectric constant into a product of contributions was suggested earlier in the literature [55] as
| (A.11) |
where ϵ(T) is the static (zero-frequency) dielectric constant at absolute temperature T (in Kelvin), and a(I) is the salt correction for a solution with molarity I in NaCl. Each of these contributions, in turn, are given by
| (A.12) |
and
| (A.13) |
The solvent-induced contribution, Usolv, is a novel addition to the force field meant to embody (implicitly) the entropic effects associated with the arrangement of water and ionic species during denaturation or renaturation of DNA. This Morse-like interaction is characterized by an energy scale εs and an interparticle separation rij, while the spatial range of the potential is controlled by α−1, with a potential energy minimum set to rs. Solvent-induced interactions nsolv enter into Usolv through all possible interstrand sugar site pairings. Parameters for this contribution are chosen to be compatible with the molecular geometry of DNA. As the solvent-induced interaction is meant to embody many-body effects, it depends on chain length and ionic conditions. Calibration of the model against empirical data yields the following expressions for the strength of interaction as a function of chain length,
| (A.14) |
with ε∞ = 0.504982ε, while the salt dependence is approximated by the expression,
| (A.15) |
The two effects from Eqs. (A.14) and (A.15) can be combined provided n ≳ 15 through the relation εs ≈ AIεN, with AI serving as a universal curve.
Table A1.
Force Field Parameters.
| Parameter | Value | Units |
|---|---|---|
| ε | 0.769856 | kJ · mol−1 |
| εAT | 2.000ε | kJ · mol−1 |
| εCG | 2.532ε | kJ · mol−1 |
| εs | system-dependent | kJ · mol−1 |
| k1 | ε | kJ · mol−1 · Å−2 |
| k2 | 100ε | kJ · mol−1 · Å−4 |
| kθ | 1400ε | kJ · mol−1 · rad−2 |
| kϕ | 28ε | kJ · mol−1 |
| α−1 | 5.333 | Å |
| rs | 13.38 | Å |
| σij | pair-dependent | Å |
| σAT | 2.9002 | Å |
| σCG | 2.8694 | Å |
| σ0 (mismatch) | 1.00 · 2−1/6 | Å |
| σ0 (otherwise) | 6.86 · 2−1/6 | Å |
Footnotes
PACS numbers: 82.30.Nr,82.30.Rs,82.37.Np,82.39.Pj,87.10.Rt,87.10.Tf,87.14.gk
References
- 1.Wartell RM, Benight AS. Thermal denaturation of DNA molecules: a comparison of theory with experiment. Phys. Rep. 1985;126(2):67–107. [Google Scholar]
- 2.Hill TL. Generalization of the one-dimensional Ising model applicable to helix transitions in nucleic acids and proteins. J. Chem. Phys. 1959;30:383–387. [Google Scholar]
- 3.Lifson S, Zimm BH. Simplified theory of the helix-coil transition in DNA based on a grand partition function. Biopolymers. 1963;1:15–23. [Google Scholar]
- 4.Marmur J, Rownd R, Schildkraut CL. Denaturation and renaturation of deoxyribonucleic acid. Prog. Nucleic Acid Res. 1963;1:231–300. [Google Scholar]
- 5.Rau DC, Klotz LC. A unified theory of nucleation-rate-limited DNA renaturation kinetics. Biophys. Chem. 1978;8:41–51. doi: 10.1016/0301-4622(78)85021-2. [DOI] [PubMed] [Google Scholar]
- 6.Murugan R. Sample size autocorrelation analysis of kinetic data: Resolving reaction path heterogeneity. J. Chem. Phys. . 2002;117:6372–6377. [Google Scholar]
- 7.Britten RJ, Davidson RH. Studies on nucleic acid reassociation kinetics: Empirical equations describing DNA reassociation. Proc. Natl. Acad. Sci. USA. 1976;73(2):415–419. doi: 10.1073/pnas.73.2.415. [DOI] [PMC free article] [PubMed] [Google Scholar]
- 8.Rau DC, Klotz LC. A more complete kinetic theory of DNA renaturation. J. Chem. Phys. 1975;62(6):2354–2365. [Google Scholar]
- 9.Marmur J, Doty P. Thermal renaturation of deoxyribonucleic acids. J. Mol. Biol. 1961;3:585–594. doi: 10.1016/s0022-2836(61)80023-5. [DOI] [PubMed] [Google Scholar]
- 10.Nygaard AP, Hall BD. Formation and properties of RNA-DNA complexes. J. Mol. Biol. 1964;9:125–142. doi: 10.1016/s0022-2836(64)80095-4. [DOI] [PubMed] [Google Scholar]
- 11.Marmur J, Lane D. Strand separation and specific recombination in deoxyribonucelic acids: biological studies. Proc. Natl. Acad. Sci. USA. 1960;46(4):453–461. doi: 10.1073/pnas.46.4.453. [DOI] [PMC free article] [PubMed] [Google Scholar]
- 12.Subirana JA, Doty P. Kinetics of renaturation of denaturated DNA. I. Spectrophotometric results. Biopolymers. 1966;4(2):171–187. doi: 10.1002/bip.1966.360040204. [DOI] [PubMed] [Google Scholar]
- 13.Thrower KJ, Peacocke AR. The kinetics of renaturation of DNA. Biochim. Biophys. Acta. 1966;119(3):652–654. doi: 10.1016/0005-2787(66)90148-1. [DOI] [PubMed] [Google Scholar]
- 14.Wetmur JG. Hybridization and renaturation kinetics of nucleic acids. Annu. Rev. Biophys. Bioeng. 1976;5:337–361. doi: 10.1146/annurev.bb.05.060176.002005. [DOI] [PubMed] [Google Scholar]
- 15.Saunders M, Ross PD. A simple model of the reaction between polyadenyic acid and polyuridylic acid. Biochem. Biophys. Res. Commun. 1960;3:314–318. doi: 10.1016/0006-291x(60)90248-5. [DOI] [PubMed] [Google Scholar]
- 16.Kallenback NR, Crothers DM, Mortimer RG. Interpretation of the kinetics of helix formation. Biochem. Biophys. Res. Commun. 1963;11:213–216. doi: 10.1016/0006-291x(63)90336-x. [DOI] [PubMed] [Google Scholar]
- 17.Murugan R. A stochastic model on DNA renaturation kinetics. Biophys. Chem. . 2003;104(3):535–541. doi: 10.1016/s0301-4622(03)00043-7. [DOI] [PubMed] [Google Scholar]
- 18.Murugan R. A theory on the origin of cooperativity in DNA renaturation kinetics. Biophys. Chem. 2003;106:173–178. doi: 10.1016/s0301-4622(03)00190-x. [DOI] [PubMed] [Google Scholar]
- 19.Murugan R. Revised theory on DNA renaturation kinetics and its experimental verification. Biochem. Biophys. Res. Commun. 2002;293:870–873. doi: 10.1016/S0006-291X(02)00305-4. [DOI] [PubMed] [Google Scholar]
- 20.Matsuzawa Y, Yonezawa Y, Yoshikawa K. Formation of nucleation center in single double-stranded DNA chain. Biochem. Biophys. Res. Commun. 1996;225:796–800. doi: 10.1006/bbrc.1996.1253. [DOI] [PubMed] [Google Scholar]
- 21.Yoshikawa K, Matsuzawa Y. Nucleation and growth in single DNA molecules. J. Am. Chem. Soc. 1996;118:929–930. [Google Scholar]
- 22.Saiki RK, Gelfand DH, Stoffel S, Scharf SJ, Higuchi R, Horn GT, Mullis KB, Erlich HA. Primer-directed enzymatic amplification of DNA with a thermostable DNA polymerase. Science. 1988;239:487–491. doi: 10.1126/science.2448875. [DOI] [PubMed] [Google Scholar]
- 23.Buck MJ, Lieb JD. ChIP-chip: considerations for the design, analysis, and application of genome-wide chromatin immunoprecipitation experiments. Genomics. 2004;83(3):349–360. doi: 10.1016/j.ygeno.2003.11.004. [DOI] [PubMed] [Google Scholar]
- 24.Ramanathan A, Huff EJ, Lamers CC, Potamousis KD, Forrest DK, Schwartz DC. An integrative approach for the optical sequencing of single DNA molecules. Anal. Biochem. 2004;330(2):227–241. doi: 10.1016/j.ab.2004.03.029. [DOI] [PubMed] [Google Scholar]
- 25.Knotts TA, IV, Rathore N, Schwartz DC, de Pablo JJ. A coarse grain model for DNA. J. Chem. Phys. 2007;126(8) doi: 10.1063/1.2431804. 084901(1–12) [DOI] [PubMed] [Google Scholar]
- 26.Sambriski EJ, et al. Capturing the single-to-double stranded transition of DNA with a coarse grain model. Biophys. J. 2008 (to be submitted) [Google Scholar]
- 27.Hoang TX, Cieplak M. Molecular dynamics of folding of secondary structures in Gō-type models of proteins. J. Chem. Phys. 2000;112(15):6851–6862. [Google Scholar]
- 28.Rau DC, Parsegian VA. Direct measurement of the intermolecular forces between counterion-condensed DNA double helices: evidence for long range attractive hydration forces. Biophys. J. 1992;61(1):246–259. doi: 10.1016/S0006-3495(92)81831-3. [DOI] [PMC free article] [PubMed] [Google Scholar]
- 29.Rau DC, Persegian VA. Direct measurement of temperature-dependent solvation forces between DNA double helices. Biophys. J. 1992;61(1):260–271. doi: 10.1016/S0006-3495(92)81832-5. [DOI] [PMC free article] [PubMed] [Google Scholar]
- 30.Kwok LW, Qiu X, Park HY, Lamb JS, Adresen K, Pollack L. Measuring inter-DNA potentials in solution. Phys. Rev. Lett. 2006;96138101(1–4) doi: 10.1103/PhysRevLett.96.138101. [DOI] [PubMed] [Google Scholar]
- 31.Ha B-Y, Liu AJ. Charge oscillations and many-body effects in bundles of like-charged rods. Phys Rev. E. 1998;58(5):6281–6286. [Google Scholar]
- 32.Ha B-Y, Liu AJ. Counterion-mediated, non-pairwise-additive attractions in bundles of like-charged rods. Phys Rev. E. 1999;60(1):803–813. doi: 10.1103/physreve.60.803. [DOI] [PubMed] [Google Scholar]
- 33.Lyubartsev AP, Martsinovski AA, Shevkunov SV, Vorontsov-Velyamino PN. New approach to Monte Carlo calculation of the free energy: Method of expanded ensembles. J. Chem. Phys. 1992;96:1776–1783. [Google Scholar]
- 34.Wilding NB, Müller M. Accurate measurements of the chemical potential of polymeric systems by Monte Carlo. J. Chem. Phys. 1994;101:4324–4330. [Google Scholar]
- 35.Escobedo FA, de Pablo JJ. Monte Carlo simulation of the chemical potential of polymers in an expanded ensemble. J. Chem. Phys. 1995;103:2703–2710. [Google Scholar]
- 36.Escobedo FA, de Pablo JJ. Expanded grand canonical and Gibbs ensemble Monte Carlo simulation of polymers. J. Chem. Phys. 1996;105:4391–4394. [Google Scholar]
- 37.de Pablo JJ, Yan Q, Escobedo FA. Simulation of phase transitions in fluids. Annu. Rev. Phys. Chem. 1999;50:377–411. doi: 10.1146/annurev.physchem.50.1.377. [DOI] [PubMed] [Google Scholar]
- 38.Shulz BJ, Binder K, Müller M, Landau DP. Avoiding boundary effects in Wang-Landau sampling. Phys. Rev. E. 2003;67(6) doi: 10.1103/PhysRevE.67.067102. 067102(1–2) [DOI] [PubMed] [Google Scholar]
- 39.Rathore N, Knotts TA, IV, de Pablo JJ. Density of states simulations of proteins. J. Chem. Phys. 2003;118(9):4285–4290. doi: 10.1016/S0006-3495(03)74810-3. [DOI] [PMC free article] [PubMed] [Google Scholar]
- 40.Rathore N, de Pablo JJ. Monte Carlo simulation of proteins through a random walk in energy space. J. Chem. Phys. 2002;116(16):7225–7230. [Google Scholar]
- 41.Roux B. The calculation of the potential of mean force using computer simulations. Comput. Phys. Commun. 1995;91:275–282. [Google Scholar]
- 42.Souaille M, Roux B. Extension to the Weighted Histogram Analysis Method: Combining umbrella sampling with free energy calculations. Comput. Phys. Commun. 2001;135:40–57. [Google Scholar]
- 43.Ferrenberg AM, Swendsen RH. New Monte Carlo technique for studying phase transitions. Phys. Rev. Lett. 1988;61(23):2635–2638. doi: 10.1103/PhysRevLett.61.2635. [DOI] [PubMed] [Google Scholar]
- 44.Chopra M, Müller M, de Pablo JJ. Order-parameter-based Monte Carlo simulation of crystallization. J. Chem. Phys. 2006;124(13) doi: 10.1063/1.2178324. 134105(1–8) [DOI] [PubMed] [Google Scholar]
- 45.Bolhuis PG, Chandler D, Dellago C, Geissler PL. Transition Path Sampling: Throwing ropes over rough mountain passes, in the dark. Annu. Rev. Phys. Chem. 2002;53:291–318. doi: 10.1146/annurev.physchem.53.082301.113146. [DOI] [PubMed] [Google Scholar]
- 46.Dellago C, Bolhuis PG, Geissler PL. Transition Path Sampling. Adv. Chem. Phys. 2002;123:1–78. doi: 10.1146/annurev.physchem.53.082301.113146. [DOI] [PubMed] [Google Scholar]
- 47.Owczarzy R, You Y, Moreira BG, Manthey JA, Huang L, Behlke MA, Walder JA. Effects of sodium ions on DNA duplex oligomers: improved predictions of melting temperatures. Biochemistry. 2004;43(12):3537–3554. doi: 10.1021/bi034621r. [DOI] [PubMed] [Google Scholar]
- 48. http://www.idtdna.com/analyzer/Applications/OligoAnalyzer.
- 49.Garel T, Monthus C, Orland H. A simple model for DNA denaturation. Eurphys. Lett. 2001;55(1):132–138. [Google Scholar]
- 50.Carlon E, Orlandini E, Stella AL. Role of stiffness and excluded volume in DNA denaturation. Phys. Rev. Lett. 2002;88(19) doi: 10.1103/PhysRevLett.88.198101. 198101(1–4) [DOI] [PubMed] [Google Scholar]
- 51.Kafri Y, Mukamel D, Peliti L. Why is the DNA denaturation transition first-order? Phys. Rev. Lett. 2000;85:4988–4991. doi: 10.1103/PhysRevLett.85.4988. [DOI] [PubMed] [Google Scholar]
- 52.Holbrook JA, Capp MW, Saecker RM, Record MT., Jr Enthalpy and heat capacity changes for formation of an oligomeric DNA duplex: Interpretation in terms of coupled processes of formation and association of single-stranded helices. Biochemistry. 1999;38:8409. doi: 10.1021/bi990043w. [DOI] [PubMed] [Google Scholar]
- 53.Owczarzy R, Vallone PM, Gallo FJ, Paner TM, Lane MJ, Benight AS. Predicting sequence-dependent melting stability of short duplex DNA oligomers. Biopolymers. 1997;44(3):217–239. doi: 10.1002/(SICI)1097-0282(1997)44:3<217::AID-BIP3>3.0.CO;2-Y. [DOI] [PubMed] [Google Scholar]
- 54.Goldar A, Sikorav J-L. DNA renaturation at the water-phenol interface. Eur. Phys. J. E Soft Matter. 2004;14(33):211–239. doi: 10.1140/epje/i2004-10011-7. [DOI] [PubMed] [Google Scholar]
- 55.Stogryn A. Equations for calculating the dielectric constant of saline water. IEEE Trans. Microw. Theory Tech. 1971;19(8):733–736. [Google Scholar]


