

Abstract
Interleukin-1 (IL-1), an inflammatory cytokine overexpressed in the neuritic plaques of Alzheimer’s disease, activates astrocytes and enhances production and processing of (β-amyloid precursor protein (β-APP). Activated astrocytes, overexpressing S100β, are a prominent feature of these neuritic plaques, and the neurite growth-promoting properties of S100β have been implicated in the formation of dystrophic neurites overexpressing β-APP in neuritic plaques. These facts collectively suggest that elevated levels of the inflammatory cytokine IL-1 drive S100β and β-APP overexpression and dystrophic neurite formation in Alzheimer’s disease. To more directly assess this driver potential for IL-1, we analyzed IL-1 induction of S100β expression in vivo and in vitro, and of β-APP expression in vivo. Synthetic IL-1β was injected into the right cerebral hemispheres of 13 rats. Nine additional rats were injected with phosphate-buffered saline, and seven rats served as uninjected controls. The number of astrocytes expressing detectable levels of S100β in tissue sections from IL-1–injected brains was 1.5 fold that of either control group (p < 0.01), while tissue S100β levels were approximately threefold that of controls (p < 0.05). The tissue levels of two β-APP isoforms (approximately 130 and 135 kDa) were also significantly elevated in IL-1–injected brains (p < 0.05). C6 glioma cells, treated in vitro for 24 h with either IL-1β or IL-1α, showed significant increases in both S100β and S100β mRNA levels. These results provide evidence that IL-1 upregulates both S100β and β-APP expression, in vivo and in vitro, and support the idea that overexpression of IL-1 in Alzheimer’s disease drives astrocytic overexpression of S100β, favoring the growth of dystrophic neurites necessary for evolution of diffuse amyloid deposits into neuritic β-amyloid plaques.
Keywords: Interleukin-1, S100β, β-Amyloid precursor protein, Alzheimer’s disease, Down’s syndrome, Rats, C6 glioma cells
The global intellectual decline of Alzheimer’s disease is accompanied by a profusion of microscopic brain lesions that contain extracellular fibrillar material in a β-pleated sheet conformation (β-amyloid), abnormal neuronal processes (“dystrophic” neurites) overexpressing β-amyloid precursor protein (β-APP), and activated glia (astrocytes and microglia). The possible interactions of these plaque-associated astrocytes and microglia, their armamentarium of overexpressed cytokines and other molecules, and the known actions of these cytokines and molecules bear sufficient parallels to chronic, focal inflammatory processes found outside the nervous system to suggest that the basic driving pathophysiological mechanism in Alzheimer’s disease is fundamentally an inflammatory one (21).
The plaques of Alzheimer’s disease are thought to originate as diffuse deposits of nonpleated amyloid protein (‘diffuse nonneuritic’ plaques) that progress to more classic ‘diffuse neuritic’ plaques (commonly referred to as immature plaques) composed of β-pleated amyloid intermixed with diffuse amyloid and dystrophic neurites (24). Further amyloid condensation results in formation of a central compact core of amyloid within the larger deposit, yielding a ‘dense core neuritic’ (or mature) plaque. Brains of Alzheimer patients also contain compact deposits of β-amyloid without associated diffuse amyloid and without neuritic elements. These ‘dense core, nonneuritic’ (burned out) plaques are thought to represent an end stage of plaque evolution.
The pathophysiological mechanisms driving plaque evolution, and presumably driving the clinical progression of the disease as well, have only recently begun to be understood. Each stage in the plaque evolution cited above has a distinct and characteristic profile of associated activated microglia overexpressing the inflammatory response cytokine interleukin-1 (IL-1), as detected using anti-IL-1α antibodies, which recognize the intracellular isoform of IL-1α (15). These microglia are present in diffuse amyloid deposits (which are devoid of the β-APP+ neurites characteristic of neuritic plaques), are abundant in neuritic plaques, and are absent in burned out plaques. Moreover, the pattern of microglial IL-1α immunoreactivity across brain regions in Alzheimer’s disease mirrors the regional distribution of these β-APP+ neuritic plaques (29). Microglia-derived IL-1 may thus be a driving force contributing to astrocytic actions and reactions occurring within the evolving amyloid plaques of Alzheimer’s disease.
IL-1 exists as two isoforms, α and β, that are similar in their cellular origins, regulatory patterns, and effects (22). IL-1 has been shown in vitro, but not in vivo, to upregulate expression (11,13) and processing (7) of β-APP. IL-1 also activates astrocytes (12), another integral cellular element in β-amyloid plaques. The activated astrocytes associated with the neuritic plaques of Alzheimer’s disease overexpress a neurotrophic cytokine, S100β (16). The neurite growth-promoting properties of S100β (18), the proximity of activated astrocytes overexpressing biologically active S100β to the dystrophic neurites in neuritic plaques (19,28), and the correlation between the density of S100β-immunoreactive (S100β+) astrocytes and neuritic plaques in cerebral regions in Alzheimer’s disease (32) implicates this cytokine in the growth of dystrophic neurites in β-amyloid plaques. However, the in vivo stimulus that effects this increased expression of S100β and β-APP in Alzheimer’s disease remains to be identified. The close association of IL-1α+ microglia and S100β+ astrocytes in neuritic plaques, together with known IL-1 functions, suggest that IL-1 may be the in vivo stimulus that induces astrocytic overexpression of S100β.
In this study, we directly tested this possibility both in vivo and in vitro. We also show, for the first time, IL-1–induced overexpression of β-APP in vivo. In vivo, IL-1 upregulation of tissue S100β and β-APP levels was examined in rat brain following intracerebral injection of IL-1β. In vitro, IL-1β upregulation of S100β and S100β mRNA was assessed in C6 glioma cells.
METHOD
Animal Preparation and IL-1 Treatment In Vivo
Twenty-nine Sprague-Dawley rats, weighing 300–400 g each, were randomly divided into three groups. Thirteen rats (five for immunohistochemical analysis and eight for Western immunoblot analysis) received intracerebral injections of synthetic IL-1β (the cleaved active isoform; Cistron, Pine Brook, NH). As controls, nine rats (three for immunohistochemical analysis and six for Western immunoblot analysis) received intracerebral injections of phosphate-buffered saline (PBS, the IL-1 vehicle; “PBS-injected controls”) and seven rats (three for immunohistochemical analysis and four for Western immunoblot analysis) received no injections (“uninjected controls”).
Rats were anesthetized with ketamine and xylazine and placed in a stereotaxic frame. A hole was drilled in the skull at a point 3.6 mm caudal to the bregma, 1.6 mm lateral to the midline. A 5-μl Hamilton syringe equipped with a 15 μm-diameter glass micropipette was used to make injections 1.5 mm deep to the dorsal cerebral surface. Injected rats received either 2 μl of synthetic IL-1β (2 U) in PBS or 2 μl of PBS alone. After removal of the needle, Gelfoam (Upjohn, Kalamazoo, MI) was placed over the hole, and the scalp was closed. Three days later, an overdose of sodium pentobarbital was administered and brains were processed either for immunohistochemistry or for Western immunoblot analysis as described below.
Brain Tissue Processing
Brains for immunohistochemistry were perfused with 200 ml PBS followed by 200 ml of 4% paraformaldehyde. Tissue blocks were then embedded in paraffin and sectioned at a thickness of 10 μm. Tissue sections were permeabilized with 0.2 N HCl, blocked for nonspecific antibody binding and for endogenous peroxidase, and then incubated with S100β antibody diluted 1:2000 in 2% normal goat serum and processed according to our previously reported peroxidase/diaminobenzidine methods (17). Sections from IL-1β–injected, PBS-injected, and uninjected rats were processed together to ensure uniformity of immunoreaction. S100β+ cells were counted at a magnification of 250 diameters in five microscopic fields (each field = 0.4 mm2) in dorsal cortex immediately adjacent to the injection site in each animal.
For Western immunoblot analysis, injected hemispheres (or analogous hemispheres from uninjected controls) were divided into three coronal sections. The section containing the injection site was homogenized and processed to obtain supernatant samples for determination of S100β and β-APP, as previously described (17,27).
IL-1 Treatment In Vitro and Cell Culture Preparation and Processing
C6 rat glioma cells (American Type Culture Collection, Rock-ville, MD) were seeded at 3 × 10⁶ cells in 75 ml filter-cap flasks (CoStar, Cambridge, MA), each with 25 ml of media containing Minimal Essential Medium (MEM, Gibco, Grand Island, NY), pH 7.4; 15% equine serum, and 2.5% fetal bovine serum (FBS, Hyclone Laboratories, Inc., Logan, UT). Cells were allowed to reach subconfluency (3 days), and were then treated in triplicate with 25 ml fresh media with or without IL-1β (1 U/ml) for 1, 6, and 24 h. Triplicate sets of subconfluent sister cultures were treated for 24 h with IL-1β or IL-1α (1 U/ml). After treatment, the cells were trypsinized, pelleted at 1,000 × g for 10 min, at 4°C, and counted. Cellular extracts for S100β protein analysis were prepared from triplicate preparations of rinsed cell pellets (107 cells/100 μl PBS), which were then frozen, thawed on ice, and sonicated (six pulses). Supernatants from 16,000 × g (5 min, at 4°C) centrifugation were analyzed for total protein as previously described (17). Relative levels of S100β were determined by Western immunoblot analysis as previously described (17).
Rinsed cells (107) from parallel triplicate preparations were pelleted twice at 1,000 × g (10 min, at 4°C). TriReagent™ RNA extraction reagent (Molecular Research Center, Inc., Cincinnati, OH) was added to each preparation for assay of S100β mRNA by Northern blot hybridization as described below.
Western Immunoblot Procedures and Analysis
A specific S100β antibody (32) that recognizes monomeric and dimeric S100β was used. This antibody is now commercially available from East Acres Biologicals (Southbridge, MA) and SWant (Bellinzona, Switzerland). Monoclonal anti-β-APP antibody (clone 22C11), which recognizes 120–135 kDa β-APP isoforms in human brain (27), was obtained from Boehringer–Mannheim Biochemica (Indianapolis, IN). Polyclonal antiglial fibrillary acidic protein antibody (GFAP; Dako, Carpinteria, CA) was used for Western immunoblot analysis.
Western immunoblot analyses of S100β, GFAP (28), and of β-APP were performed as previously described (17). Briefly, nitrocellulose immunoblots were incubated overnight in 10 ml of 10% nonfat dry milk, with 0.01% sodium azide, containing either β-APP antibody at a 1:100 dilution or S100β antibody at a 1:500 dilution, and for 1 h with either 5 μCi of 125I-labeled goat anti-rabbit (for S100β and GFAP) or goat antimouse (for β-APP) IgG. Washing was as previously described (17). Immunoblots were exposed overnight to Kodak XAR film. The optical density (OD) of immunoreactive bands was measured as previously described (28) to estimate the levels of immunoreactive S100β, β-APP, and GFAP in tissue samples.
Micro In Situ and Northern Hybridization Analyses of S100β mRNA
Micro in situ hybridization analysis of the relative levels of S100β mRNA in C6 glioma cells was performed as previously described (34). Briefly, cells were seeded at 20,000 cells/200 μl media (MEM, containing 15% equine serum and 2.5% FBS) in wells of microtiter well strips (Corning, NY) and treated with media alone, or media containing 1 U/ml of IL-1β for 1, 4, 6, and 24 h. After rinsing twice with PBS, cells were fixed and permeabilized, dehydrated in ethanol as previously described (34), and incubated overnight at 44°C with 2 × 10⁵ cpm/50 μl of denatured rat 32P-labeled S100β cDNA [pSB-1, generously donated by Dr. Alexander Marks, Toronto; (10)], and then washed with 0.2× SSC (1.8 g NaCl, 0.9 g sodium citrate/l, pH 7) containing 0.25% sodium dodecyl sulfate (SDS), at 47°C for 10 min. To estimate total polyadenylated mRNA in each well, cells were incubated with 2 × 10⁵ cpm/50 μl of 3H polyuridylate (NEN Research Products, Boston, MA) in 4× SSC and processed as previously described (34). For assessment of radioactive labeling and estimation of relative S100β mRNA levels, individual wells were placed in vials with 3 ml scintillation cocktail (Biosafe II, Research Products International, Mount Prospect, IL) and counted in a Beckman LS 7000 scintillation counter.
For Northern blot analysis, total RNA was extracted from approximately 107 cells, using 3 ml TriReagent™ RNA isolation reagent according to the manufacturer’s instructions, and RNA samples were processed using modifications of published protocols (25). Briefly, equal amounts of total RNA (5 μg) from each sample were subjected to electrophoresis on a 1.2% agarose, 5% formaldehyde gel, and then transferred to GeneScreen+™ membrane (NEN Research Products, Doraville, GA) by capillary action with 10× SSC for 12 h. The membrane was baked at 80°C for 2 h, prehybridized with 50% formamide containing 1% SDS, 1 M NaCl, 10% dextran sulfate, 0.2 mg/ml salmon sperm DNA, and 50 mM Tris-HCl, pH 7.5, for 4 h at 42°C, and then hybridized for 24 h, at 42°C, with 100 ng 32P-labeled rat S100β cDNA (1 × 10⁹ cpm/μg DNA, labeled by using a random-primed DNA labeling kit, Boehringer–Mannheim, Indianapolis, IN). Membranes were then washed twice with 2× SSC, containing 1% SDS, at 65°C for 20 min and exposed to Kodak XAR film. The density of bands was measured at 560 nm using a computer-assisted analysis package on a Beckman DU-62 spectrophotometer.
Statistical Analysis
Differences between data from the three rat groups, and between treated and untreated cell cultures, were assessed for statistical significance using Student’s t-test.
RESULTS
IL-1 Upregulation of S100β In Vivo
Immunohistochemical analysis showed prominent S100β+ astrocytes in IL-1β–injected rat brains (Fig. 1). Relative to their smaller counterparts in controls, many S100β+ astrocytes were identified as activated (9) with enlarged somas, prominent processes, and euchromatic nuclei. These S100β+ cells were more intensely immunoreactive (Fig. 1) and were more numerous in IL-1β–injected brains: 50% more numerous than in PBS-injected and 70% more numerous than in uninjected brains (Fig. 2; p < 0.05 in each case). Western immunoblot analyses (examples shown in Fig. 3) showed a clear increase in S100β levels in IL-1β– injected brain compared with PBS-injected controls (uninjected not shown). Densitometric analysis showed the S100β+ bands from IL-1β–injected brains to be approximately threefold as dense than those from PBS-injected or uninjected controls (Table 1; p < 0.001 for each comparison).
FIG. 1.
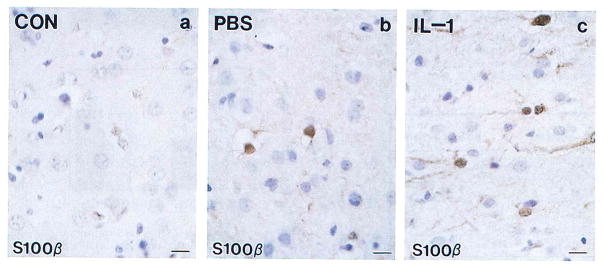
S100β-immunoreactivity (S100β+) in tissue sections of rat cerebrum showing increases in number, size, and immunoreactive intensity of S100β+ astrocytes (brown) in IL-1β–injected animals. As illustrated here, some S100β+ astrocytes could also be found in PBS-injected animals, but the number of these cells was not significantly different from controls (see Fig. 2). (A) Uninjected control rat; (B) PBS-injected rat; (C) IL-1β–injected rat. Bars = 15 μm.
FIG. 2.

Numbers of S100β-immunoreactive cells in five separate 250-diameter fields in brains from five IL-1β–injected; three PBS-injected, and three uninjected control rats.
FIG. 3.
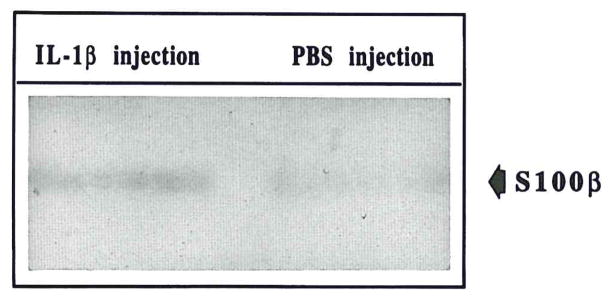
Examples of Western immunoblot showing increased expression of S100β in tissue extracts from IL-1β–injected (IL-1β–injection) brain compared to PBS-injected (PBS injection) brain. Results from three IL-1β–injected and three PBS-injected animals are shown.
TABLE 1.
DENSITIES OF IMMUNOREACTIVE S100β PROTEIN BANDS IN WESTERN IMMUNOBLOTS FROM IL-1β-INJECTED, PBS-INJECTED AND UNINJECTED RAT CEREBRAL HEMISPHERES
| Group | n | S100β |
|---|---|---|
| No injection | 4 | 0.07 ± 0.01 |
| PBS injection | 6 | 0.07 ± 0.01 |
| IL-1β injection | 8 | 0.19 ± 0.01* |
n = number of animals. Values expressed as optical density units of scanned immunoblotted gels (mean ± SEM).
Value is significantly different from that of either PBS-injected or uninjected control animals (p < 0.001).
IL-1 Upregulation of S100β and S100β mRNA In Vitro
Examples of Northern and Western blots of S100β mRNA and S100β in C6 glioma cells, treated for 24 h in vitro with IL-1β or IL-1α, are shown in Fig. 4A and B. S100β mRNA was significantly elevated following 24 h of IL-1β treatment (p < 0.002) or IL-1α treatment (p < 0.02). As shown in Fig. 4B and C, cellular S100β levels were also elevated following 24 h of treatment with either IL-1β or IL-1α (p < 0.002 in each case). In contrast, neither IL-1β nor IL-1α treatment altered the levels of the astrocyte intermediate filament protein, GFAP (Fig. 4B). The levels of ribosomal (28S + 18S) RNA were similar in control and treated cells (0.6 ± 0.05 and 0.7 ± 0.04 OD/μg total RNA). Micro in situ hybridization analysis confirmed a doubling of S100β mRNA levels after 24 h of IL-1β treatment (13,000 ± 1,900 cpm vs. 6,500 ± 800 in PBS-treated cultures, for three microwells at each time point; p < 0.05; Fig. 5). The levels of polyadenylated RNA were similar in these IL-1β-treated and PBS-treated C6 cells.
FIG. 4.

IL-1 upregulation of S100β and S100β mRNA in C6 glioma cells in vitro. (A) Northern hybridization blots showing S100β mRNA with corresponding 28S and 18S levels from IL-1β–treated (β), IL-1α–treated (α), and untreated (C) cells. (B) Western immunoblot probed with anti-S100β and anti-GFAP antibodies showing results from IL-1β–treated (β), IL-1α–treated (α), and untreated (C) cells. (C) S100β and S100β mRNA levels in IL-1β–treated, IL-1α–treated, and untreated (control) C6 glioma cells. *p = 0.02; **p < 0.002 compared to control values.
FIG. 5.
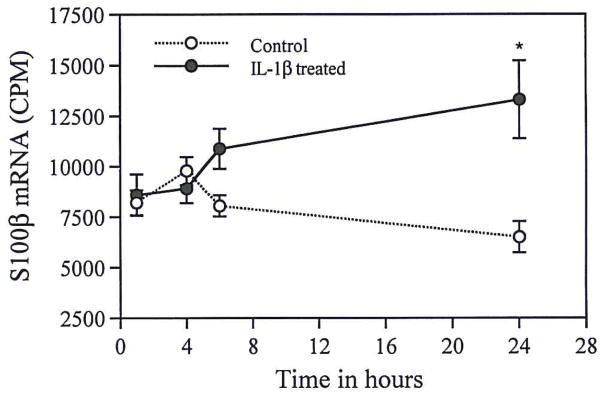
S100β mRNA levels (radioactive counts per min, CPM) in IL-1β–treated C6 glioma cells analyzed using micro in situ hybridization. There is a significant increase in S100β mRNA following 24 h of IL-1β treatment (*p < 0.05).
IL-1 Upregulation of β-APP In Vivo
Western immunoblot analysis showed clear increases in two distinct β-APP+ bands (molecular weights of 130 and 135 kDa) in IL-1β-injected brains (examples shown in Fig. 6). The densities in supernatants from IL-1β–injected rats were significantly elevated, relative to the two control groups (p < 0.05 in each case), which did not differ from each other (Table 2).
FIG. 6.
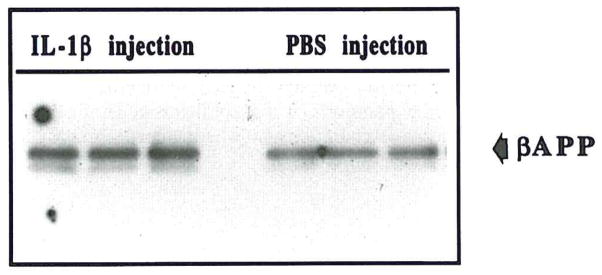
Example of Western immunoblot of two β-APP–immunoreactive bands, at 130 kDa and 135 kDa, showing increased expression of both β-APP isoforms in IL-1β–injected brain (IL-1β injection) compared to PBS-injected (PBS-injection) brain. Results from three IL-1β–injected and three PBS-injected animals are shown.
TABLE 2.
DENSITIES OF IMMUNOREACTIVE β-AMYLOID PRECURSOR PROTEIN (β-APP) BANDS IN WESTERN IMMUNOBLOTS FROM IL-1β-INJECTED, PBS-INJECTED, AND UNINJECTED RAT CEREBRAL HEMISPHERES
| Group | n | β-APP (130 kDa) | β-APP (135 kDa) |
|---|---|---|---|
| No injection | 4 | 0.08 ± 0.01 | 0.44 ± 0.22 |
| PBS injection | 6 | 0.12 ± 0.02 | 0.57 ± 0.10 |
| IL-1β injection | 8 | 0.22 ± 0.03* | 0.80 ± 0.04* |
n = number of animals. Values expressed as optical density units of scanned immunoblotted gels (mean ± SEM).
Value is significantly different from that of either PBS-injected or uninjected control animals (p < 0.05).
DISCUSSION
We find IL-1β upregulation of S100β in vivo and in vitro, and IL-1α upregulation of S100β in vitro. In addition, we show IL-1β upregulation of β-APP in vivo. This suggests that the overexpression of IL-1 in Alzheimer’s disease is causally related to the concomitant astrocyte overexpression of S100β (16, 19, 28) as well as to the neuritic overexpression of β-APP early in Alzheimer’s disease (23). IL-1–induced excessive expression of S100β may be the result of a direct effect of IL-1, as IL-1 receptors are present on astrocytes (4), or an indirect effect, as IL-1 is known to stimulate astrocyte activation (12). In either case, the increase in the levels of S100β above the increase in the number of S100β+ astrocytes, indicates that individual S100β+ astrocytes contain more S100β as a result of exposure to increased levels of IL-1β.
Our finding of IL-1β upregulation of β-APP expression in vivo supports the idea that the overexpression of IL-1α (15) and IL-1β (8) in Alzheimer’s disease induces excessive synthesis and processing of β-APP. Such IL-1–induced excessive synthesis (11, 13) and processing (7) would generate β-APP fragments, some of which are neurotrophic (2,20,26). These neurotrophic β-APP fragments could stimulate further neurite growth with consequent further demand for synthesis of β-APP. In addition, IL-1–induced upregulation of S100β could indirectly promote increased β-APP expression through the known neurotrophic and neurite extension-promoting properties of S100β (5, 18). The resultant neurite growth would similarly demand production of more β-APP as a component of new neurite membrane formation. Thus, IL-1, via direct or indirect effects, may influence the growth of neurites and the concomitant increase in β-APP synthesis through either the actions of S100β or neurotrophic fragments of β-APP. Therefore, IL-1 provides a plausible molecular introduction to a pathogenic sequence (15) involved both in the formation of dystrophic neurites and in further amyloid deposition, and, thus, in the evolution of amyloid deposits into neuritic β-amyloid–containing plaques.
The finding of upregulation of S100β and β-APP by IL-1 may also explain the greater-than-1.5-fold elevation in the expression of these two chromosome 21 gene products (1, 14,30) in Down’s syndrome (3,30), as IL-1, which is not a chromosome 21 gene product (6), is known to be overexpressed early in Down’s syndrome (16). In view of the interactions between these proteins, shown here, and their potential importance in the pathogenesis of neuritic plaques in Alzheimer’s disease (15, 19, 28), we suggest that IL-1 induction of S100β and β-APP may explain, in part, the precocious appearance (33) of neuritic plaques at middle age in patients with Down’s syndrome.
In summary, this first demonstration of an effect of IL-1 on S100β and β-APP expression in vivo provides experimental confirmation of an important link in a proposed pathogenic sequence underlying the progression of lesions in Alzheimer’s disease. It is also key evidence for the idea (21,31) that elevated levels of IL-1 in Alzheimer’s disease and in Down’s syndrome are of seminal pathogenic import in the development of the neuropathological changes that characterize these two disorders. In addition, this demonstration supports our original suggestion (16) that IL-1 up-regulation of S100β expression is a concept that is generalizable to other neurodegenerative conditions in which there is microglial activation with IL-1 overproduction.
Acknowledgments
This work was supported in part by NIH Grants AG10208 (to W.S.T.G., L.J.V.E., and R.E.M.), AG12411 (to W.S.TG. and R.E.M.) and NS27414 (to W.ST.G.). The authors wish to thank Drs. Laura Stanley, John Wu, and Tim Wall for their assistance with experiments, Dr. Gareth Roberts for helpful advice on the manuscript, and Ms. Pam Free for secretarial support.
References
- 1.Allore R, O’Hanlon D, Price R, Neilson K, Willard HF, Cox DR, Marks A, Dunn RJ. Gene encoding the β subunit of S100 protein is on chromosome 21: Implications for Down syndrome. Science. 1988;239:1311–1313. doi: 10.1126/science.2964086. [DOI] [PubMed] [Google Scholar]
- 2.Araki W, Kitaguchi N, Tokushima Y, Ishii K, Aratake H, Shimohama S, Nakamura S, Kimura J. Trophic effect of β-amyloid precursor protein on cerebral cortical neurons in culture. Biochem Biophys Res Commun. 1991;181:265–271. doi: 10.1016/s0006-291x(05)81412-3. [DOI] [PubMed] [Google Scholar]
- 3.Baggott PJ, Sheng JG, Cork L, Del Bigio MR, Brumback RA, Roberts GW, Mrak RE, Griffin WST. Expression of Alzheimer’s disease (AD)-related proteins during development in Down’s syndrome. Neurosci Soc Abstr. 1993;19:182. [Google Scholar]
- 4.Ban EM, Sarlieve LL, Haour FG. Interleukin-1 binding sites on astrocytes. Neuroscience. 1993;52:725–733. doi: 10.1016/0306-4522(93)90421-b. [DOI] [PubMed] [Google Scholar]
- 5.Bhattacharyya A, Oppenheim RW, Prevette D, Moore BW, Brackenbury X, Rattner N. S100 is present in developing chicken neurons and Schwann cells and promotes neuron survival in vivo. J Neurobiol. 1992;23:451–466. doi: 10.1002/neu.480230410. [DOI] [PubMed] [Google Scholar]
- 6.Boultwood J, Breckon G, Birch D, Cox R. Chromosomal localization of murine interleukin-1 alpha and beta genes. Genomics. 1989;5:481–485. doi: 10.1016/0888-7543(89)90013-x. [DOI] [PubMed] [Google Scholar]
- 7.Buxbaum JD, Oishi M, Chen HI, Pinkas-Kramarski R, Jaffe EA, Gandy SE, Greengard P. Cholinergic agonists and interleukin 1 regulate processing and secretion of the Alzheimer α/A4 amyloid protein precursor. Proc Natl Acad Sci USA. 1992;89:10075–10078. doi: 10.1073/pnas.89.21.10075. [DOI] [PMC free article] [PubMed] [Google Scholar]
- 8.Cacabelos R, Alvarez XA, Fernandez-Novoa L, Franco A, Mangues R, Pellicer A, Nishimura T. Brain interleukin-1 beta in Alzheimer’s disease and vascular dementia. Methods Find Exp Clin Pharmacol. 1994;16:141–151. [PubMed] [Google Scholar]
- 9.da Cunha A, Jefferson JJ, Tyor WR, Glass JD, Jannotta FS, Vitkovic L. Gliosis in human brain: Relationship to size but not other properties of astrocytes. Brain Res. 1993;600:161–165. doi: 10.1016/0006-8993(93)90415-j. [DOI] [PubMed] [Google Scholar]
- 10.Dunn R, Landry C, O’Hanlon D, Dunn J, Allore R, Brown I, Marks A. Reduction in S100 protein beta subunit mRNA in C6 glioma cells following treatment with anti-microtubular drugs. J Biol Chem. 1987;262:3562–3566. [PubMed] [Google Scholar]
- 11.Forloni G, Demicheli F, Giorgi S, Bendotti C, Angeretti N. Expression of amyloid precursor protein mRNAs in endothelial, neuronal and glial cells: Modulation by interleukin-1. Mol Brain Res. 1992;16:128–134. doi: 10.1016/0169-328x(92)90202-m. [DOI] [PubMed] [Google Scholar]
- 12.Giulian D, Woodward J, Young DG, Krebs JF, Lachman LB. Interleukin-1 injected into mammalian brain stimulates astrogliosis and neovascularization. J Neurosci. 1988;8:2485–2490. doi: 10.1523/JNEUROSCI.08-07-02485.1988. [DOI] [PMC free article] [PubMed] [Google Scholar]
- 13.Goldgaber D, Harris HW, Hla T, Maciag T, Donnelly RJ, Jacobsen JS, Vitek MP, Gajdusek DC. Interleukin 1 regulates synthesis of amyloid beta-protein precursor mRNA in human endothelial cells. Proc Natl Acad Sci USA. 1989;86:7606–7610. doi: 10.1073/pnas.86.19.7606. [DOI] [PMC free article] [PubMed] [Google Scholar]
- 14.Goldgaber D, Lerman M, McBride W, Saffioti U, Gajdusek DC. Characterization and chromosomal localization of cDNA encoding brain amyloid of Alzheimer’s disease. Science. 1987;235:877–880. doi: 10.1126/science.3810169. [DOI] [PubMed] [Google Scholar]
- 15.Griffin WST, Sheng JG, Roberts GW, Mrak RE. Interleukin-1 expression in different plaque types in Alzheimer’s disease: Significance in plaque evolution. J Neuropathol Exp Neurol. 1995;54:276–281. doi: 10.1097/00005072-199503000-00014. [DOI] [PubMed] [Google Scholar]
- 16.Griffin WST, Stanley LC, Ling C, White L, Macleod V, Perrot L, White CL, III, Araoz C. Brain interleukin 1 and S100 immunoreactivity are elevated in Alzheimer disease and in Down syndrome. Proc Natl Acad Sci USA. 1989;86:7611–7615. doi: 10.1073/pnas.86.19.7611. [DOI] [PMC free article] [PubMed] [Google Scholar]
- 17.Griffin WST, Stanley LC, Yeralan O, Rovnaghi CR, Marshak DR. Methods for the study of cytokines in human neurodegenerative disease. Methods Neurosci. 1993;17:268–287. [Google Scholar]
- 18.Marshak DR. S100β as a neurotrophic factor. Prog Brain Res. 1990;86:169–181. [PubMed] [Google Scholar]
- 19.Marshak DR, Pesce SA, Stanley LC, Griffin WST. Increased S100β neurotrophic activity in Alzheimer disease temporal lobe. Neurobiol Aging. 1991;13:1–7. doi: 10.1016/0197-4580(92)90002-f. [DOI] [PubMed] [Google Scholar]
- 20.Milward EA, Papadopoulos R, Fuller SJ, Moir RD, Small D, Beyreuther K, Masters CL. The amyloid protein precursor of Alzheimer’s disease is a mediator of the effects of nerve growth factor on neurite outgrowth. Neuron. 1992;9:129–137. doi: 10.1016/0896-6273(92)90228-6. [DOI] [PubMed] [Google Scholar]
- 21.Mrak RE, Sheng JG, Griffin WST. Glial cytokines in Alzheimer’s disease. Review and pathogenic implications. Hum Pathol. 1995;26:816–823. doi: 10.1016/0046-8177(95)90001-2. [DOI] [PMC free article] [PubMed] [Google Scholar]
- 22.Rothwell NJ. Functions and mechanisms of interleukin 1 in the brain. Trends Pharmacol Sci. 1991;12:430–436. doi: 10.1016/0165-6147(91)90623-z. [DOI] [PubMed] [Google Scholar]
- 23.Royston MC, Rothwell NJ, Roberts GW. Alzheimer’s disease: Pathology to potential treatment? Trends Pharmacol Sci. 1992;13:131–133. doi: 10.1016/0165-6147(92)90047-a. [DOI] [PubMed] [Google Scholar]
- 24.Rozemuller JM, Eikelenboom P, Stam FC, Beyreuther K, Masters CL. A4 protein in Alzheimer’s disease: Primary and secondary cellular events in extracellular amyloid deposition. J Neuropathol Exp Neurol. 1989;48:674–691. doi: 10.1097/00005072-198911000-00009. [DOI] [PubMed] [Google Scholar]
- 25.Sambrook J, Fritsch EF, Maniatus T. Molecular cloning: A laboratory manual. 2. Vol. 2. Cold Spring Harbor, NY: Cold Spring Harbor Press; 1989. pp. 7.39–7.52. [Google Scholar]
- 26.Schubert D, Jin LW, Saitoh T, Cole G. The regulation of amyloid β protein precursor secretion and its modulatory role in cell adhesion. Neuron. 1989;3:689–694. doi: 10.1016/0896-6273(89)90237-7. [DOI] [PubMed] [Google Scholar]
- 27.Sheng JG, Boop FA, Mrak RE, Griffin WST. Increased neuronal beta-amyloid precursor protein expression in human temporal lobe epilepsy: Association with interleukin-1 alpha immunoreactivity. J Neurochem. 1994;63:1872–1879. doi: 10.1046/j.1471-4159.1994.63051872.x. [DOI] [PMC free article] [PubMed] [Google Scholar]
- 28.Sheng JG, Mrak RE, Griffin WST. S100β protein expression in Alzheimer’s disease: Potential role in the pathogenesis of neuritic plaques. J Neurosci Res. 1994;39:398–404. doi: 10.1002/jnr.490390406. [DOI] [PubMed] [Google Scholar]
- 29.Sheng JG, Mrak RE, Griffin WST. Interleukin-1α expression in brain regions in Alzheimer’s disease: Correlation with neuritic plaque distribution. Neuropathol Appl Neurobiol. 1995;21:290–301. doi: 10.1111/j.1365-2990.1995.tb01063.x. [DOI] [PubMed] [Google Scholar]
- 30.Tanzi RE, Gusella JF, Watkins PC, Bruns GAP, St George-Hyslop G, Van Keuren ML, Patterson D, Pagan S, Kurnit DM, Neve RL. Amyloid β protein gene: cDNA, mRNA distribution, and genetic linkage near the Alzheimer locus. Science. 1987;235:880–882. doi: 10.1126/science.2949367. [DOI] [PubMed] [Google Scholar]
- 31.Vandenabeele P, Fiers W. Is amyloidogenesis during Alzheimer’s disease due to an IL-1-/IL-6-mediated ‘acute phase response’ in the brain? Immunol Today. 1991;12:217–219. doi: 10.1016/0167-5699(91)90032-O. [DOI] [PubMed] [Google Scholar]
- 32.Van Eldik LJ, Griffin WST. S100β expression in Alzheimer’s disease: Relation to neuropathology in brain regions. Biochim Biophys Acta. 1994;1223:398–403. doi: 10.1016/0167-4889(94)90101-5. [DOI] [PubMed] [Google Scholar]
- 33.Wisniewski KE, Wisniewski HM, Wen GY. Occurrence of neuropathological changes and dementia of Alzheimer’s disease in Down’s syndrome. Ann Neurol. 1985;17:278–282. doi: 10.1002/ana.410170310. [DOI] [PubMed] [Google Scholar]
- 34.Yeralan O, Zhang S-X, Rovnaghi CR, Griffin WST. Quantitative micro-in situ hybridization. In: Valentino KL, Eberwine JH, Barchas JD, editors. In situ hybridization in neurobiology: Advances in methodology. New York: Oxford University Press; 1993. pp. 108–113. [Google Scholar]